Open Journal of Soil Science
Vol.4 No.8(2014), Article ID:48993,9 pages DOI:10.4236/ojss.2014.48030
Long-Term Effects of Cover Crops on Crop Yields, Soil Organic Carbon Stocks and Sequestration
Kenneth Olson1, Stephen A. Ebelhar2, James M. Lang1
1Department of Natural Resources and Environmental Sciences, S-224 Turner Hall, University of Illinois, Urbana, Illinois, USA
2Department of Crop Sciences, Dixon Springs Agricultural Center, Simpson, Illinois, USA
Email: krolson@illinois.edu
Copyright © 2014 by authors and Scientific Research Publishing Inc.
This work is licensed under the Creative Commons Attribution International License (CC BY).
http://creativecommons.org/licenses/by/4.0/


Received 8 July 2014; revised 9 August 2014; accepted 17 August 2014
ABSTRACT
A 12-year cover crops study on the effects on SOC sequestration, storage, retention and loss and corn and soybean yields was conducted in southern Illinois. The use of cover crops for the maintenance and restoration of soil organic carbon (SOC) and soil productivity of previously eroded soils were evaluated. No-till (NT), chisel plow (CP), and moldboard plow (MP) treatment plots with and without cover crops were established in 2001. The plot area was on sloping with a moderately well drained, eroded soil. The average annual corn and soybean yields were statistically the same for NT, CP, and MP systems with and without cover crops. By 2012, the cover crop treatments had more SOC stock than that without cover crops for the same soil layer and tillage treatment. The NT, CP, and MP treatments all sequestered SOC with cover crops. A pre-treatment SOC stock baseline for rooting zone was used to validate the finding that cover crops sequestered SOC in the topsoil, subsoil and root zone of the NT, CP and MP treatments during the 12-year study. Additional sequestered SOC was lost as a result of being transported off of the plots and retained in lower slopes, transported to the stream or released to atmosphere.
Keywords:Soil Organic Carbon, Soil Erosion, Soil Loss, Soil Organic Carbon Sequestration

1. Introduction
Cover crops have been proposed in the US to increase SOC stock of eroded and degraded soils and to sequester SOC. The use of cover crops in intensive row crop rotations with different tillage treatments has been found to sequester SOC [1] . Chappell et al. [2] found that measuring SOC stocks over an entire carbon estimation area (CEA) over a period of time was a prerequisite to demonstrating that SOC has been stored in the CEA. Only by measuring the impact of soil erosion, transport and deposition can the true impact of management practice on SOC be quantified. Where net removal of SOC by soil erosion exceeds net storage due to management, no measured gain in SOC would be measured even when management practices prove to enhance SOC are implemented [2] . Quantifying SOC movement due to erosion will therefore avoid mistaken assessments of the performance of management practice. It will also encourage adoption of the management practices that store SOC to be consistent with approaches to soil conservation.
Cover crops are grown to protect the soil from erosion and nutrient loss by either leaching or runoff [3] . Cover crops have been shown to reduce off-site sediment transport [4] [5] . Decline of SOC in agricultural systems and increased awareness of its importance to global C budgets has accelerated evaluations of land management impacts on soil C dynamics and storage [6] .
The impact of tillage and cover crops on SOC sequestration (net increase) or loss has been the focus of many studies since these management techniques contribute to atmospheric C loss or sequestration. Olson et al. [1] found cover crops did not affect crop yields but did increase SOC stocks in the root zone for all tillage treatments. In an attempt to further document the long-term impacts of cover crops this study was extended for 4 additional years. The objectives of the second phase were to evaluate the long-term effects of: 1) cover crops on SOC sequestration rate as a result of 12-year of cover crops on NT, CP, and MP tillage systems, 2) the effects of cover crops on long-term corn and soybean yields, and 3) the effect of cover crops on maintenance and restoration of SOC stock and soil productivity of previously eroded soils in southern Illinois.
2. Materials and Methods
A cover crop experiment was established in 2001 at the Dixon Springs Agricultural Research Center in southern Illinois. The soil at the study site was a moderately eroded phase of Grantsburg silt loam (fine-silty, mixed, mesic Typic Fragiudalf) [7] with an average depth of 64 cm to a root-restricting fragipan. The area with an average slope of 6 percent had been in a tillage experiment for 12 years prior to the start of this 2nd phase of the experiment in 2001. Three tillage treatments, NT, CP, and MP were divided and half with cover crops and half without. Starting with corn in 2001, corn and soybean were grown in alternate years. The experimental design was two Complete Latin Squares and each square having three rows and three columns [8] that allowed for randomization of the NT, CP, and MP with 6 replications treatments both by block (row) and by column (figure 1). Random variability in both directions was controlled by this replication. Each tillage treatment was randomized six times in 18 plots with a size of 9 m × 12 m and the plots were half of each plot was with or without cover crops. The columns were separated with 6 m buffer strips of sod. There was a 60 m wide filter strip between the plot area and the drainage way.
In the spring of each year the MP and CP plots were moldboard and chisel plowed followed by disking twice and planting. In even numbered years soybean was planted at 432,000 seeds∙ha−1 with no fertilizer. In odd numbered years corn was planted at the seeding rate of 64,000 seeds∙ha−1 with fertilizers of 218 kg∙ha−1 N, 55 kg∙ha−1 P, and 232 kg∙ha−1 K. Chemical weed control practices were utilized during the study.
Olson [9] and Olson et al. [10] recommended the SOC sequestration protocol used to determine SOC sequestration amount and rate. A line-transect method [11] was used to determine the percentage covered by surface residue. The soil loss rates were calculated using and RUSLE 2 [12] and USLE [13] . Plant population for the center 0.001 ha of each plot was determined by counting at 25 days after planting. As part of this study the corn and soybean yield and plant population data from 2002 to 2012 were collected.
2.1. Field and Laboratory Methods
Soil samples were collected in August of 2000 (the year before the cover crops were established) and in June of 2012 at depths of 0 to 5, 5 to 15, 15 to 30, 30 to 45, 45 to 60, and 60 to 75 cm for SOC determination. These sample layers were combined to represent the topsoil (0 - 15 cm) the subsoil (15 - 75 cm) and root zone (0 - 75 cm). The sampling depth was limited due to the presence of a root restricting fragipan at a 75 cm depth. Previous soil sampling found only trace amounts of SOC present below the 75 cm depth, probably from previous grass roots penetrating the fragipan along the prism faces. Four soil cores, one from near each of the four corners
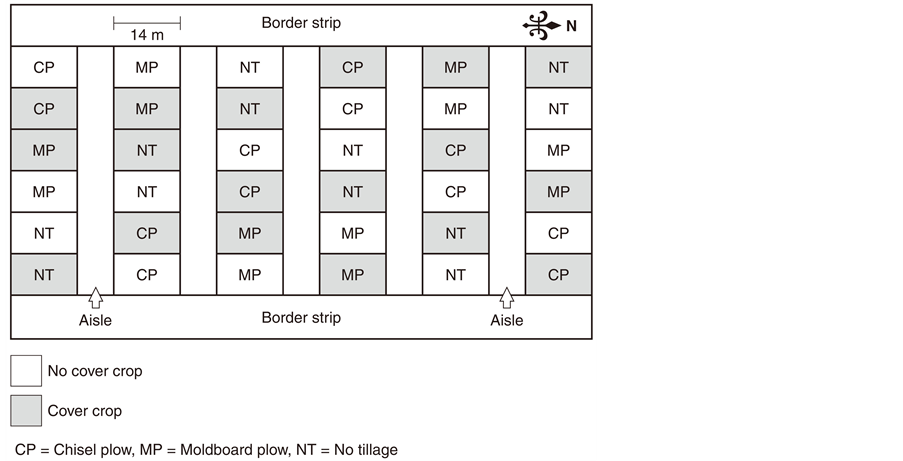
Figure 1. Experimental design used at Dixon Springs with 6 replications of 3 tillage systems. The 18 plots were split at random with half of each planted to cover crops and half without cover crops.
of the plot (1.5 m from adjacent, above or below plot, and 1.5 m from border strip), were obtained for each depth and composited by crumbling and mixing. The samples were air-dried and pulverized to pass through a 2-mm sieve prior to analysis. Field moist core bulk density was determined [14] using a Model 200 soil core sampler manufactured by Soil Moisture Equipment Corp. The SOC stock was determined after removal of undecomposed plant residue using the modified acid-dichromate organic carbon procedure 6A1 [15] .
2.2. Statistical Methods
Statistical analyses for all parameters were performed using the procedures from Statistical Analysis System (SAS) computer software [16] . Analysis of variance and least square means of crop yield, plant population, SOC and bulk density variables were performed by General Linear Model (GLM) procedures. An LSD procedure was used at the P = 0.05 level to determine if there were significant SOC differences between cover crop treatments on each tillage system for the same date and depth.
3. Results
On Grantsburg soil with 5 - 7 percent slopes, the estimated annual soil loss (Table 1), measured with USLE and RUSLE2, were 8.1, 22.4, and 30.1 Mg∙ha−1 with the NT, CP and MP systems without cover crops and 6.2, 18.6, and 24.3 Mg∙ha−1 with cover crops respectively. The higher the percentage of crop residue (Table 1) on the soil surface with the NT system protected the soil from erosion keeping it below the tolerance level of 8.4 Mg∙ha−1∙yr−1. Rill erosion was observed with the MP and CP systems with and without cover crops due in part to lower residue on soil surface compared with the NT system with or without cover crop. The amount of SOC transported per year from the plots by soil erosion is provided by tillage treatment with and without cover crops.
The SOC contents of the Grantsburg of the tillage plots are provided in Table2 To establish the baseline SOC stock values for the root zone of the plot area, measurements were taken in the fall of 2000 from the proposed tillage treatment plot area and prior to the application of the split plot cover crop treatment. Using the proposed experimental design the SOC values shown in Table 2 by treatment for September 2000 represent the mean values of the proposed locations of the 6 NT, 6 CP, and 6 MP plots. The SOC was initially determined by volume (Mg∙layer−1) for the 0 to 5, 5 to 15, 15 to 30, 30 to 45, 45 to 60, and 60 to 75 cm layers and combined into 0 - 15 cm (topsoil), 15 - 75 cm (subsoil) and root zone (0 - 75 cm) layers. This SOC stock was reported in Table2 There were differences between tillage treatments in mean SOC stocks (Table 2) for topsoil, subsoil

Table 1 . Effects of cover crops on tillage system residues after planting and soil loss at Dixon Springs. The residue in even years was from previous year corn and in odd years was from soybean.
*For each tillage treatment and year, means with and without cover crop means followed by the same letter are not significantly different at the P = 0.05 probablility level. #Soil loss is calculated by Universal Soil Loss Equation (USLE) and RUSLE2. SOC content assumes the SOC in the sediment is equal to the SOC content of the topsoil. ##NT = no-tillage; CP = chisel plow; MP = moldbard plow.
Table 2. Use of pre-treatment 2000 SOC stock values for each plot as baseline to determine the total SOC change in 12-year of cover crops for the Grantsburg soils.
Table3 Effects after twelve years of cover crops, tillage and sediment retention on SOC content (Mg∙C∙ha−1∙layer−1 or layer thickness × 100 m × 100 m) retained on the upland landscape (on the plots, in the sediment trapped in the border and filter strips or sod waterway)
*Mean of three replications with the same letter and in the same year, same tillage treatment and depth with and without cover crops are significantly different at 0.05 probability level.
and root zone (above fragipan) in year 2000. The SOC stock of the combined layers (0 - 75 cm) of MP treatment was significantly lower (37.7 Mg∙layer−1) than the NT (47.0 Mg∙layer−1) and CP (43.7 Mg∙layer−1) treatments at start of study. Table 2 shows the SOC stock for the 3 soil layers of the cover crop experiment in year 2012. Significant SOC stock differences between plots with and without a cover crop (Table 2, column 6) for NT and CP for the 0 to 75 cm layer were noted. In the MP treatment the SOC of the combined 0 - 75 cm with and without cover crops was not significantly different. By June of 2012, the cover crop effect for NT resulted in the SOC stock being greater in the 0 - 15, 15 - 75, and 0 - 75 cm layers (Table 2, column 6) when compared to NT plots without cover crops.
It should be noted that for the NT treatment with cover crops that the SOC stock were higher (47.0 vs. 61.1 Mg∙layer−1) after 12-year of cover crop treatment than prior to start of cover crop experiment (year 2000). This suggests that SOC stock losses from water erosion and some disturbance or mixing during NT planting, aeration, nitrogen injection disturbance in corn years and mineralization were less than the SOC gain from the cover crop treatment. The NT system with cover crops did maintained SOC levels and did sequester (increase) SOC (when compared to pre-treatment baseline SOC stock in 2000). For the CP treatment with the cover crops the gain in SOC in the 0 - 15 cm layer (Table 2, columns 5 and 6) was offset by SOC stock loss resulting from years of tillage and erosion. The CP treatment root zone (0 - 75 cm) with cover crop SOC increased from 43.7 to 47.9 Mg∙C∙layer−1 while the MP with cover crops for twelve years had the SOC stock for the 0 - 75 cm layer increased from 37.7 to 44.3 Mg∙C∙layer−1. For the CP and MP treatments, cover crops helped reduce the rate of SOC stock loss as a result of tillage (aeration) associated with corn and soybean production and soil erosion and was able to maintain the 2000 baseline SOC stock levels from before the cover crop treatments were applied.
By 2012, the CP treatments topsoil and rooting zone without cover crops showed SOC stock loss of −4.7 and −1.7 Mg∙C∙ha−1 when compared to 2000 baseline NT systems for 0 - 15 and 0 - 75 cm soil layers (Table 2, column 6). The NT and MP topsoil did lose SOC stock (−0.5 and −1.1 Mg∙C∙ha−1) during the 12 years of the experiment. The differences in SOC stocks between treatments in the tillage zones were attributed to the effects of management on erosion, disturbance, aeration, mineralization and residue incorporation.
By 2012, as a result of years of tillage and corn-soybean production, the SOC on a volume basis in the root zone was greater in NT system with and without cover vs. the CP and MP systems (Table 2, column 5). In the 0 to 15 cm layer, the NT had higher SOC stocks in the surface layer than CP and MP with and without cover crop treatments. This may have been due to the reduced decomposition rate, as a consequence of less soil residue contact, less aeration, and lower soil temperature in NT. The greater SOC stock in the NT system also was result of less soil erosion due to more residues on the soil surface Table 1, column 9. Loss of macro-aggregates and SOC could make the tilled soil more vulnerable to water erosion because of a reduction in its slaking resistance.
The CP with cover crops had more SOC stock in the surface layer than MP plots with cover crops in 2012 apparently due to better mixing of the residue into the surface layer of the MP treatment. SOC stocks in the whole soil changed 8%, −4%, and 14% in the NT, CP and MP systems without cover crops when compared with the 2000 pre-treatment baseline levels so there was SOC sequestration in the NT and MP root zones. With the addition of cover crops to all treatments, the SOC stock gains were 30%, 10%, and 18% respectively. Twelve years of cover crops were effective in restoring and sequestrating SOC for all treatments.
The SOC stock gains from cover crops vs. no cover crop on NT, CP and MP was provided in Table 2, column 5. The NT, CP and MP systems had +10.2, +5.9 and +5.5 Mg∙C∙ha−1 more SOC stock in the 0 - 75 cm layer (root zone). This increase in SOC stock due to cover crops was not necessarily sequestered SOC since they were not validated (compared to the 2000 pre-treatment baseline SOC levels).
The cover crop treatment for each tillage system in Table 2, column 7 did offset the SOC stock loses from CP systems and resulted in gains for the NT, CP, and MP systems of +1.21 Mg∙C∙ha−1∙layer–1∙year−1, +0.35 Mg∙C∙ha−1∙layer–1∙year−1, and +0.55 Mg∙C∙ha−1∙layer–1∙year−1, respectively. The NT system with cover crops and without cover crops sequestered the most SOC when compared to the pre-treatment 2000 baseline SOC stock. The difference between NT rate of change was +0.88 Mg∙C∙ha−1∙layer−1∙year−1 for cover crops, +0.49 Mg∙C∙ha−1∙layer−1∙year−1 for CP and +0.10 Mg∙C∙ha−1∙layer−1∙year−1 for MP.
The effects of 12 years of cover crops and sediment collection on the SOC stocks (Mg∙ha−1∙layer–1∙year−1 or layer thickness × 100 m × 100 m) retained on the lower slope landscape position are shown in Table3 The calculations assume that most or all of the SOC remains attached to the sediment and 50% to 70% of SOC rich sediment is retained in the border and filter strips. Any SOC dissolved in runoff water and not attached to sediment would be delivered to the stream. The mass of the SOC dissolved in the runoff water is not known. How.
#NT = no-tillage; CP = chisel plow; MP = moldbard plow.
ever, the mass of the dissolved SOC is probably rather small when compared to the amount of SOC attached to sediment particles. This dissolved SOC will most likely be quickly returned from the water to the atmosphere as either methane gas or carbon dioxide. The sediment rich in SOC is deposited in the border strips and filter strip located on the lower slope and between the plots and stream. The SOC stored on the lower slope includes both the SOC stored or retained on the cover crop plots and the sediment retained in the border and filter strips.
All treatments with and without cover crops did store and retain transported SOC (Table 1, column 10) in the filter and border strips at the rate of 0.09, 0.07, 0.26, 0.21, 0.35 and 0.28 Mg∙C∙ha−1∙layer–1∙year−1 of SOC (Table 3). The SOC retained on the upland in the filter and border strips is not counted as sequestered SOC for the plot area since it was transported off the plot area but it does still retain the SOC and keeps most of it from getting into the water or atmosphere which reduces the CO2 release to the atmosphere directly or via the water. This sediment rich in SOC was deposited on the uplands (50% to 70%) [17] , in water (10 to 30%) or goes to the atmosphere (20%). The CP without cover crops did not sequester SOC (−0.14 Mg∙ha−1∙layer–1∙year−1) in the root zone but the MP and NT did (Table 3). The amount of sediment rich in SOC retained on the lower slope was the greatest for MP without cover crops since it had the greatest soil loss (30.1 Mg∙ha−1∙year−1) and sediment deposition into the filter and border strips. Cover crops reduced soil loss to 24.3 Mg∙ha−1∙year−1. It appears from the sediment build-up on the footslopes during the past 12 years that most of the SOC rich sediments are still being retained and not immediately going into the stream or atmosphere.
From 2001 to 2012, each tillage treatments (NT, CP and MP) with and without cover crops had statistically similar corn or soybean populations in all 12 years (Table 4). Rainfall data for the 2001-2012 growing seasons are shown in Table5 From 2002 to 2012, cover crops had no affected soybean yields in 2002 and 2006 (CP was significantly greater without cover crops) and did not affect corn yields (Table 6). However, the annual average soybean and the annual average corn yields with and without cover crops for all 3 tillage treatments were not significantly different (Table 6).
4. Discussion
During the 12-year experiment, the SOC stocks in the tillage zone, the subsoil and for the entire root zone increased by 2012 under the NT, CP and MP systems with cover crops. By 2012, cover crop treatments raised SOC stocks of the tillage zone, subsoil, and rooting zone of all tillage treatments. Using the pre-treatment baseline 2000 SOC stocks NT, CP and MP with cover crops sequestered SOC in root zone.
To determine whether SOC sequestration has occurred, it is critical that researchers establish the baseline SOC stock prior to any treatment applications including cover crops. NT, CP and MP treatments with cover crops did sequester and maintained more SOC stock above the 2000 pre-treatment baseline levels. The SOC gains from cover crops were equal to or more than any loss from any disturbance or mixing during planting, nitrogen injection in corn years and erosion during corn and soybean production. SOC sequestration occurred in root zone (0 - 75 cm) for all of the tillage treatments with cover crops which were compared with 2000
Table 4 . Soybean and corn population with and without cover crops at Dixon Springs, Illinois tillage plots.
*Values with and without cover crops in the same tillage treatment and year followed by the same latter are not significantly different at the 0.05 probability level. ##NT = no-tillage; CP = chisel plow; MP = moldbard plow.
Table 5. Rainfall data during the growing seasons from 2001-2012 at Dixon Springs in Southern Illinois.
pre-treatment SOC stock levels (baseline) which validated the findings.
The NT, CP and MP treatments with cover crops did sequester SOC in the root zone for all layers. Once SOC rich sediment leaves the plot the SOC is no longer considered sequestered SOC [9] [10] since SOC left the plot area and it is then deposited on the lower slope, enters the water or goes to the atmosphere. The SOC rich retained sediment from cover crop lots and deposited in the border and filter strips on the lower slope is transported, previously stored SOC and is no longer considered sequestered SOC after it leaves the plot area. However, the transported SOC can be retained as deposited sediments on the lower slopes and not initially returned to the atmosphere or water which could help in reducing CO2 emissions to the atmosphere.
Table 6. Soybean and corn yields of tillage systems with and without cover crops at Dixon Springs, Illinois.
*Values with and without cover crops in the same tillage treatment and year followed by the same latter are not significantly different at the 0.05 probability level. #NT = no-tillage; CP = chisel plow; MP = moldbard plow.
The 12-year average annual corn and soybean yields were statistically the same for NT, CP, and MP systems with and without cover crops. After 12 years of SOC stock increase in the 3 tillage treatments with cover crops, the crop yields were slightly lower for all tillage treatments. Twelve years of cover crops did sequester SOC but did not enhance crop yields.
Acknowledgements
Published with the approval of the Director of the Office of Research at the University of Illinois, Urbana, IL. Funded as part of Regional Research Project 367 and in cooperation with North Central Regional Project NC-1178 (Soil Carbon Sequestration).
References
- Olson, K.R., Ebelhar, S.A. and Lang, J.M. (2010) Cover Crop Effects on Crop Yields and Organic Carbon Content. Soil Science, 175, 89-98. http://dx.doi.org/10.1097/SS.0b013e3181cf7959
- Chappell, A., Baldock, J. and Viscarra Rossel, R. (2013) Sampling Soil Organic Carbon to Detect Change over Time. Report to Grains Research and Development Corp. and Australian Department of Environment, Australia, 1-36.
- Reeves, D.W. (1994) Cover Crops and Rotations. In: Hatfield, J.L. and Stewart, B.A., Eds., Crops Residue Management. Advances in Soil Science, Lewis Publishers, Boca Raton, 125-172.
- Langdale, G.W., Blevins, R.L., Karlen, D., Thomas, D.K., Tyler, D.D. and Williams, J.R. (1991) Cover Crop Effects on Soil Erosion by Wind and Water. In: Hargrove, W.L., Ed., Cover Crops for Clean Water, SWCS, Ankeny, 15-21.
- Dabney. S.M. (1998) Cover Crop Impacts on Watershed Hydrology. Journal of Soil and Water Conservation, 53, 207-213.
- Lal, R. (1999) Soil Management and Restoration for C Sequestration to Mitigate the Accerated Greenhouse Effect. Progressive Environment Science, 1, 307-326.
- Soil Survey Staff (1999) Soil Taxonomy, a Basic System of Soil Classification for Making and Interpreting Soil Survey. U.S. Department of Agr. Handbook 436. 2nd Edition, Government Printing Office, Washington, DC, 869 p.
- Cochran, W.G. and Cox, G.M. (1957) Experimental Design. 2nd Edition, John Wiley and Sons, New York, 615 p.
- Olson, K.R. (2013) Soil Organic Carbon Sequestration, Storage, Retention and Loss in U.S. Croplands: Issues Paper for Protocol Development. Geoderma, 195-196, 201-206. http://dx.doi.org/10.1016/j.geoderma.2012.12.004
- Olson, K.R., Al-Kaisi, M.M, Lal, R. and Lowery, B. (2014) Experimental Consideration, Treatments, and Methods in Determining Soil Organic Carbon Sequestration Rates. Soil Science Society America Journal, 78, 348-360. http://dx.doi.org/10.2136/sssaj2013.09.0412
- Hill, P.R., Manning, J.V. and Wilcox, J.R. (1989) Estimating Corn and Soybean Residue Cover. Agronomy Guide. Purdue University Cooperative Extension Service, West Lafayette.
- Widman, N. (2004) RUSLE2-Instructions and Users Guide. USDA, Natural Resources Conservation Service, Washington, DC.
- Walker, R.D. and Pope, R.A. (1983) Estimating Your Soil Erosion Losses with the Universal Soil Loss Equation (USLE). University of Illinois, Extension Service Circular 1220, Urbana, 19 p.
- Soil Survey Staff (1984) Procedure for Collecting Soil Samples and Methods of Analysis for Soil Survey. Soil Survey Investigations. Rep.1. U.S. Gov. Printing Office, Washington, DC.
- Soil Survey Staff (2004) Soil Survey Laboratory Methods Manual Soil Survey Investigations Report 42, Version 4.0. National Sol Survey Center, Lincoln, Nebraska.
- SAS Institute, Inc. (2001) SAS/STAT Guide for Personal Computers. Version 6 Ed., SAS Institute Inc., Cary, 495.
- Lal, R., Kimble, J.M., Follett, R.F. and Cole, C.V. (1998) The Potential of U.S. Cropland to Sequesters Carbon and Mitigate the Greenhouse Effect. Sleeping Bear Press, Inc., Ann Arbor Press, Chelsea, 128 p.