Theoretical Economics Letters
Vol.06 No.06(2016), Article ID:72149,14 pages
10.4236/tel.2016.66116
The Evolution of Pro-Social Behavior and the Role of the Government
Daniel Farhat
Department of Economics, Radford University, Radford, VA, USA

Copyright © 2016 by author and Scientific Research Publishing Inc.
This work is licensed under the Creative Commons Attribution International License (CC BY 4.0).
http://creativecommons.org/licenses/by/4.0/


Received: October 5, 2016; Accepted: November 18, 2016; Published: November 21, 2016
ABSTRACT
This study explores the impact of government intervention on the evolution of cooperation using a popular framework for understanding cooperative behavior (the public goods game). Agents either contribute to the production of a shared public good or free-ride on the efforts of others. This game traditionally results in mass free-riding (a sub-optimal outcome), in which case a government can intercede by levying taxes and providing the public good to increase welfare. Is this still the case when looking at an evolutionary framework with natural selection? Theoretical results suggest that the government “levels the playing field”, allowing cooperative and uncooperative behavior to coexist longer than it ordinarily would, but it cannot change the course of evolution.
Keywords:
Public Goods Game, Cooperative Behavior, Government Intervention, Evolution

1. Introduction
Sometimes people cooperate and sometimes they do not. Cooperative (pro-social) behavior is desirable as it can improve the welfare of all parties involved. In many cases, however, sustaining cooperation is difficult. When uncooperative (a-social) behavior becomes prevalent, there exists a role for the government (or “central authority”): to mitigate the bad behavior and support the good.
When studying cooperation, researchers often use a popular framework known as the public goods [PG] game. In this game, a good is cooperatively produced by multiple individuals and then shared equally amongst them. Individuals get a share, regardless of their contribution to production. Pro-social agents contribute while a-social agents do not. Economists have used this model to show that rational agents will immediately choose not to contribute, and government intervention (via taxation) is essential to achieve cooperate outcomes. Researchers who study behavioral ecology have developed models in which non-rational agents rely on pre-determined behaviors which evolve over time through natural selection. (One might think of this as agents being born with a pro-social or an a-social “gene”; the most successful genes get passed to the next generation.) The mechanisms that lead to a world where pro-social behaviors are dominant are identified. In this literature, there is little discussion of the role of government or its impact on the evolution of pro-sociality.
This study develops an evolutionary PG game similar to that used by behavioral ecologists. A government is then inserted into this framework. The government operates in a fashion similar to that in economic versions of the game: it forces contribution through taxation. We look at how the government has affected the evolutionary path of pro-social and a-social behaviors. Results show that the government can delay the spread of uncooperative behavior, but cannot stop it with certainty if a-social behavior is meant to dominate. In cases where pro-social behavior is destined to dominate, government intervention allows uncooperative behavior to persist longer than it ordinarily would. In other words, the government “levels the playing field” in terms of domination probability in the evolutionary framework when it attempts to force cooperation.
In the sections that follow, the PG framework and its use in economics and behavioral science are described. A PG model with a government is developed. The evolution of pro-social and a-social behaviors with and without the government is identified. Implications are drawn followed by recommendations for further research.
2. The Public Goods Game in Economics and Behavioral Science
In the PG game, agents engage in the production and consumption of a good. There are two possible strategies: cooperate (C) and defect (D). Cooperators invest resources into the production of the good while defectors contribute nothing. After investments are collected, the good is manufactured and then equally shared by all the agents (regardless of how much they contributed).
A single-play (static) version of the PG game is used in economics to show that rational, self-interested individuals would never coordinate the production of shared goods and, therefore, a government should do it on their behalf. In this version, agents are allowed select their own strategy; the one that yields the highest expected net gain. Agents immediately choose to defect since the net payout from free-riding (where you get benefits, but pay no investment costs) tends to be greater than the net payout from investing into the production of a good which you must then share.
To see this, imagine a scenario where each cooperating agent invests $1 into the manufacture of a shared good. Each $1 investment produces a shared good with a value of . Suppose a total of N agents are playing, M of which are sure to cooperate, N ? M ? 1 are sure to defect, and 1 agent (agent j) has not yet chosen a strategy. If agent j chooses to cooperate, total goods production will be
 , with every agent receiving an equal share (
 ). Agent j’s total gain net of investment costs will therefore be
 . If agent j does not contribute, total goods production will be
 , with each agent receiving
 . Agent j’s net gain is just
  as he did not incur any investment cost. We can show that the net gain from defection will be larger than the net gain from cooperating if
 . If the number of agents playing (N) is large, or if production technology (b) is low, agent j will defect. (Note that M, the number of cooperators, doesn’t matter.) It is not just agent j; any agent choosing a strategy will choose ‘defect’ under this condition. Since all agents choose their strategy at the start of the game, everyone defects at the start, no public goods are produced and no welfare is gained.
A government can intervene in PG game where everyone would ‘defect’ and create welfare. By forcing all the agents to pay a $1 tax, and then invest the proceeds into production on the people’s behalf, the government can increase total production to  and allocate a share to each agent equal to
 . Total net gain for each individual is b − 1 > 0. Everyone is made better off compared to the “all defect” equilibrium. Extensions and further implications of this type of PG game appear in economics textbooks several economics textbooks. For examples, see Fudenburg and Tirole [1] or Varian [2] .
The PG game is also used in the behavioral ecology literature. In this literature, behaviors are not chosen per se; they are the result of a natural selection process in the same way that physical traits are. In these models, there exists a large population of agents. Agent types (C or D) are initially pre-set, and agents play the strategies associated with their type without question. A subpopulation is randomly selected to play the PG game. After the payouts from the game are received, agents reproduce and die. Reproductive fitness and success is dependent on the payouts from the game and the composition of the population. Death tends to be random. Types with a “reproductive edge”, either due to a high payout or due to large numbers, eventually grow to dominate the population. A set of analytical tools can be used by researchers to compute which type eventually dominates, and what factors affect that domination.
There is an extensive literature on evolutionary models of pro-social behavior. Doebeli, Hauert and Killingback [3] , Nowak, Sasaki, Taylor and Fudenberg [4] and Fletcher and Doebeli [5] are just a few examples. These particular studies provide concise methods for developing and analyzing PG frameworks where player strategies evolve. Fletcher and Doebeli’s approach to setting up and solving this class of models influences the model below greatly. A large share of the literature focuses on elements which can be incorporated into the model to drive humanity into altruistic behaviors. The most prominent of these is punishment; see Axelrod and Hamilton [6] , Gintis, Bowles, Boyd & Fehr [7] , Fowler [8] , Rand and Nowak [9] , and Garcia and Traulsen [10] for notable examples of this strand of literature. The behavioral ecology literature, in general, is attempting to resolve two peculiarities: why do pro-social and a-social behaviors coexist, and why are people altruistic with strangers. The mainstream economic approach has more difficulty with this, as agents are often assumed to be entirely self-in- terested and hyper-rational.
As noted by Gowdy [11] in regards to the prevalence of altruism, economists prefer their method despite experimental findings. This study has no intention of convincing them otherwise. We simply take an intuitive result from one method and insert it into another to see what happens. In the study below, a government is added into a model where pro-social and a-social behaviors are pre-set and are subject to a natural selection process. The government collects taxes and supplies public goods. How will the government affect the evolution of behaviors? Will pro-social behaviors dominate when they otherwise would not? Would a-social behaviors dominate when they otherwise would not? The answers to these questions will be discussed in the sections that follow.
3. A Model
Consider an environment populated with two types of agents: cooperators (type C agents) and defectors (type D agents). Let Nc be the number of type C agents and Nd be the number of type D agents; Nc + Nd = N (total population size). At any time, a group of M agents will be randomly selected from the population to play a public goods game. Note that this game is a “local” one; the entire population does not play simultaneously (M < N)1.
In this game, the strategies played by the agents are pre-determined by their type. Type C agents wish to invest a total of 1 unit of their own resources into the production of public goods. Once these goods are produced, they are shared equally amongst all M players. Type D agents do not voluntary invest anything into public goods production; they try to free-ride on the efforts of others.
A central authority exists which intervenes in the game in an attempt to ensure at least some public goods are made. They tax each of the M players a set amount, 0 ≤ t ≤ 1, and invest the proceeds into public goods production. If t < 1, type C agents invest the remainder (1 − t) into production on their own accord.
To evaluate different levels of government efficiency, it is assumed that private investment can yield a different number of goods than government investment. For each 1 unit of investment done by agents privately, b > 1 units of public goods are produced. For each 1 unit of investment done by the government, y > 1 units of public goods are produced.
Given this structure, we can calculate the average (expected) payout that any player can expect to receive at any point in time. This expected payout will depend on how many agents of each type there are and model parameters. Expanding the approach used by Flectcher and Doebeli [5] , we do this by dividing a player’s expected returns into three parts: the part dependent on their own actions, the part dependent on the expected actions of other players, and the part dependent on the government.
From their own actions, a type C player will receive his share of the goods he himself produces minus the private investment cost . Type D players do not privately invest, so they receive nothing from themselves.
From the actions of others, a player of any type will receive a share  from each type C players he expects to interact with. Let ec represent the expected number of other type C players that a type C player can expect to interact with. Similarly, let ed be the number of type C players that a type D player can expect to interact with. Given random group selection, the demography of the other M − 1 players reflects the demography of the remaining population. Therefore:
 (1)
(1)
We can now compute the expected return from the actions of others for any type C player  and any type D player
 .
.
When the government sees a public goods game being played, they tax each player t and invest the proceeds. The government then disburses to each player a share of the output .
.
The total expected returns (g) for each type of player are2:
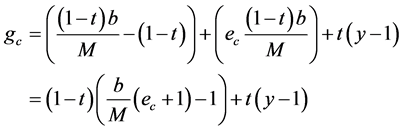 (2)
(2)
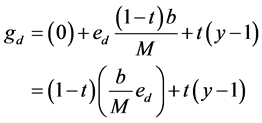 (3)
(3)
In evolutionary models, these expected payouts influence how the population composition evolves. A Moran process is often used to model these dynamics. In the Moran process, one agent is selected to reproduce; offspring are a clone of their parent. One agent is then randomly selected to die. The probability that a type C agent is selected to reproduce (rc) depends on that type’s fitness relative to type D:

where
 (4)
(4)
Similarly, the probability a type D agent is selected to reproduce (rd) is:
 (5)
(5)
Note that reproductive fitness depends on both the type’s expected payout3 and the number of each type in the population. The type with a better payout is more likely to be chosen for reproduction, as is the type with the most numbers.
Given the structure above, we can construct an algorithm to describe the model’s dynamics (see Box 1).
It is possible to compute transition probabilities for type C agents across consecutive periods: the probability that the environment moves from the current state with Nc agents this period to some other state in the next period. Only three other states are possible: a state with one more type C agent (a type C agent is born and a type D agent has died), a state with one less type C agent (a type D agent is born and a type C agent has died), and a state with the same number of type C agents (a type C agent is born and a type C agent has died). These transitions probabilities are:
 (6)
(6)
 (7)
(7)
 (8)
(8)
 is simply the probability a type C agent is selected to reproduce, times the probability a type D agent is selected to die (due to random death selection, this is Nd/N).
  is the probability a type D agent is selected to reproduce, times the probability a type C agent dies (Nc/N). The probability the state remains the same is the remaining probability after the other states are accounted for.
To identify the overall evolutionary path across multiple periods, a more complex analysis is required. Here, it is convenient to turn towards numerical simulation of the algorithm in Box 1. To do this, model parameters (N, M, b, t and y) are pre-set. An initial population of agents is selected. The model in Box 1 is then simulated for J periods, with random draws being used for steps #3 and #4 to update agent demography (Nc, Nd). We evaluate the composition of the population at selected check points to see how the mix of type C and type D agents evolves. Running a large number of such simulations allows us to extract a measure of pro-social dominance probability―the likelihood type C will evolve as the dominate type as measured by the fraction of simulations where a substantial majority of the population is of type C.
4. Analysis
4.1. The Impact of the Government on Expected Payouts
We can evaluate the expected welfare gains or losses imposed by the government within
Box 1.

a period, holding the population numbers constant. When resources are taken from the cooperative agents by the government, they receive government-produced goods but lose out on any gains they could have gotten from investing those resources privately. Holding the population demography constant, Equation (2) suggests:
 (9)
(9)
With an active government, defectors get some government-produced public goods (which they are forced to pay for), but lose out on gains from privately-produced public goods they could have gained from free-riding. Equation (3) suggests:
 (10)
(10)
Note that if there are no cooperative types (Nc = 0, therefore ed = 0), then government activity will surely improve the welfare of people, as suggested by economists. Also note that the level of government efficiency (y) matters; a low y is more likely to result in welfare loss.
4.2. The Impact of the Government on Transition Probabilities
Cooperative agents with have an evolutionary edge if . Holding the population numbers constant, it can be shown that this condition will be satisfied if t < 1 and:
 (11)
(11)
The derivation of this condition is provided in Appendix A. Notice that pro-social behavior is supported by low game size (low M) and high production technology (high b) only. The demography of the population and the activities of the government are inconsequential.
Appendix A also shows that if the government is the sole provider of public goods (t = 1), then neither type will have an evolutionary edge. In other words, the government can “level the playing field”. Appendix B shows that a partial leveling of the playing field is also possible; any level of government intervention (0 < t < 1) will reduce the evolutionary edge of the pro-social type provided they have such an edge with no government intervention. The government cannot cause a complete reversal in evolutionary advantage, however. Appendix C shows that if type C is advantaged without an active government, they will be advantaged with an active government (provided t < 1).
4.3. The Impact of the Government on Overall Evolution
To evaluate the impact of government intervention on the entire evolutionary path, the model in Box 1 is simulated 1000 times with 20,000 periods in each simulation. In each simulation, a virtual world is populated by N = 100 artificial agents. At the start of each simulation, each individual agent’s type (C or D) is determined by a fair coin toss; the expected fraction of each type in the population is therefore 50%. The agents play games in groups of M = 5 players. Private technology (b), government technology (y) and taxes (t) are used for experimentation purposes. Table 1 shows the fraction of simulations where type C accounts for more than 90% and less than 10% of the population and different checkpoints in the simulation.
Experiments A, B and C in Table 1 have no active government (t = 0) and varying levels of productive technology (b). In experiment A, Equation (11) holds with equality ( ) meaning that neither type has a pre-ordained evolutionary edge from game-play. Type C is given an edge in experiment B (
 ; Equation (11) holds) and type D is given an edge in experiment C (
 ; Equation (11) does not hold). Table 1 shows that if neither type starts with an advantage, type C dominates the population in 50% of simulated environments by period 20,000. If type C has an edge, this
Table 1. Simulation results.
fraction rises to 99%. If type D has the edge, the fraction falls to 1%. Instances of non-dominance by period 20,000 where the proportion of type C agents falls between 10% and 90% are fairly rare. These results are expected: give one faction an edge and they grow to dominate; if nobody as an advantage then it’s anyone’s game.
Experiments D, E and F in Table 1 are the same experiments as A, B and C but with a full, efficient government (t = 1 and b = y). In these experiments, type C comes to dominate in approximately 50% of the simulations, regardless of whether they have an edge or not. These results mean that an active government could give cooperative agents a chance to thrive in environments where they ordinarily would not (experiment C versus F). On the other hand, the government does the same for non-cooperative agents (experiment B versus E).
Experiment G corresponds to experiment D (no edge) with the government taxing a reduced amount (t = 0.5) to see if the speed of the evolutionary path depends on the size of government taxes; it seemingly does not. Experiment H shows what happens to experiment G if the government is less efficient (y < b). Again, no significant difference seems to appear.
Experiment I and J correspond to experiment B and C with an efficient government taxing a reduced amount (t = 0.5 and b = y). Comparing the results, we see that the government has reduced the edge of the initially dominate type, allowing some virtual worlds to be dominated by the other. The government has also slowed the rate at which dominance of the favored type develops across virtual worlds. For example, compare experiment B with experiment I. In experiment B, 15.6% of virtual worlds were dominated by cooperative types by period 1000. In experiment I, this frequency of dominance was not reached until period 1550.
5. Conclusions
How might the government affect the evolution of pro-social behavior? The results above suggest the government can reduce a type’s reproductive edge, but it cannot reverse the course of evolution with certainty. In other words, if a society filled with a-sociality is our initial destiny, the government can either slow its ascent a bit or, at best, give us a 50 - 50 chance to have one ending with complete altruism. The government cannot ensure good behavior. The result works in the other direction, however. If a world of altruism is at the end of our evolutionary path, government intervention will allow a-social types to exist longer than they otherwise would, or perhaps give them chance to dominate. In one situation the government is helping, and in the other case they are harming. If true, the government needs to consider the quantity and timing of public goods provisions quite carefully.
This study provides insights on cooperative behavior by mixing together two perspectives: one from economics (a government is needed to achieve cooperative outcomes) and one from behavioral ecology (behaviors that evolve via natural selection). Further research to assess the government’s impact on overall welfare along the evolutionary path is required. This study does not assess the impact of switching on a government mid-simulation. Alternative roles for the government are not explored in this study; including government efforts to stabilize people’s income, for example, might affect evolution. Agents follow heuristics and are not rational. Since rational behavior is typically assumed in economics, improving the cognitive abilities of the agents might add further insights. How these findings tie into the behavioral ecology literature on punishment is also worth consideration, as an added role of the government is to punish those who engage in a-social behavior. These results are left for future work.
Cite this paper
Farhat, D. (2016) The Evolution of Pro-Social Behavior and the Role of the Government. Theoretical Econo- mics Letters, 6, 1230-1243. http://dx.doi.org/10.4236/tel.2016.66116
References
- 1. Fudenberg, D. and Tirole, J. (1991) Game Theory. MIT Press, Cambridge.
- 2. Varian, H. (2014) Intermediate Microeconomics: A Modern Approach. Norton, New York.
- 3. Doebeli, M., Hauert, C. and Killingback, T. (2004) The Evolutionary Origin of Cooperators and Defectors. Science, 306, 859-862.
http://dx.doi.org/10.1126/science.1101456 - 4. Nowak, M., Sasaki, A., Taylor, C. and Fudenberg, D. (2004) Emergence of Cooperation and Evolutionary Stability in Finite Populations. Nature, 428, 646-650.
http://dx.doi.org/10.1038/nature02414 - 5. Fletcher, J. and Deobeli, M. (2009) A Simple and General Explanation for the Evolution of Altruism. Proceedings of the Royal Society B, 276, 13-19.
http://dx.doi.org/10.1098/rspb.2008.0829 - 6. Axelrod, R. and Hamilton, W. (1981) The Evolution of Cooperation. Science, 211, 1390-1396.
http://dx.doi.org/10.1126/science.7466396 - 7. Gintis, H., Bowles, S., Boyd, R. and Fehr, E. (2003) Explaining Altruistic Behavior in Humans. Evolution and Human Behavior, 24, 153-172.
http://dx.doi.org/10.1016/S1090-5138(02)00157-5 - 8. Fowler, J. (2005) Altruistic Punishment and the Origin of Cooperation. Proceedings of the National Academy of Sciences of the United States of America, 102, 7047-7049.
http://dx.doi.org/10.1073/pnas.0500938102 - 9. Rand, D. and Nowak, M. (2011) The Evolution of Antisocial Punishment in Optional Public Goods Games. Nature Communications, 2, 1-7.
http://dx.doi.org/10.1038/ncomms1442 - 10. Garcia, J. and Traulsen, A. (2012) Leaving the Loners Alone: Evolution of Cooperation in the Presence of Antisocial Punishment. Journal of Theoretical Biology, 307, 168-173.
http://dx.doi.org/10.1016/j.jtbi.2012.05.011 - 11. Gowdy, J. (2004) Altruism, Evolution, and Welfare Economics. Journal of Economic Behavior and Organization, 53, 69-73.
http://dx.doi.org/10.1016/S0167-2681(03)00105-7
Appendices
Appendix A
Pro-social behavior with have an evolutionary edge if . Using Equations ((6) and (7)):

Using Equations ((4) and (5)):

Therefore:

By definition:

Substituting Equations ((2) and (3)) suggest:

If t < 1, this condition becomes:

From Equation (1):

Therefore:

Note that this condition does not depend on the population demography at all nor on the actions of the government, only on model parameters.
If t = 1, then the expected payouts for both types will be identical:


As a result, fc = fd and the birth probabilities depend only on relative numbers:

A newly birthed agent is likely to be whatever type has the larger numbers. Since the type with larger numbers is also more likely to be selected to die, the transition probabilities equate. From Equations ((6) and (7)):


Type C will have no edge if t = 1. The government will have “leveled the playing field”.
Appendix B
Consider an environment that transitions from no government intervention (t = 0) to active partial intervention (0 < t < 1). Let  be the positive pro-social transition probability for the no-government case and
  be the positive pro-social transition probability for the partial government case. Government intervention will always reduce the reproductive edge of type C if
  for any t.
Holding the population demography fixed, we can use Equation (6):

Using Equation (4):

Rearranging suggests:

This, in turn, suggests:


From Equations ((2) and (10)):

From Equations ((3) and (11)):

Combining these results suggests:


Note this condition does not depend on the value of t. Appendix A shows that this condition is the same one that establishes a reproductive edge for type C players. In other words, if type C players have a reproductive edge before any sort of government intervention is established, then this edge will be lessened once the government becomes active.
Appendix C
Although the government diminishes the evolutionary edge of pro-social types (when they have the edge), the government cannot reverse it. To prove this, we need to show that if type C agents have an evolutionary edge before the arrival of a government (t = 0), they will also have an evolutionary edge afterwards (0 < t < 1), holding the population demography constant.
As in Appendix B, let  denote the transition probability for the no-government case and
  denote the transition probability for the partial government case. We need to show that if
 , then
 .
.
Appendix A shows:

This condition allows us to derive the structural condition under which type C has the evolutionary edge ( ). Let us suppose this is true. From this condition, a trivial transformation implies:

The left-hand side of this equation is the type C average payout with the government ( ). The right-hand side is the type D average payout with the government (
 ). This equation suggests:

Note that:

By definition:

Therefore:

By definition:

Hence, although type C’s advantage might diminish when the government arrives, they will not find themselves at a disadvantage.

Submit or recommend next manuscript to SCIRP and we will provide best service for you:
Accepting pre-submission inquiries through Email, Facebook, LinkedIn, Twitter, etc.
A wide selection of journals (inclusive of 9 subjects, more than 200 journals)
Providing 24-hour high-quality service
User-friendly online submission system
Fair and swift peer-review system
Efficient typesetting and proofreading procedure
Display of the result of downloads and visits, as well as the number of cited articles
Maximum dissemination of your research work
Submit your manuscript at: http://papersubmission.scirp.org/
Or contact tel@scirp.org
NOTES

1It can be shown that when this is the case, the evolutionary process will always favor type D. See Fletcher and Doebeli [5] for this result.

2Note that these expected payouts are not actual payouts for any individual player which ultimately depend on real game-play.
3The exponential function is used here to transform game payouts (gc) because these payouts may be negative given the structure of the game described above. If no transformation is made, this may lead to negative reproduction probabilities, which is nonsensical.