Open Journal of Genetics
Vol.3 No.1(2013), Article ID:29004,12 pages DOI:10.4236/ojgen.2013.31003
Phylogenetic analysis and characterization of mitochondrial DNA for Korean native cattle
![]()
1Animal genomics & Bioinformatics Division, National Institute of Animal Science, Suwon, Korea
2Bovine Functional Genomics Laboratory ARS/USDA, Baltimore, USA
Email: chung133@korea.kr
Received 25 January 2013; revised 27 February 2013; accepted 4 March 2013
Keywords: mtDNA; Cattle; SNP; Haplotype; Genetic Distance
ABSTRACT
This study was aimed to preserve mitochondria from liver tissues of Korean native cattle (KNC) as genetic resources and to analyze phylogenetic relationships among cattle breeds using the whole sequences of mtDNA. Mitochondria of KNC has been isolated with the alkaline lysis procedure using 1 g of liver tissues, and measurements showed numbers of cells (2.64 × 10¹⁰), concentration (114.6 ug/ml), proteins (0.278 ug/ml), and absorbance (0.029) in 260 nm. Mitochondrial DNAs (mtDNA) were extracted from the isolated mitochondria to determine whole sequences that can be used to estimate genetic distances among cattle breeds. Designing of primers based on the bovine mtDNA sequence was resulted in 16 primer sets covering the whole mtDNA regions. The analysis of 40 KNC mtDNA sequences revealed 69 polymorphic sites that were less than the average number of SNP (single nucleotide polymorphism) for other populations (82 sites) in this study. As expected, the highest observation of SNPs was found in the D-loop region, and a total of 29 SNPs were shared between cattle populations. The haplotype analysis, which used 13 SNPs located in D-loop, COX2, ND5, CYTB, and non coding regions, revealed that KNC showed clearly different haplotypes that may be used to distinguish KNC from other breeds as well as to characterize individual identifications. The phylogenetic analysis revealed that KNC showed a relatively close genetic distance with Japanese black cattle (JBC) comparing with other breeds. Estimations of the average nucleotide diversity (0.0008) and the ratio of transition/ transversion (0.1050) of KNC were placed somewhere in the middle of genetic diversity among cattle breeds. The identified genetic variants and results of phylogenetic analysis will help understanding the phylogenetic relationships of KNC and provide useful genetic information for further studies regarding SNPs in mtDNA regions.
1. INTRODUCTION
Phylogenetic or population genetic studies have been focused on finding genetic variations in mitochondrial DNA (mtDNA) because mutations in this region contained 5 times higher than other genetic materials [1,2]. According to genetic structures and segregation patterns of mtDNA following material inheritance systems, the analysis of mtDNA can be used for tracing back the origins of breeds as well as identifying individual animals. Formation of mtDNA, which showed nonrecombining patterns in nature of animals, revealed as a closed circular double helix DNA sizing approximately 16,500 bp encoding 13 hydrophobic polypeptides, 22 tRNAs, and 2 rRNAs [3,4].
In general, searching genetic variants in mtDNA has been focused on the D-loop region that was mainly used to analyze genetic distances among breeds due to huge mutations [1,5]. Genes in mtDNA are also available to characterize breeds and individuals in phylogenetic studies [6,7], but a few reports are available for SNPs from the coding regions because studies believed that SNPs in coding regions may not be available to explain genetic diversity with low frequencies of genetic variations. It is still, however, required that uses of the whole mtDNA sequences are needed to estimate the genetic relationships among breeds, to characterize the breed specificity, and to identify individuals.
KNC, which is a unique Bos Taurus breed, has limited numbers of studies for identifying genetic relationships among cattle breeds using the entire mtDNA. It may be an essential process how the genetic constitution of mtDNA has been distributed in KNC populations. Up until now, KNC has not been genetically verified using mtDNA sequences of the frequently used sire lines. In addition, the mtDNA analysis can define genetic relationships within breeds to assume degrees of similarities between individual animals. This study was, therefore, aimed to build whole mtDNA sequences of KNC from frequently used sire lines, to isolate mitochondria from liver tissues as genetic resources, to identify hot spots accounting for genetic distances, and to characterize phylogenetic relationships among cattle breeds as well as individuals.
2. MATERIALS AND METHODS
2.1. Animals
This experiment has been approved by the ethics and welfare committee of National Institute of Animal Science (NIAS) for all requirements of experiment guidelines. The liver samples from 40 KNC, which were taken from a slaughter unit at the National Institute of Animal Science in Korea, were applied to extract mitochondria. The animals showing different pedigrees without sharing common sires were selected to maximize finding possibilities of genetic variants in KNC. Approximately, 10 g of liver samples for each individual were taken and preserved at −70˚C until used.
2.2. Sample Preparation
The frozen liver tissue was removed from a deep freezer and placed on ice to facilitate thawing for 1 hour. To prevent any contamination of nuclear DNA, blood clots and connective tissues were removed. Approximately, 1 g of liver tissues was sliced into a disposable dish with a razor blade. The tissue free membrane was cut into small pieces and washed with 5 volumes of 0.9% NaCl for 3 times. Sliced tissues were put in 5 volumes of cold homogenizing buffer A (0.25 M Sucrose, 0.1 mM EDTA, and 3 mM Tris-HCl, pH 7.4), and after brief centrifugation at 1000 rpm for 5 minutes, the tissue was transferred into a 15 ml new conical tube. The tissue was homogenized 3 times for 30 seconds at 500 rpm using a 5 ml of Teflon Pestle Homogenizer (Wheaton) and then centrifuged at 700 g for 5 min at 4˚C. The supernatant was transferred to a new conical tube, and an equal volume of homogenizing buffer B (0.25 M Sucrose, 0.1 mM EDTA, and 3 mM Tris-HCl, pH 7.4) was added. The supernatant was collected after centrifugation at 700 g for 10 min at 4˚C. Finally, mitochondria were collected using centrifugation at 7000 g for 10 min at 4˚C and resuspended in 2.5 volumes of homogenizing buffer A. The collected mitochondria were diluted with a PBS buffer, and an equal volume of 0.4% Gimsa staining solution was added. The stained cells (approximately 20 ul) were applied to a slide glass covered with a Hemocytometer (Fisher Scientific) on a microscope at 400 X (Nikon TE 2000-U). Protein concentrations and absorbance were measured by a spectrophotometer (GeneQuant II, Pharmacia Biotech).
2.3. Mitochondrial DNA Extraction
Two volumes of lysis buffer (0.5 M Sodium Acetate, 10 mM Tris-HCl and EDTA, and 0.5% Sarkosyl) were added to a solution containing mitochondria, and the suspension was thoroughly mixed by soft pipetting and stood at room temperature for 30 minutes. DNase free RNase (20 mg/ml in 0.1 M Sodium Acetate, pH 4.5) was added (300 ul) to the mitochondrial lysate and stood at room temperature for 20 minutes. After incubation, 1/3 volume of 3 M Sodium Acetate was added and then centrifuged at 7000 g for 10 min at 4˚C. The supernatant was transferred into a spin column (Neclogen, Korea) to bind mtDNA. After washing the column 2 times with a washing buffer containing 70% of ethanol, mtDNA was eluted by water, and concentration and purity of mtDNA were measured by a spectrophotometer (GeneQuant II, Pharmacia Biotech).
2.4. Amplification Primers
To amplify the whole mitochondrial genome, a total of 16 primer sets were designed based on the bovine mtDNA sequence (a GenBank accession number, J01394) with options of overlapping at least 200 bp between primer sets, 60% of GC contents, and approximately 1200 - 1600 bp of amplification lengths (Table 1). PCR has been conducted with a final volume of 20 ul, including 2 ul of 10 X reaction buffer (10 mM Tris, pH 8.3, 50 mM KCl, 0.1% Triton X-100, and 1.5 mM MgCl2), 25 mM dNTP, 10 pM of each primer, 30 ng of mtDNA, and two units of Taq DNA polymerase. After denaturation for 2 min at 95˚C, a total of 35 amplification cycles were adapted to 94°C/45sec for denaturation, 54˚C through 57˚C/1min for annealing, and 72˚C/1.5min for polymerization (MJ research P-200). Optimal PCR conditions were adjusted with the gradient amplification process.
2.5. Sequencing and Phylogenetic Analysis
Amplification products were purified using PCR purification kits (Nucleogen, Korea), and a direct sequencing was conducted with an ABI 3730XL Genetic Analyzer using forward and reverse primers. The sequencing analysis duplicated PCR amplifications and sequencing reactions to minimize base calling errors. The sequences were aligned by DNAstar version 6.0, and the newly identified sequences of KNC were submitted to GenBank with an accession number. Individual sequences were aligned to find genetic variants with the Seqman program of DNAstar version 6.0. The haplotype analysis was conducted to find genetic differences and to distinguish breed specificities using commonly observed 13 SNPs (nucleotide positions 169, 7776, 11035, 12158, 12684, 15510, 16042, 16074, 16093, 16119, 16122, 16255 and
Table 1. Primer sequences, PCR conditions, and sizes of segments for the bovine mtDNA.
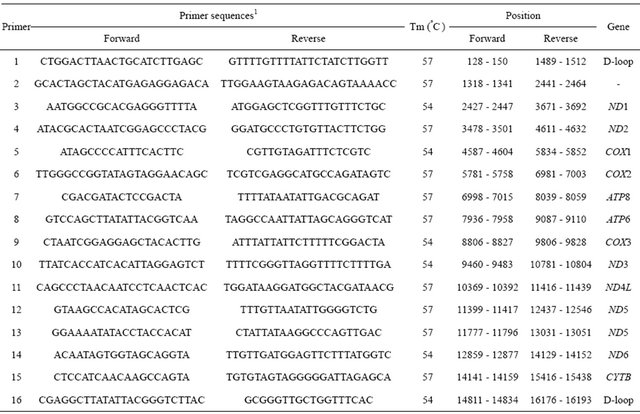
1The primer selection was based on a GenBank accession number (J01394).
16302) located in COX2, ND5, CYTB, D-loop and noncoding regions. A construction of the haplotypes was performed with HAPSTAT version 3.0. To maximize finding genetic differences among cattle breeds, a total of 113 sequences from the GenBank with accession numbers that may represent cattle breeds (Table 2) were used. Genetic distances among cattle breeds were analyzed using a DNAdist option (DNA distance matrix, Bio-edit version 7.0.1) to identify a neighbor phylogenetic relationship.
3. RESULTS
3.1. Mitochondria and mtDNA
The previously published protocol, which used two major steps for precipitation and centrifugation with the alkaline lysis to purify mitochondria from the human tissues [8], was based with adding more steps of precipitation and centrifugation that ensured the high quality of mitochondria without contamination. Mitochondria has been successfully isolated using 1 g of liver tissues showing 2.64 × 10¹⁰ cells that were enough to preserve mitochondria as genetic resources and to isolate mtDNA for further analysis of genetic variants. Concentrations (114.6 ug/ml), proteins (0.278 ug/ml)and absorbance (0.029) in 260 nm of mitochondria were measured. mtDNA also has been extracted from the isolated mitochondria and used to amplify segments. The specific oligo nucleotides produced approximately 1200 - 1600 bp of DNA segments that covered whole mtDNA regions due to overlapping designs of primers between amplified fragments. Each PCR reaction showed clear images without extra contaminated DNA bands (Figure 1). After verification of segments using direct sequencing analysis, alignments were conducted with the sequenced files for each individual, and complete contigs of mtDNA, which revealed approximately 16,388 bp showing similar sequence lengths compared with several cattle breeds from the GenBank, were obtained.
3.2. Sequence Analysis
As shown in Table 3, sequence analysis revealed 11 distinctive SNPs (nucleotide positions at 7776, 11,035, 11,174, 12,158, 12,684, 15,510, 16,042, 16,093, 16,119, 16,122 and 16,302), which defined 40 KNC animals into 3 major groups based on values of sequence identity. Each group showed significantly high allele frequencies for all SNP locations except 3 SNP (11,174 and 12,158, and 12,684). In contrast with the reference, which was consisted of all animals except KNC, all SNP locations
Table 2. Information of mitochondrial DNA sequences for cattle breeds with GenBank accession numbers.
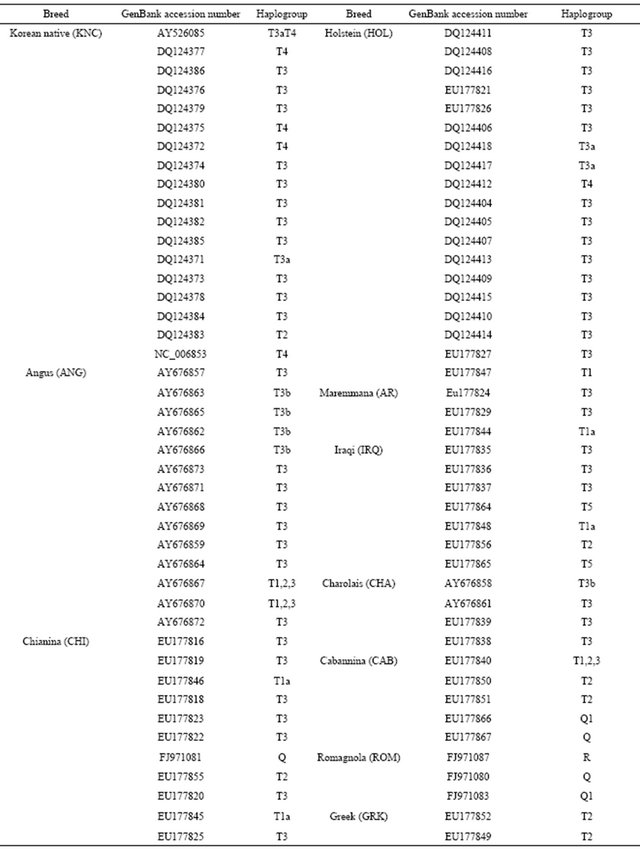
Continued
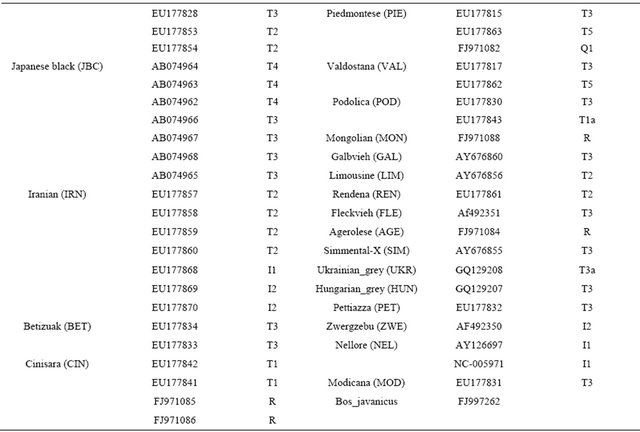
Table 3. Characterization and distribution of distinct SNP in KNC.
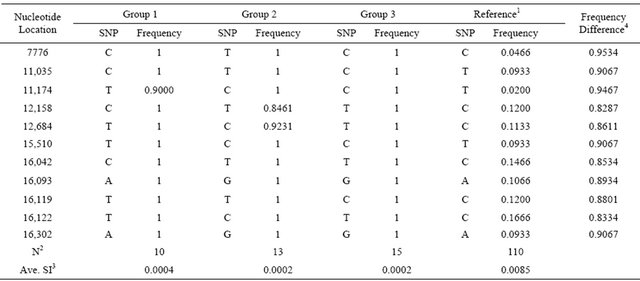
1Reference: All animals except KNC; 2N: Number of animals; 3SI: Average sequence identity was measured using the whole mtDNA sequences with sequence identity matrix programs of Bio-edit version 7.0.1.; 4Differences of allele frequencies between the averaged KNC and the reference populations.
revealed significantly different frequencies that may be effectively used to characterize KNC individuals. The maximum and minimum differences of frequencies were 0.8287 and 0.9534, respectively.
Sequence analysis revealed that a total of 69 SNP were identified in KNC (Table 4). As long as this study was to identify the genetic relationship of KNC against other breeds, 113 mtDNA sequences from the GenBank with
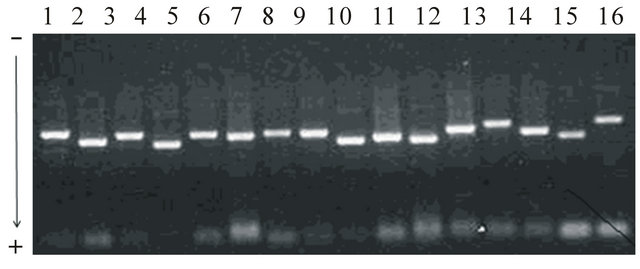
Figure 1. Mobility patterns of electrophoresis for 16 primer sets to amplify mtDNA sizing approximately 1200 - 1600 bp. To amplify the entire mitochondrial genome, a total of 16 primer sets, which covered whole mtDNA (approximately 16,388 bp), were designed based on the bovine mtDNA sequence (a GenBank accession number, J01394) with options of overlapping at least 200 bp between primer sets, 60% of GC contents, and approximately 1200 - 1600 bp of amplification lengths. PCR has been conducted with a final volume of 20 ul, including 2 ul of 10 X reaction buffer (10 mM Tris, pH 8.3, 50 mM KCl, 0.1% Triton X-100, 1.5 mM MgCl2), 25 mM dNTP, 10 pM of each primer, 30 ng of mtDNA, and two units of Taq DNA polymerase. After denaturation for 2 min at 95°C, a total of 35 amplification cycles were adapted to 94°C/45 sec for denaturation, 54°C through 57°C/1min for annealing, and 72°C/1.5min for polymerization (MJ research P-200). Optimal PCR conditions were adjusted with the gradient amplification process.
accession numbers representing 30 cattle breeds were used to compare genetic differences that confirmed 78 SNP in other cattle populations (OTH) consisted of 25 Bos Taurus breeds except Angus (ANG), Holstein (HOL) and Japanese Black Cattle (JBC). Comparisons of sequences identified variations in ANG, JBC, and HOL breeds showing 65, 22, and 78 SNP, respectively, and a total of 742 SNP across all populations in this analysis were confirmed. KNC showed similar distributions of polymorphic sites with ANG, whereas very low numbers of SNP were detected in JBC. The result was not absolutely confident with JBC because the analysis was only based on sequences from the GenBank providing limited numbers of sequences. On the other hand, the possible answer for low observations of SNP in JBC would be a very tight gene fixation by maintaining a robust crossbred population that represents unified phenotypes. The distributing patterns of SNP in coding regions between breeds were not significantly differed from each other except for JBC. A total of 29 SNP in 9 regions (D-loop, ND1, COX2, ATP6, ND5, COX3, ND6, CYTB, and non-coding) were commonly observed among breeds (Table 3).
As expected that the D-loop region contained huge
Table 4. Number of SNP in each region of the bovine mtDNA.
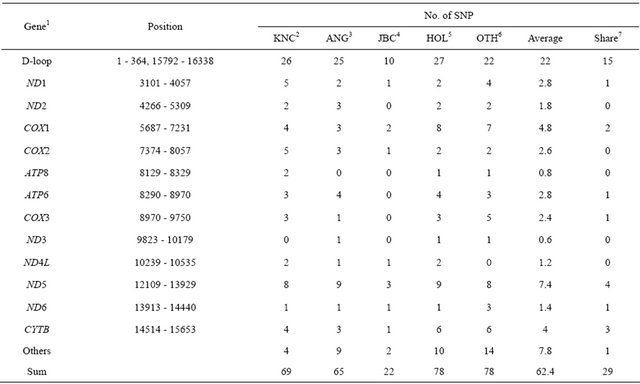
1ND1: NADH dehydrogenase subunit 1, ND2: NADH dehydrogenase subunit 2, COX1: cytochrome C oxidase subunit I, COX2: cytochrome C oxidase subunit II, ATP8: ATP synthase F0 subunit 8, ATP6: ATP synthase F0 subunit 6, COX3: cytochrome C oxidase subunit III, ND3: NADH dehydrogenase subunit 3, ND4L: NADH dehydrogenase subunit 4L, ND5: NADH dehydrogenase subunit 5, ND6: NADH dehydrogenase subunit 6, CYTB: cytochrome B, and others (not included in genes); 2 - 5KNC: Korean native cattle, ANG: Angus, JBC: Japanese black, and HOL: Holstein; 6OTH: all breeds except KNC, ANG, JBC, and HOL; 7SNPs were shared among cattle breeds.
mutation sites as a hot spot to analyze genetic distances and diversities among cattle breeds as well as individuals, the highest observation of SNP was detected in the region occupying approximately 35.25% of total SNP. The lowest observation of SNP, which showed less than 2 SNP, was observed in ND2, ATP8, ND3, ND4L, and ND6 genes. The most obvious point of this study was that unique nucleotides, which may be enough to distinguish JBC from other cattle breeds, were detected at nucleotide positions 2536 (A/C) and 9682 (C/G). In addition, JBC revealed the unique pattern of sequences at a nucleotide position 587 showing a deletion site that was not observed in any other breeds. However, significant SNP that can differentiate breed specificity were not observed in KNC as well as other breeds, and the results may be expected because KNC including most of the Bos Taurus breeds came from the same haplogroup (T3) in terms of evolutionary pathways. Of the 69 SNP in KNC, 46 synonymous and 23 nonsynonymous mutations were observed. In contrast, significantly high numbers of mutations (55 synonymous) were detected in other populations. Overall, the percentage of synonymous SNP in KNC was less than other breeds except JBC, and these nucleotide positions may be efficiently used to construct haplotypes for characterization of individuals and breeds.
Characterization of KNC has been confirmed with haplotypes compared with other breeds (Table 5). The 13 SNP (nucleotide positions 169, 7776, 11,035, 12,158, 12,684, 15,510, 16,042, 16,074, 16,093, 16,119, 16,122, 16,255, and 16,302), which were commonly observed in cattle populations, were selected, and 5 to 20 haplotypes were constructed using KNC, JBC, HOL, ANG, and OTH. JBC revealed the highest numbers of haplotypesTable 5. Frequencies of haplotypes using 13 commonly observed SNP in cattle populations.
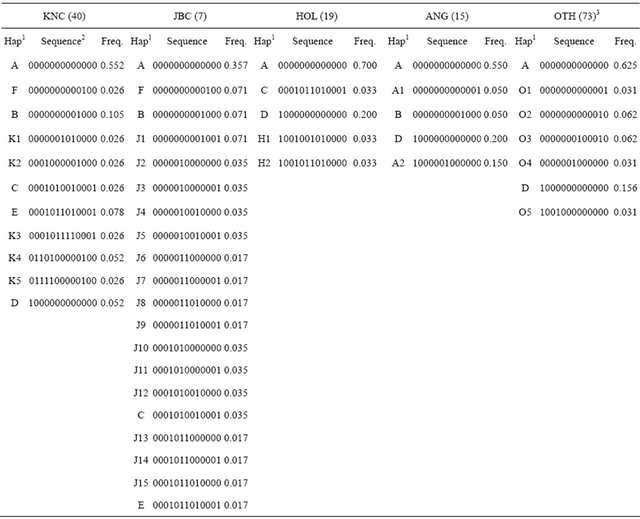
1Haplotypes (A to F haplotypes were shared between populations); 2Each nucleotide was encoded 0 and 1 for SNP at positions 169, 7776, 11,035, 12,158, 12,684, 15,510, 16,042, 16,074, 16,093, 16,119, 16,122, 16,255 and 16,302, and the positions were based on a GenBank accession number (AY526085); 3OTH stands for other breeds except KNC, Japanese Black, Holstein-Friesian, Angus as well as Bos Indicus breeds (Nellore and Zwergzebu).
and the results may be caused by relatively low observation of SNP. KNC showed 11 haplotypes showing that 55.26% of individuals were in haplotype A that was a common haplotype formed with all homozygous genotypes for all SNP. The six common haplotypes (A - F) were differently distributed among cattle populations, and some of the haplotypes presented significantly different frequencies; for example, frequencies of haplotype D (1000000000000) were estimated in KNC (0.052), HOL (0.200), ANG (0.200), and OTH (0.156). Except for 6 major haplotypes in KNC, 15.78% of haplotypes (K1 to K5), which may increase to identify the breed specificity, did not share haplotypes with other breeds. The obvious point was that KNC shared 5 haplotypes (A, B, C, E, and F) with JBC while 2 to 3 haplotypes were shared between KNC and other breeds. The results also showed clear genetic differences between populations, meaning that the identified haplotypes may be used to characterize breed specificities of KNC from other cattle breeds.
Sequence identities were estimated to characterize individuals in each breed, and the average estimation showed JBC (0.0005), HOL (0.0006), ANG (0.0008), and KNC (0.0008). There was a high sequence similarity in a couple of KNC individuals showing only a nucleotide difference at a position 16,112 (T/C). The sequence analysis identified SNP (nucleotide positions 12,158, 15,510, 16,042, and 16,093) occupying 76.66% of polymorphic patterns against for KNC. Thus, forming haplotypes regarding characteristics of individuals for KNC may be possible according to combinations of SNP based on 4 major SNP, and the results may be applied to other breeds. The most important point regarding all cattle breeds may be 3 nucleotide positions (169, 7776, and 16,255) that could be hot spots for all cattle breeds because these SNPs maximized differences of genetic distances (Figure 2). In addition, three breeds (AGE, NEL, and ZWE) were significantly influenced for estimating genetic distances by using 13 SNP.
3.3. Nucleotide Diversity
Two breeds (IRQ and IRN) revealed very high numbers of polymorphic sites (285 - 288 SNPs) comparing with other breeds, and some of the breeds (JBC, MAR, POD, and VAL) showed very low polymorphic sites less than 10 SNPs in coding regions (Table 6). More SNP in IRN and IRQ may be caused by severe differentiation from the main stream of genetic diversity in the whole mtDNA regions. The results were also supported by the significantly high values of nucleotide diversity for IRN (0.005215) and IRQ (0.006391) in the whole mtDNA regions. The highest and lowest nucleotide diversities were 0.006391 (IRQ) and 0.000530 (JBC), respectively. The estimation of average nucleotide diversity of KNC
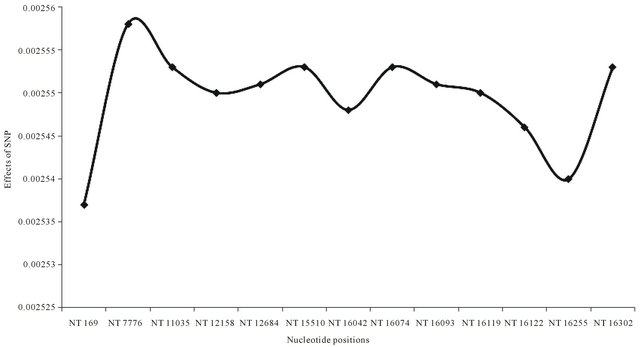
Figure 2. Average effects of 13 SNP on genetic distances among all analyzed B.T. taurus and indicus breeds. A total of 13 SNP were based on the sequence (AY526085) in GenBank with nucleotide positions at 169, 7776, 11,035, 12,158, 12,684, 15,510, 16,042, 16,074, 16,093, 16,119, 16,122, 16,255, and 16,302. Genetic distances were estimated with a DNAdist option (DNA distance matrix, Bio-edit version 7.0.1.).
Table 6. The number of polymorphic sites, nucleotide diversity, and a ratio of transition/transversion in genes and the whole mtDNA genome.

1ti/tv stands for a ratio of transition/transversion.
was 0.000858 that was placed in the middle of genetic diversity comparing with other breeds. The transition (T/C and A/G) and transversion (A/T, T/G, C G, and A/C) of nucleotides presented nucleotide diversities when performing a comparative analysis of sequences between populations. A ratio of ti/tv is the numbers of ti to the numbers of tv for a pair of sequences, and generally, A/C and T/G showed 3 times less observation in the animal genome [9]. The ratio of ti/tv is a parameter of some models used in phylogenetic estimations intended to reflect the fact that nucleotide substitutions are not all equally likely. As results, the ti/tv ratio showed 0.105 in KNC that was higher than that of all breeds except PIE (0.158) and GRK (0.133). The results may imply that KNC show very different aspects of genetic diversities compared with other breeds. The highest ratio of ti/tv showed PIE (0.158), and the lowest was in CHA and JBC (0.001) for the whole mtDNA region.
3.4. Phylogenetic Analysis
Phylogenetic analysis using various SNP located in whole mtDNA has been successfully performed to characterize genetic relationships of KNC from other cattle breeds. According to the results of genetic distances among cattle breeds (Figure 3), KNC revealed a relatively close genetic distance with JBC (0.0056), Angus (0.0105), and Holstein (0.0103) that was eventually not expected because the phenotypic characterization of KNC was clearly differed from these breeds if we do not consider the same haplogroup (T3) that contained these breeds. As expected, KNC showed quite far distances with other Bos Taurus breeds (AGE, LIM, MON, ROM, and CIN) having different haplogroups (T1, T2, Q, and R) as well as Bos Indicus breeds (NEL and ZWE).
4. DISCUSSION
In general, mtDNA has been increasingly used as genetic markers for identification and characterization of specified individuals as well as breeds because mtDNA is more vulnerable to more damage than nuclear DNA. The reason is that mtDNA lacks protective histones and has few inefficient repair mechanisms as well as a high rate of turnover that resulted in huge mutations [1]. Therefore, finding genetic markers have been focused on mtDNA, improving availabilities of abundant mutation
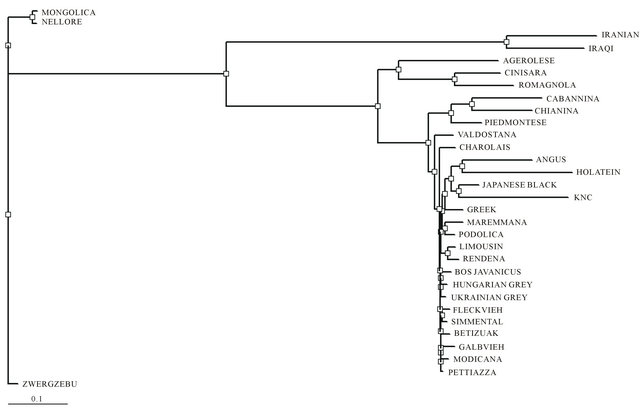
Figure 3. Phylogenetic analysis of mtDNA among 31 cattle breeds derived from each consensus sequences generated by sequence alignments for each breeds. Genetic distances among breeds were estimated with a DNAdist option (DNA distance matrix, Bio-edit version 7.0.1.).
sites to perform population studies and identifying individuals as well as breeds. Before applying SNP in genetic studies, RFLP (restriction fragment length polymorphism) analysis using restriction enzymes [10-13] was firstly reported as genetic variants by Laipis et al. [14]. After development of sequencing technology, SNP are the most major markers to differentiate individual characterizations. Informative SNP as the most important and the easiest method to identify individual differences in genome studies will be useful. The successfully identified mitochondria, which were driven from different sire lines, will be stored in a cell bank as a reference of genetic resources and may strongly support identification of animals in the future analysis of mtDNA regarding phylogenetic studies.
As the results of sequence analysis of mtDNA, 4 highly polymorphic nucleotide positions and 3 SNP magnifying genetic distances in this study firstly reported here as a good source of genetic variants in mtDNA. In addition, as shown in Table 3, sequence analysis to characterize KNC individuals into major groups was successfully performed. The identified groups will be served as standard to characterize KNC individuals for further studies regarding phylogenetic analysis.
Several studies focused on genetic variants in the Dloop region to analyze phylogenetic relationships among cattle breeds [1,5] due to high genetic variants, and the present study also determined 35.25% of variation in the region. In addition, not many attempts have been reported for the phylogenetic analysis using the whole mtDNA sequences because other than the D-loop region was believed as no sufficient genetic variations that may not be effectively worked in genetic identification. However, except the D-loop region, there are still many SNP in genes of mtDNA comparing with genes in genomic regions. Therefore, it may be a useful strategy to estimate genetic diversity using SNP in the whole mtDNA. In addition, a study used a complete cytochrome B gene in mtDNA to define genetic diversities for indigenous animals due to containing relatively high variations compared with other genes [7]. The idea was also fully agreed with our results that showed relatively high variations in CYTB. On the other hand, approximately 2 times higher variations in ND5 (average 7.4 SNP) than CYTB were observed. Therefore, the results I this study recommended to use the whole mtDNA sequences to estimate genetic distances and relationships. In addition, the human study stated that focusing on the D-loop region that is the non-coding and fast-evolving control region may be inadequate [15].
As defined, the overall nucleotide diversity within KNC revealed quite low with some individuals, meaning that KNC may be in the high levels of inbreeding. Because KNC has been maintained without many sire lines for a long period time, the inbreeding statute of KNC in the national level may be higher than expected. In addition, the average pair-wise sequence divergence of mtDNA among KNC (varying from 0.0005 to 0.0020) is lower than that of mtDNA for any breed of Bos Taurus and Bos Indicus. According to the reports for native populations such as African and Indian cattle breeds, sequence divergences ranged from 0.0011 to 0.0092 [16]. Our results clearly showed that similarity levels of KNC were in a considerable situation showing very low nucleotide diversity (0.0005 to 0.0007) for a few animals. Furthermore, finding a significantly high sequence identity between KNC individuals may support the above statement. However, the data resulted from this study do not indicate the exact inbreeding levels of KNC, and a few KNC sire lines might have contributed genes through parental lineages but current data are not fully supporting this speculation. In addition, this is a possibility of implications that quite favorite breeding systems have been maintained to characterize and manage KNC as a representative of a unique cattle breeding.
The phylogenetic analysis of the entire mtDNA revealed that a few KNC fell into a distinct mitochondrial lineage without significant genetic diversity from all cattle breeds. The interesting finding was that KNC and JBC revealed relatively close genetic distances that may be explained by geographical locations between two breeds. This could be a reasonable explanation that a quite high sharing rate of haplotypes between breeds was determined, but it was too limited to be concluded with these representative animals examined in our study. However, a similar result has been proposed that most modern cattle breeds are believed to be originated from the extinct aurochs, Bos Primigenius, and the native cattle breeds of North Eastern Asia (Mongolia, North China, Korea, and JBC) have been locally domesticated from an eastern Eurasian lineage of Bos Primigenius [2] that connected to KNC and JBC in terms of geological migrations. Overall, the definition of the haplotypes in this analysis may be a clue to define KNC to minimize inbreeding levels in future mating systems, and KNC can be well defined for preserving purposes with these haplotypes as well as SNP.
Mitochondria, which play essential roles in apoptotic cell death, cell survival, mammalian development, neuronal development and function, intracellular signaling, and longevity regulation, are complex organelles and major places of ATP production. To understand these genetic functions of mtDNA that may associate with quantitative traits in cattle, as many as genetic variants should be analyzed. It is, therefore, required that the genetic information of the whole mtDNA should be filed to characterize genetic resources of native animals that have not been fully investigated due to no popularity of public concerns focused on the commercial productivities. This is the reason why this study determined complete mtDNA sequences using 40 KNC from different breeding lines and analyzed sequences in conjunction with the previously published full sequences of Bos Taurus and Bos Indicus breeds.
5. ACKNOWLEDGEMENTS
This work was supported by National Institute of Animal Science, and this experiment was a contributing internal project “Identification of SNPs by differentially expressed proteins in growing stages”.
![]()
![]()
REFERENCES
- Pfeiffer, I., Voelkel, I. and Brenig, B. (2005) Phylogenetics of the European Dahomey miniature cattle based on mitochondrial D-loop region DNA sequence. Animal Genetics, 36, 160-190. doi:10.1111/j.1365-2052.2005.01245.x
- Mannen, H., Kohno, M., Nagata, Y., Tsuji, S., Bradley, D. G., Yeo, J.S., Nyamsamb, D., Zagdsuren, Y.M., Nomura, K. and Amanof, T. (2004) Independent mitochondrial origin historical genetic differentiation in North Eastern Asian cattle. Molecular Phylogenetics and Evolution, 32, 539-544.
- Anderson, S., Bankier, A.T., Barrell, B.G., De Bruijn, M.H., Coulson, A.R., Drouin, J., Eperon, I.C., Nierlich, D.P., Roe, B.A., Sanger, F., Schreier, P.H., Smith, A.J., Staden, R. and Young, I.G. (1981) Sequence and organization of the human mitochondrial genome. Nature, 290, 457-465. doi:10.1038/290457a0
- Brown, W.M. (1980) Polymorphism in mitochondrial DNA of human as revealed by restriction endonuclease analysis. Proceedings of the National Academy of Sciences, 77, 3605-3609. doi:10.1073/pnas.77.6.3605
- Christopher, S.T., David, E.M., Jillian, F.B., David, A.M., Ronan, T.L., Patrick, C., Andrew, T.C., Bryan, C.S. and Daniel, G.B. (2001) Genetic evidence for Near-Eastern origins of European cattle. Nature, 410, 1088-1091. doi:10.1038/35074088
- Hassanin, A. and Douzery, E.J. (1999) The tribal radiation of the family Bovidae Artiodactyla and the evolution of the mitochondrial cytochrome b gene. Molecular Phylogenetics and Evolution, 13, 227-243. doi:10.1006/mpev.1999.0619
- Cai, X., Chen, H., Lei, C., Wang, S., Xue, K. and Zhang, B. (2007) mtDNA diversity and genetic lineages of eighteen cattle breeds from Bos taurus and Bos indicus in China. Genetica, 131, 175-183. doi:10.1007/s10709-006-9129-y
- Graham, J.M. (2001) Unit 3.3. isolation of mitochondria from tissues and cells by differential centrifugation. Current Protocols Cell Biology, Chapter 3. doi:10.1002/0471143030.cb0303s04
- Keller, I., Bensasson, D. and Nichols, R.A. (2007) Transition-transversion bias is not universal, a counter example from grasshopper pseudogenes. PLoS Genetics, 3, e22. doi:10.1371/journal.pgen.0030022
- Laipis, P.J., Wilcox, C.J. and Hauswirth, W.W. (1982) Nucleotide sequence variation in mitochondrial deoxyribonucleic acid from bovine liver. Journal of Dairy Science, 65, 1655-1662.
- Watanabe, T., Masangkay, T.S., Wakana, S., Saitou, N. and Tomita, T. (1989) Mitochondrial DNA polymorphism in native Philippine cattle based on restriction endonuclease cleavage patterns. Biochemical Genetics, 27, 431-438. doi:10.1007/BF02399672
- Bhat, P.P., Mishar, B.P. and Bhat, P.N. (1990) Polymorphism of mitochondrial DNA in cattle and buffaloes. Biochemical Genetics, 28, 311-318.
- Amano, T., Miyakoshi, Y., Tokada, T., Kikkawa, T. and Suzuki, M. (1994) Genetic variants of ribosomal DNA and mitochondrial DNA between swamp and river buffaloes. Animal Genetics, 25, 29-36.
- Laipis, P.J., Hauswirth, W.W., O’Brien, T.W. and Michaels G.S. (1979) A physical map of bovine mitochondrial DNA from a single animal. Biochimica et Biophysica Acta, 565, 22-32. doi:10.1016/0005-2787(79)90080-7
- Torroni, A., Achilli, A., Macaulay, V., Richards, M. and Bandelt, H.J. (2006) Harvesting the fruit of the human mtDNA tree. Trends in Genetics, 22, 339-345. doi:10.1016/j.tig.2006.04.001
- Loftus, R.T., MacHugh, D.E., Ngere, L.O., Balain, D.S., Badi, A.M., Bradley, D.G. and Cunningham, E.P. (1994) Mitochondrial genetic variation in European, African and Indian cattle populations. Animal Genetics, 25, 265-271. doi:10.1111/j.1365-2052.1994.tb00203.x