Journal of Analytical Sciences, Methods and Instrumentation
Vol.3 No.3A(2013), Article ID:37291,7 pages DOI:10.4236/jasmi.2013.33A003
An Ion-Pair HPLC Method for Simultaneous Determination of Exogenous Phosphocreatine and Its Metabolite Creatine and Related ATP in Rabbit Plasma and RBC: Application to a Pharmacokinetic Study
![]()
Department of Pharmacology, College of Pharmacy, Dalian Medical University, Dalian, China.
Email: *hgzhx2236@sina.com
Copyright © 2013 Li Lv et al. This is an open access article distributed under the Creative Commons Attribution License, which permits unrestricted use, distribution, and reproduction in any medium, provided the original work is properly cited.
Received July 12th, 2013; revised August 15th, 2013; accepted August 22nd, 2013
Keywords: Ion-Pair HPLC; Phosphocreatine; Creatine; ATP; Plasma; RBC; Pharmacokinetics; Rabbit
ABSTRACT
A specific, precise and accurate ion-pair HPLC-UV method has been developed and validated for simultaneous determination of phosphocreatine (PCr), and its metabolite creatine (Cr) as well as related ATP in plasma and red blood cell (RBC) of rabbits. After addition of TMP as IS, the samples were deproteinized with 6% PCA. The analytes were separated on a Kromasil C18 column using a tertiary gradient mobile phase composed of buffer A (0.2% KH2PO4 + 0.08% tetrabutyl ammonium hydrogen sulphate, pH 3.0), buffer B (buffer A adjusted to pH 7.5 with 1 mol/L NaOH) and MeOH. Detection wavelengths were set at 210 nm for PCr and Cr and 260 nm for ATP and TMP. Some blank samples were initially run for baseline subtraction. The linear detection responses were obtained for PCr concentration over a range of 10 - 7500 mg/ml (plasma) and 5 - 2500 mg/ml (RBC) and for both Cr and ATP concentrations of 10 - 1500 mg/ml (plasma) and 5 - 750 mg/ml (RBC) (r > 0.99). The QC samples of 3 analytes showed intra-day and inter-day precisions (RSD) of <10%, accuracy of 97% - 107%. The method was successfully used to simultaneously determine plasma and RBC concentrations of the 3 analytes and to study pharmacokinetics after iv administration of PCr to rabbits.
1. Introduction
Phosphocreatine (PCr), namely creatine phosphate, is one of important high-energy phosphates in the body and plays a vital role in energy metabolism of body by acting as a storage form of energy used for re-synthesis of ATP. Exogenous PCr has long been developed as a cardioprotective drug and extensively used for adjunct therapy of heart failure, myocardial infarction, and as an additive ingredient in cardioplegia solution during heart surgical operation [1-4], and thereby recorded in The Extra Pharmacopoeia [5].
Although there are numerous preclinical and clinical studies on pharmacodynamics of exogenous PCr [2-4, 6-10], the considerable shortages of studies on pharmacokinetics are evident. In only 3 reports available currently on plasma pharmacokinetics of PCr [3,6,11], nonspecific assays without chromatographic separation, including spectro-photometry, biolumilescence, were used to determine plasma PCr concentration, so that the reliability of the obtained pharmacokinetic results is limited. A specific bio-analytical method has become prerequisite in order to elucidate pharmacokinetic behaviors of PCr; but, to date, there is no report available in literature on pharmacokinetics of PCr investigated by means of specific HPLC assay. Besides, recent studies have shown that creatine, a metabolic product of PCr in body, has extensive physiological and pharmacological activities [12-14]. However, the kinetic process of bio-transformation from PCr to creatine has not been investigated. In addition, it was previously found in our lab that after iv administration of PCr to rats the hemorheology was significantly improved, theoretically, this was related to elevated ATP level in RBC. In view of these situations, this study was designed to develop a specific ion-pair HPLC-UV assay for simultaneous determination of PCr, its metabolite Cr and PCr-related ATP in plasma and RBC of rabbits, so as to study the pharmacokinetics of exogenous PCr and its metabolic disposition as well as its influence on ATP level.
2. Materials and Methods
2.1. Chemicals and Reagents
Test drug PCr (>97% purity), as creatine phosphate disodium tetrahydrate formulated as sterile powder for injection, was kindly provided by Harbin Bolai Pharmaceutical Co., Ltd (Harbin, China). Reference standards of PCr, Cr and ATP (>99% purity, respectively) were purchased from Merck (Germany and USA), trimethoprim (TMP) as an internal standard (IS) (99% purity) was obtained from National Institute for the Control of Pharmaceutical and Biological Products (Beijing, China). Other chemicals including tetrabutyl ammonium hydrogen sulphate (TBA) used as ion-pair reagent (JK Co., Ltd, USA), KH2PO4, NaOH, Perchloric acid (PCA) and K2CO3 were all of analytical grade. MeOH (Tedia, USA) was of HPLC grade. The bidistilled water was used for preparation of mobile phase and solutions.
2.2. Chromatographic Conditions
The liquid chromatographic system consisted of an Agilent 1100 HPLC Chromatograph equipped with a quaternary pump, an on-line degasser, a UV-detector and a refrigerated autosampler. The system control and data processing were performed on a Chemstation 32 software (Agilent, USA). The chromatographic separation was achieved on a Kromasil C18 analytical column (250 ´ 4.6 mm, 5 μm) (Ilite, Dalian, China) protected by a precolumn (20 ´ 4.6 mm, 10 μm) using a gradient mobile phase, composed of buffer A (0.2% KH2PO4 + 0.08% TBA, pH 3.0), buffer B (buffer A adjusted to pH 7.5 with 1 mol/L NaOH) and MeOH, coupled with a changed detection wavelength of 210 nm for PCr and Cr and 260 nm for ATP and TMP as well as a changed flow rate from 1.0 to 1.3 ml/min, which was detailed in Table 1.
2.3. Preparation of Standards
The separate stock solutions of PCr (75 mg/ml), Cr (15 mg/ml) and ATP (15 mg/ml) were prepared in water and then serially diluted to obtain respective serial working standard solutions of 100 - 75000 µg/ml for PCr, 100 - 15000 μg/ml for both Cr and ATP. The stock solution (5 mg/ml) of TMP as IS was prepared in MeOH.
The above stock solutions were all stored at −20˚C, the serial working standard solutions were freshly prepared from respective stock solutions and stored at 4˚C.
2.4. Collection of Plasma and RBC Samples
A 400 µl aliquot of rabbit blood sample was collected and centrifuged at 4˚C (3000 r/min) for 10 min, the plasma at upper layer was withdrawn out and stored immediately at −20˚C for plasma pharmacokinetic study. The remainder at lower layer containing RBC was washed with 500 µl of physiological saline and centrifuged at 4˚C (3000 r/min) for 10 min, the same procedure was repeated twice to remove co-existing plasma and other substances, the washed RBC at lower layer was further treated with addition of equal volume of distilled water to yield RBC sample.
2.5. Pre-Treatment of Samples
An aliquot of 100 μl of plasma or RBC sample was transferred into an Eppendoff tube containing 10 μl of TMP solution and 30 μl of water, the resultant mixture was deproteinized with 360 μl or 100 μl of pre-cooled 6% PCA. After centrifuging (10000 r/min ´ 2 min) at 4˚C to remove precipitate a 300-μl or 150-μl aliquot of the supernatant was transferred into another tube and immediately neutralized with pre-cooled 2 mol/L K2CO3 to pH 7.0. A volume of 20 μl of neutralized supernatant following centrifugation was injected into chromatograph for HPLC analysis. The above procedures were all conducted in ice-bath and all utilized solutions were pre-
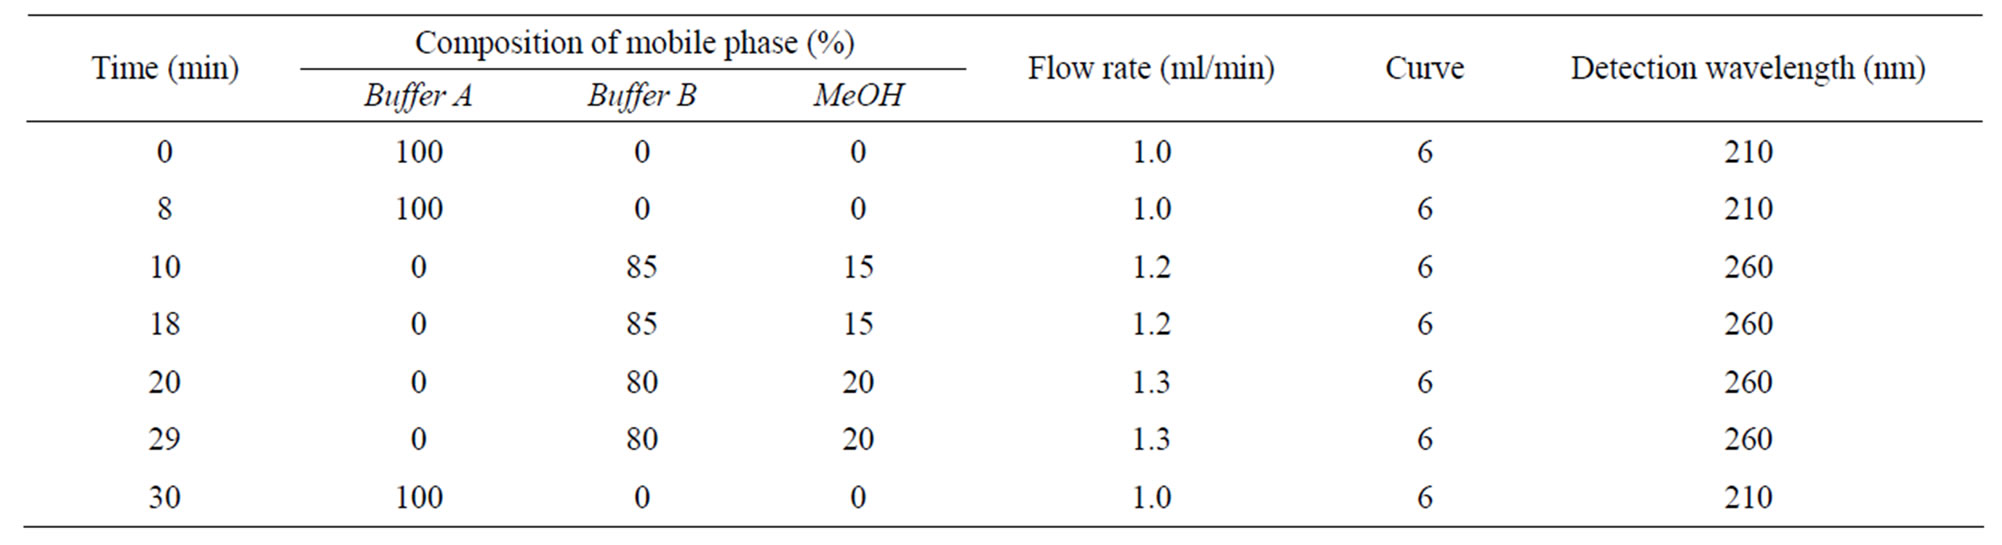
Table 1. The detailed gradient mobile phase and detection.
cooled in ice bath.
2.6. Preparation of Calibration Curves
Seven portions of 100 μl blank plasma or blank RBC samples were spiked with 10 μl each of appropriate standard working solutions of the above 3 analytes and 10 μl of stock solution of IS, respectively, and vortexmixed well to make plasma standard samples containing 7500, 2500, 500, 100, 50, 20, 10 μg/ml of PCr, and 1500, 750, 300, 100, 50, 20, 10 μg/ml of each of Cr and ATP, respectively, or RBC standard samples containing 2500, 500, 100, 50, 20, 10, 5 μg/ml of PCr, and 750, 300, 100, 50, 20, 10, 5 μg/ml of each of Cr and ATP, respectively. The above plasma or RBC standard samples were further treated with 6% PCA followed by neutralization as described under the section Pre-treatment of samples, the chromatogram and peak area were recorded. The above procedures were repeated 3 times. Meanwhile a blank plasma or RBC sample was run for baseline subtraction. Then, the peak areas of exogenous PCr, Cr and PCr-related ATP were calculated as peak area of plasma or RBC standard samples minus respective peak area of blank samples and were used to construct the calibration curves of the 3 analytes of exogenous origin based on peak area internal standard method. The weighed least square linear regression was used for calibration curve fitting with 1/C2 as weighing factor.
2.7. Validation of Methodology
This HPLC assay was validated using quality control (QC) samples containing PCr + Cr + ATP, which were prepared as described under section preparation of calibration curve, at high (2500 + 750 + 750 μg/ml), middle (100 + 100 + 100 μg/ml) and low (20 + 20 + 20 μg/ml) concentrations for 6 repeated analysis, separately.
The validation was performed by determining the intra-day and inter-day precisions expressed as relative standard deviation (R, S, D) for 6 determinations on a single assay day and 6 consecutive assay days, assay accuracy assessed as a percent of measured concentrations based on the regression equation of the calibration curve vs the spiked concentration, and recovery assessed by direct comparison of respective peak area obtained from PCA-extracted QC samples with those from unextracted standard solutions having concentration identical to the QC samples.
The stability of 3 analytes in plasma and RBC was evaluated by analyzing replicates (n = 3) of the QC samples at high and low levels as described above, which were exposed to different storage conditions (time and temperature), including −20˚C for up to 1 month and room temperature for up to 8 h for QC samples, 4˚C in auto-sampler for up to 24 h for PCA-extracted QC samples and −20˚C for up to 2 months for standard stock solutions. The results were compared with those obtained from freshly prepared samples. The analytes were considered to be stable in biological matrix when 90% - 110% of the initial concentrations were found.
2.8. Application of the Methodology
The present method was used to measure concentrationtime profiles of PCr, its metabolite Cr and PCr-related ATP in plasma and RBC after intravenous administration of PCr at a dose of 500 mg/kg to 5 male rabbits. The blood samples were taken prior to dosage and at 2, 4, 6, 10, 15, 20, 30, 40, 60, 90, 120, 150 min post dose and then the plasma and RBC samples were prepared in the same way as described under section collection of plasma and RBC samples. Pharmacokinetic parameters were estimated by compartment and non-compartment analysis using 3p97 software package (version 1.1 PK software, China Mathematical Pharmacological Society).
3. Results and Discussion
3.1. Method Development
3.1.1. Chromatography Conditions
In spite of the reports on ion-pair HPLC-UV assay for determination of myocardial PCr, Cr, ATP and other adenine nucleotides having been found in the literature [15,16], the simultaneous determination of the above 3 compounds in the plasma and RBC is not available in literature to date. The establishment of chromatographic conditions is confronted with many difficulties: 1) PCr and Cr are short of chromophoric group, end absorption wavelength 210 nm has to be used for detection, this must increase the matrix interferences; 2) PCr and Cr are polar compounds and therefore have short retention time (tr) compared with ATP having a long tr of >2 h on the reversed phase C18 column; 3) The pH of mobile phase has great influence on chromatographic behaviors of these compounds, low pH favors detection of PCr and Cr but not ATP, which was eluted over 3 h when pH 3.0 mobile phase was used, however, high pH favors ATP but not PCr and Cr, both of which showed serious peak tailing and extended tr, leading to a compromised peak resolution when pH 7.5 mobile phase was used. In view of the above, the isocratic mobile phase is not practicable, the complicated gradient mobile phase involving changes in composition, pH, wavelength and flow rate has to be used. As shown in Table 1, tertiary mobile phase was utilized where buffer A with pH 3.0 was initially run from 0 - 8.0 min for PCr and Cr, thereafter changed to buffer B with pH 7.5 for ATP and IS, meanwhile detection wavelength changed from 210 nm to 260 nm, correspondingly. In order to shorten tr of IS and ATP, MeOH as organic modifier coupled with increased flow rate from 1.0 to 1.3 ml/min was used after Cr and PCr were eluted.
3.1.2. Choice of Internal Standard
For reliable quantification IS selection is very important, especially in this study, majority of studies on detection of myocardial high energy phosphates employed external standard method [15] except a study by Dr A. Ally, et al. who used AP4 as IS [16]. However, AP4 is not only expensive but also is eluted after ATP and has very long tr, leading to an unacceptable long single run time. We chosen TMP as IS from many compounds due to not only its easy to be purchased and being cheap but also its desired tr between PCr and ATP.
3.1.3. Sample Preparation
The analytes in this study have high polarity and are difficult to be extracted with organic solvents, accordingly, PCA-deproteinization method was used to prepare plasma and RBC samples, but PCr is unstable in acid, thus all procedures must be performed under low temperature at ice-salt bath. Also, the acid-extract must be neutralized immediately to pH 7.0. The pre-treatment results in a dilution effect, which in combination with the low molar extinction co-efficiency leads to a higher μg-level of limit of quantification (LOQ), fortunately, PCr is very low in toxicity and large dose has been clinically used in human, thus such a μg-level LOQ also suffices requirements for pharmacokinetic study.
3.1.4. Quantification of Exogenous PCr, Cr and PCr-Related ATP
The 3 analytes are all endogenous physiological substances, whereas the purpose of this study is to determine exogenous PCr, Cr and PCr-related ATP. At present time, pharmacokinetic study of exogenous physiological substances is still a difficult subject, the problem lies in how to differentiate them from corresponding endogenous substances. The best way is isotope-label of exogenous substances, however, this is not desired. A simple and easy to be performed method called baseline subtraction is currently extensively used [17,18]. In this study, a PCr, Cr and ATP-free blank plasma and RBC cannot be found, therefore the baseline subtraction method is used to construct calibration curve and to study pharmacokinetics of exogenous PCr and its metabolic disposition.
3.2. Specificity
Figure 1 showed representative HPLC profiles of a blank rabbit plasma sample and a blank plasma sample spiked with standard solution and IS and a plasma sample collected from a rabbit at 20 min after a single 500 mg/kg iv dose of PCr, indicating that no interference from endogenous substances at tr of PCr, Cr, TMP and ATP, i.e., 5.8, 3.4, 17.8 and 27.2 min, respectively. The single run time was 30 min (The HPLC chromatograms for RBC samples were similar to those for plasma, and omitted).
3.3. Linearity and Limit of Quantification
Table 2 presented related parameters of calibration curves, constructed by plotting peak area ratio of each analyte to IS vs analyte concentration, good linearity for the 3 analytes over the low and high concentration range were observed with r2 being >0.995 or >0.999 and the LOQ of 10 μg/ml plasma and 5 μg/ml RBC for the 3 analytes, respectively.
3.4. Precision, Accuracy and Extraction Recovery
Analytical precision and accuracy data were shown in Tables 3-5. The intraand inter-day precisions at low to high concentrations were better than 10% for the 3 analytes in plasma, and 7% in RBC. The intraand inter-day accuracies were between 97% - 106% for the 3 analytes in plasma and between 97% - 107% in RBC. The extraction recovery in both plasma and RBC were all between 90% - 100% for 3 analytes and IS.
3.5. Stability of Plasma and RBC Samples
It was shown that the QC samples of plasma and RBC stored at −20˚C were stable for at least 1 month, but unstable at room temperature, as reflected by only 87% of initial concentration being found at 2 h-storage for PCr and <90% at 4 h for ATP and Cr. The PCA-extracted plasma and RBC samples were stable for at least 24 h when stored in auto-sampler at 0 - 4˚C. The stock solutions of 3 standards were found to be stable at least 2 months during storage at −20˚C.
3.6. Assay Application
Figure 2 depicted the time courses of PCr and Cr in plasma and Cr and ATP in RBC of rabbits receiving a single iv dose of PCr 500 mg/kg. It could be seen that PCr disappeared from plasma in a bi-exponential fashion with a very short elimination half life (t1/2β 24.7 min), and the metabolite Cr was detected as early as 2 min after iv dosing PCr, and rapidly reached peak concentration at 20 min followed by a slow decay in concentration with a longer half life (t1/2 40.6 min). It was also evident that the PCr-related ATP was not detectable perhaps due to
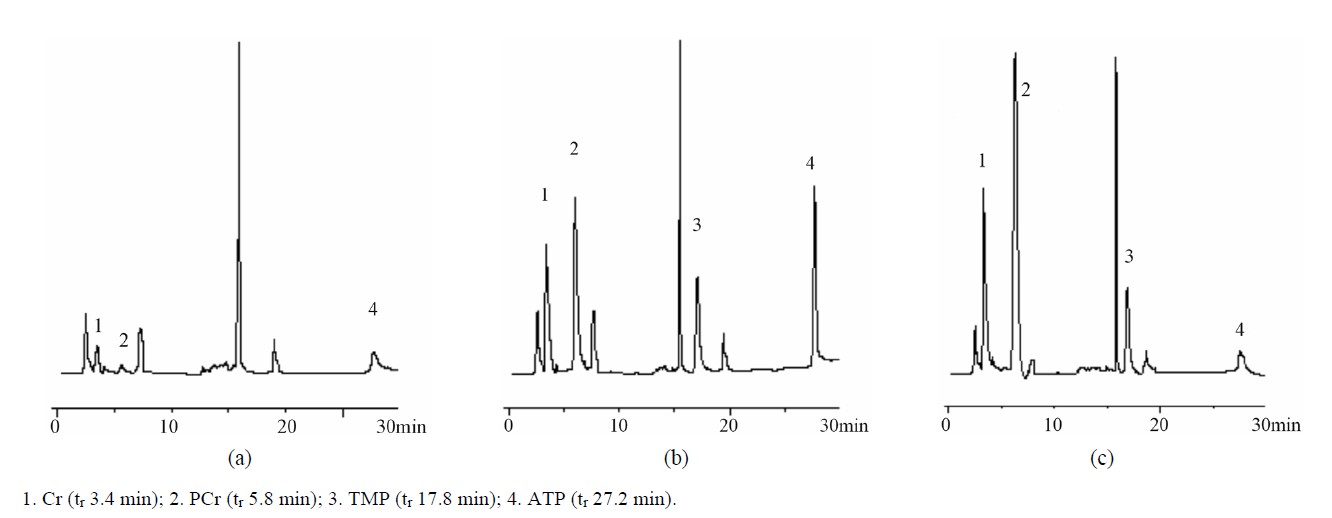
Figure 1. Representative chromatograms of rabbit blank plasma (a), a blank plasma sample spiked with standard solution and TMP (b) and a plasma sample collected from a rabbit at 20 min after a single 500 mg/kg iv dose of PCr and spiked with TMP (c).
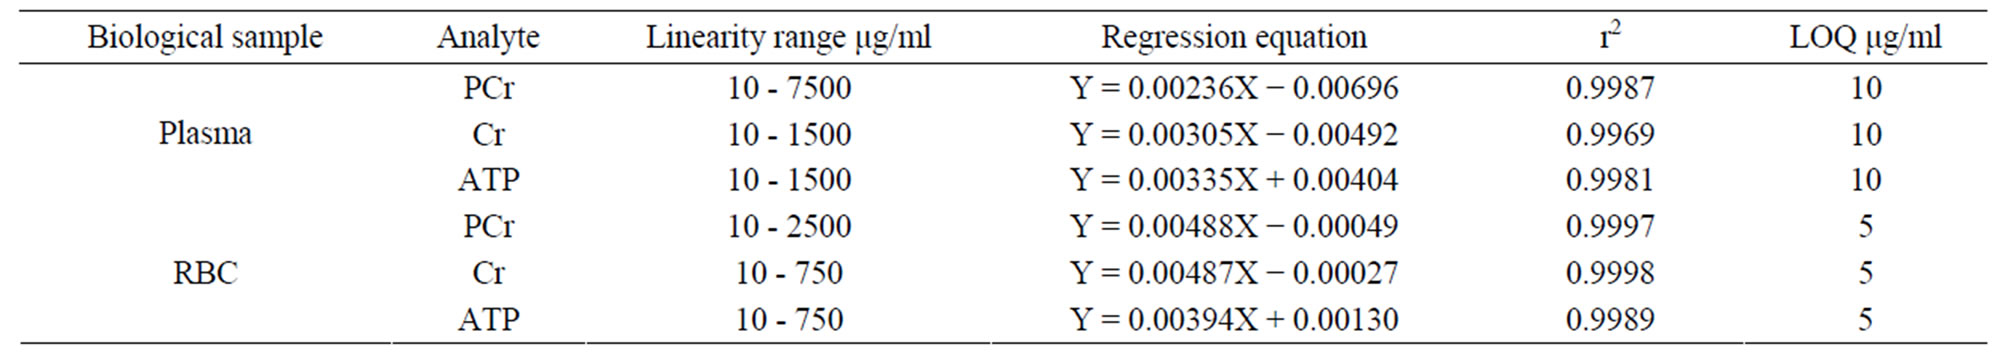
Table 2. Linearity, LOQ and regression equations of 3 analytes (n = 3).
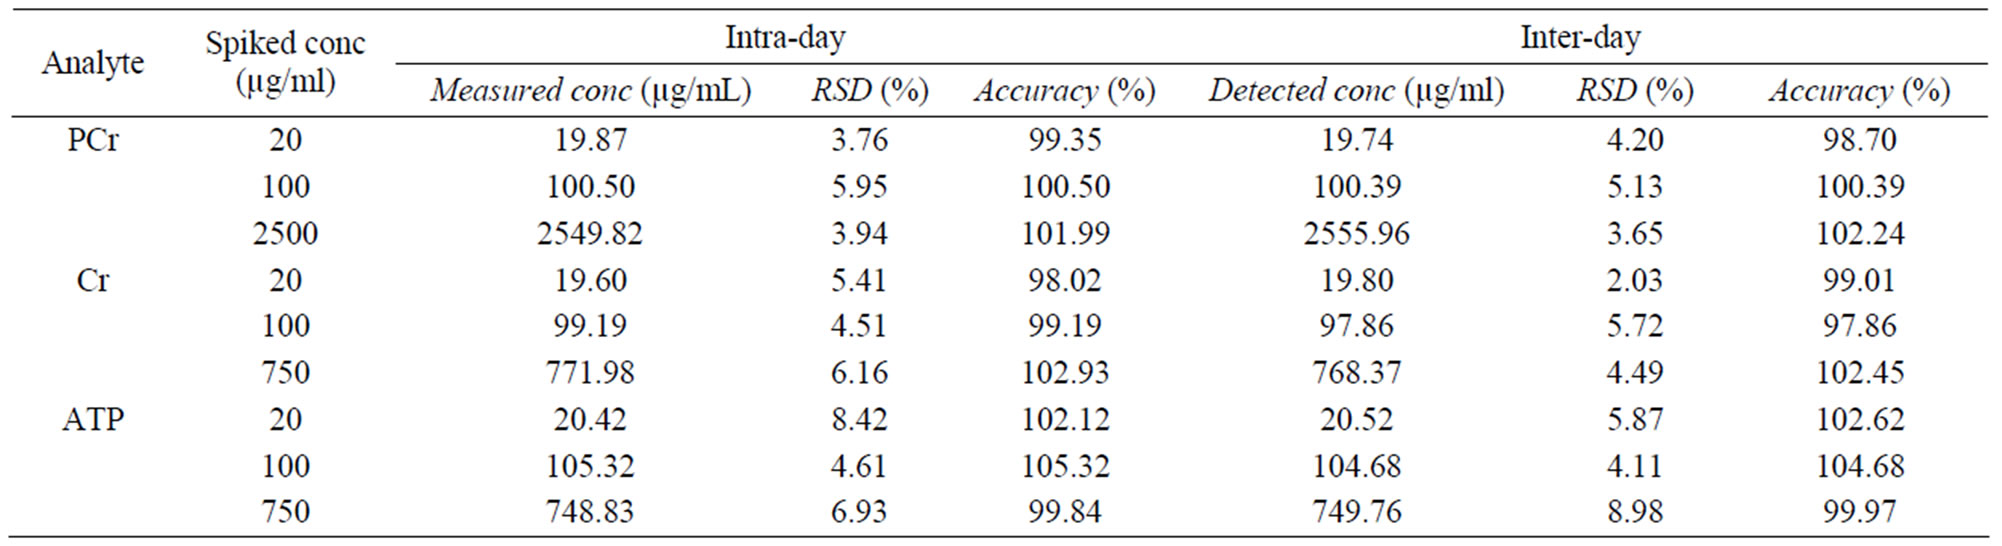
Table 3. The precision and accuracy of 3 analytes in plasma ( ± SD, n = 6).

Table 4. The precision and accuracy of 3 anlytes in RBC ( ± SD, n = 6).
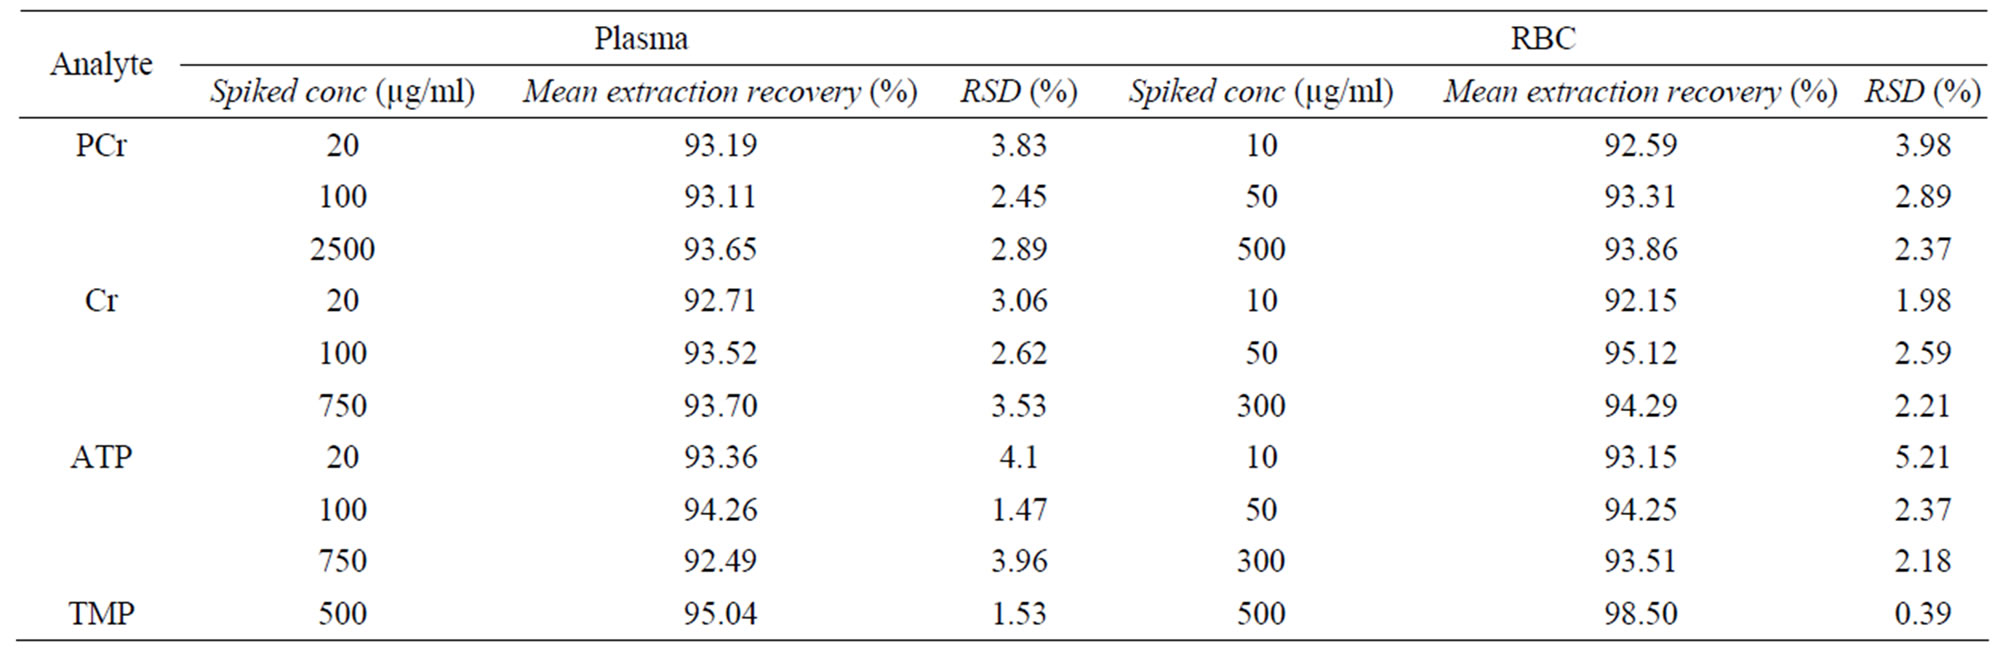
Table 5. The extraction recovery of 3 analytes in plasma and RBC.

Figure 2. Mean plasma and RBC concentration-time profiles after intravenous administration of 500 mg/kg of PCr to rabbits (n = 5).
plasma being not an energy-consuming tissue.
It was shown that in the RBC no exogenous PCr could be detected, opposed to that metabolite Cr and PCr-related ATP were detectable as early as 2 min after iv dosing PCr and had tmax of 120 min and 67 min as well as Cmax of 18 and 33.8 μg/ml and t1/2 of 70.1 and 49.1 min, respectively. This indicated that plasma PCr was difficult to transport into RBC due to its high polarity, however, iv administration of PCr resulted in a significantly increased Cr and ATP in RBC. This significant increase in ATP provides a supportive evidence for improved hemorrheology after iv administration of PCr in rabbits.
4. Conclusion
An ion-pair reversed phase HPLC-UV assay coupled with a gradient mobile phase and changed detection wavelength, flow rate and buffer pH was developed for simultaneous determination of exogenous PCr, metabolite Cr and PCr-related ATP in plasma and RBC, and validated to be specific, precise and accurate. From the results obtained from rabbits receiving a 500 mg/kg iv dose of PCr, this new method has been demonstrated to allow correct quantification of the above 3 analytes by means of internal standard method and baseline subtraction method and thus to be able completely to meet the requirements for studies of pharmacokinetics and metabolic disposition of exogenous PCr in rabbits.
5. Acknowledgements
Thanks Harbin Bolai Pharmaceutical Co., Ltd (Harbin, China) for kindly providing PCr.
REFERENCES
- P. Kôrge, M. L. Silber and P. D. Gollnick, “Effect of Creatine Phosphate on the Contractile Activity in Acutely Failing Rat Heart,” Cardiologia, Vol. 43, No. 12, 1998, pp. 1345-1354.
- V. A. Saks, I. V. Dzhaliashvili, E. A. Konorev, E. Strumia, “Molecular and Cellular Aspects of the Cardioprotective Mechanism of Phosphocreatine,” Biokhimiia, Vol. 57, No. 12, 1992, pp. 1763-1784.
- V. G. Sharov, N. I. Afonskaya, M. Y. Ruda, N. M. Cherpachenko, EYa Pozin, R. A. Markosyan, II Shepeleva, M. B. Samarenko and V. A. Saks, “Protection of Ischemic Myocardium by Exogenous Phosphocreatine (Neoton): Pharmacokinetics of Phosphocreatine, Reduction of Infarct Size, Stabilization of Sarcolemma of Ischemic Cardiomyocytes, and Antithrombotic Action,” Biochemical Medicine and Metabolic Biology, Vol. 35, No. 1, 1986, pp. 101-114. http://dx.doi.org/10.1016/0885-4505(86)90064-2
- E. Strumia, F. Pelliccia and G. D’Ambrosio, “Creatine Phosphate: Pharmacological and Clinical Perspectives,” Advances in Therapy, Vol. 29, No. 2, 2012, pp. 99-123. http://dx.doi.org/10.1007/s12325-011-0091-4
- W. Martindale, “Martindale: The Extra Pharmacopocia,” 31st Edition, The Royal Pharmaceutical Society, 1996.
- P. Kôrge, M. L. Silber and P. D. Gollnick, “Effect of Creatine Phosphate on the Contractile Activity in Acutely Failing Rat Heart,” Cardiologia, Vol. 43, No. 12, 1998, pp. 1345-1354.
- P. Mastroroberto, L. Di Tommaso and M. Chello, “Creatine Phosphate Protection of the Ischemic Myocardium during Cardiac Surgery,” Current Therapeutic Research, Vol. 51, No. 1, 1992, pp. 37-45.
- G. Prabhakar, L. Vona-Davis, D. Murray, P. Lakhani and G. Murray, “Phosphocreatine Restores High-Energy Phosphates in Ischemic Myocardium: Implication for OffPump Cardiacre Vascularization,” Journal of the American College of Surgeons, Vol. 197, No. 5, 2003, pp. 786- 791. http://dx.doi.org/10.1016/j.jamcollsurg.2003.05.001
- MYa Ruda, M. B. Samarenko, N. I. Afonskaya and V. A. Saks, “Redtion of Ventricular Arrhythmias by Phosphocreatine (Neoton) in Patients with Acute Myocardial Infarction,” American Heart Journal, Vol. 116, No. 2, 1988, pp. 393-397. http://dx.doi.org/10.1016/0002-8703(88)90611-4
- M. L. Semenovsky, V. I. Shumakov, V. G. Sharov, G. M. Mogilevsky, A. V. Asmolovsky, L. A. Makhotina and V. A. Saks, “Protection of Ischemic Myocardium by Exogenous Phosphocreatine. II. Clinical, Ultrastructural, and Biochemicalevaluations,” Journal of Thoracic and Cardiovascular Surgery, Vol. 94, No. 5, 1987, pp. 762-769.
- E. Lorenzi, G. Piacenza, E. Strumia and R. Borgoglio, “Pharmacokinetics of Phosphocreatine Following Intravenous Administration in Humans and Effect on Blood Levels of ATP,” Cardiologia, Vol. 32, No. 9, 1987, pp. 1031-1034.
- M. Balestrino, M. Lensman, M. Parodi, L. Perasso, R. Rebaudo, R. Melani, S. Polenov and A. Cupello, “Role of Creatine and Phosphocreatine in Neuronal Protection from Anoxic and Ischemic Damage,” Amino Acids, Vol. 23, No. 1-3, 2002, pp. 221-229. http://dx.doi.org/10.1007/s00726-001-0133-3
- G. J. Brewer and T. W. Wallimann, “Protective Effect of the Energy Precursor Creatine against Toxicity of Glutamate and Beta-Amyloid in Rat Hippocampal Neurons,” Journal of Neurochemistry, Vol. 74, No. 5, 2000, pp. 1968- 1978. http://dx.doi.org/10.1046/j.1471-4159.2000.0741968.x
- M. A. Tarnopolsky and M. F. Beal, “Potential for Creatine and Other Therapies Targeting Cellular Energy Dysfunction in Neurological Disorders,” Annals of Neurology, Vol. 49, No. 5, 2001, pp. 561-574. http://dx.doi.org/10.1002/ana.1028.abs
- T. Teerlink, M. Hennekes, J. Bussemaker and J. Groeneveld, “Simultanous Determination of Creatine Compoumds and Adenine Nucleotides in Myocardial Tissue by HighPerformance Liquid Chromatography,” Analytical Biochemistry, Vol. 214, No. 1, 1993, pp. 278-283. http://dx.doi.org/10.1006/abio.1993.1488
- A. Ally and G. Park, “Rapid Determination of Creatine, Phosphocreatine, Purine Bases and Nucleotides (ATP, ADP, AMP, GTP, GDP) Inheart Biopsies by GradientionPair Reversed-Phase Liquid,” Journal of Chromatography, Vol. 575, No. 1, 1992, pp. 19-27.
- A. M. Persky, M. Müller, H. Derendorf, M. Grant, G. A. Brazeau and G. Hochhaus, “Singleand Multiple-Dose Pharmacokinetics of Oral Creatine,” Journal of Clinical Pharmacology, Vol. 43, No. 1, 2003, pp. 29-37. http://dx.doi.org/10.1177/0091270002239703
- M. Levine, C. Conry-Cantilena, Y. Wang, R. W. Welch, P. W. Washko, K. R. Dhariwal, J. B. Park, A. Lazarev, J. F. Graumlich, J. King and L. R. Cantilena, “Vitamin C Pharmacokinetics in Healthy Volunteers: Evidence for a Recommended Dietary Allowance,” Proceedings of the National Academy of Sciences USA, Vol. 93, No. 8, 1996, pp. 3704-3709. http://dx.doi.org/10.1073/pnas.93.8.3704
NOTES
*Corresponding author.