 Engineering, 2013, 5, 251-267 http://dx.doi.org/10.4236/eng.2013.53036 Published Online March 2013 (http://www.scirp.org/journal/eng) A Talc-Based Cement-Poor Concrete for Sealing Boreholes in Rock Roland Pusch1*, Laurence Warr2, Georg Grathoff2, Alireza Pourbakhtiar1, Sven Knutsson1, Mohammed Hatem Mohammed1 1Luleå University of Technology, Luleå, Sweden 2Geography & Geological Department, Greifswald University, Greifswald, Germany Email: *drawrite.se@gmail.com Received December 20, 2012; revised January 29, 2013; accepted February 6, 2013 ABSTRACT Deep investigation boreholes in crystalline rock for site selection of repositories for high-level radioactive waste are proposed to be sealed by installing a series of dense concrete and clay plugs. These should prevent radionuclides from leaking canisters at depth to migrate to the biosphere through the holes. The concrete seals will be installed where the holes intersect water-bearing fracture zones to serve as stable and low-permeable supports for adjacent clay plugs. Low porosity and microstructural stability must be guaranteed for many thousands of years and ordinary Portland cement with organic superplastizer will not fulfill the requirements since the high pH will cause degradation of contacting clay and the organic additive can produce colloids with a capacity to carry radionuclides up to the biosphere. Very ce- ment-poor concrete (<8%) based on low-pH cement and with talc as plasticizer is an option but it matures more slowly, which requires that the construction of seals is made so that sufficient bearing capacity for carrying overlying clay seals is reached. Keywords: Clay; Concrete; Ductility; Strength; Superplasticizers; Talc 1. Introduction Deep boreholes made in conjunction with site investiga- tions for locating repositories for high-level radioactive waste (HLW) should be effectively sealed for up to a hundred thousand years [1]. For holes passing through low-permeable rock with fine fractures only, sealing with clay is suitable, whereas concrete seals are proposed for those parts of the holes that intersect permeable fracture zones [2], cf. Figures 1 and 2. The average number of clay and concrete seals in 500 to 1000 m long holes is on the order of 10 - 20. The concrete, which is cast down in the holes, does not have to be water-tight but serve as a filter for preventing particles from adjacent clay seals to migrate through it and further into the fracture zones where they can be dispersed and lost. Since the concrete seals require a certain time to mature and obtain suffi- cient bearing capacity for carrying the clay segments without yielding, the whole sealing campaign must be planned with respect both to the time-dependent increase in strength of the concrete and of the clay seals, which establish bonds to the rock that ultimately makes them carry their own weight. 2. Objective The seals consist of a series of clay segments containing highly compacted smectite-rich clay, and segments of concrete cast on top of them where the hole is intersected by a fracture zone. Casting of concrete with high density requires addition of superplasticizers, which are com- monly of organic type. Since they can release organic colloids with a potential to transport radionuclides up to the biosphere [3], attempts are made to find chemically compatible, inorganic additives and a candidate material, fine-grained talc, has been used in pilot testing of con- crete for use in boreholes. Ordinary Portland cement raises the pH of the concrete so much that it can degrade contacting clay seals by cation exchange and substitution reactions [4]. Low-pH cement can be a suitable binder and the present study included investigation of the prop- erties of talc-concretes with similar aggregate composi- tions, based on Portland and low-pH cement of type Merit 5000, respectively. 3. A New Concrete 3.1. Criteria In addition to placeability, acceptable performance of the *Corresponding author. C opyright © 2013 SciRes. ENG 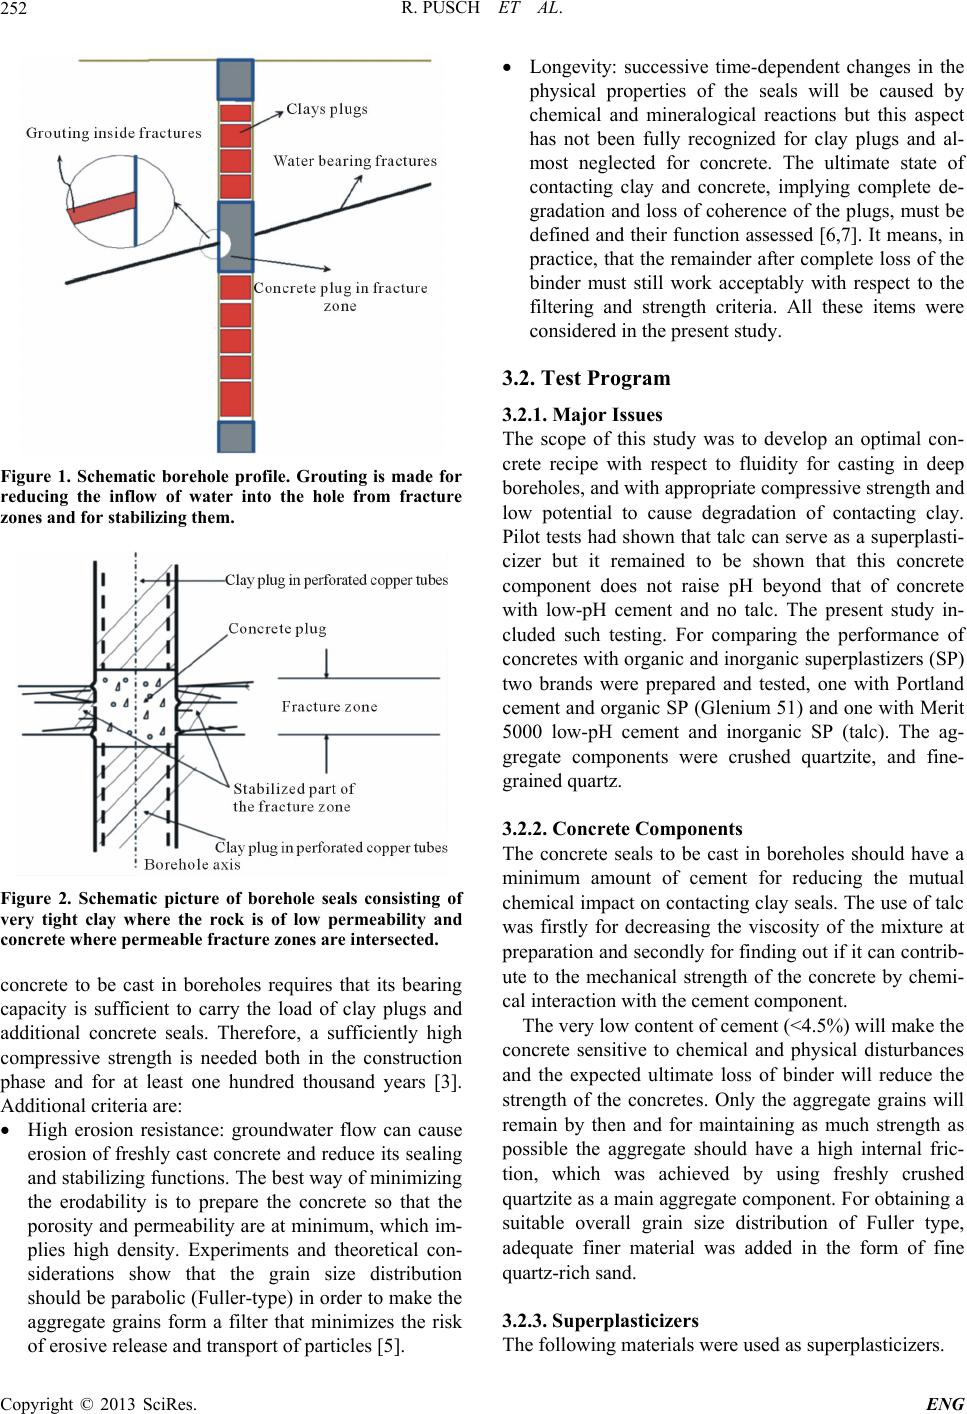 R. PUSCH ET AL. 252 Figure 1. Schematic borehole profile. Grouting is made for reducing the inflow of water into the hole from fracture zones and for stabilizing them. Figure 2. Schematic picture of borehole seals consisting of very tight clay where the rock is of low permeability and concrete where permeable fracture zones are intersected. concrete to be cast in boreholes requires that its bearing capacity is sufficient to carry the load of clay plugs and additional concrete seals. Therefore, a sufficiently high compressive strength is needed both in the construction phase and for at least one hundred thousand years [3]. Additional criteria are: High erosion resistance: groundwater flow can cause erosion of freshly cast concrete and reduce its sealing and stabilizing functions. The best way of minimizing the erodability is to prepare the concrete so that the porosity and permeability are at minimum, which im- plies high density. Experiments and theoretical con- siderations show that the grain size distribution should be parabolic (Fuller-type) in order to make the aggregate grains form a filter that minimizes the risk of erosive release and transport of particles [5]. Longevity: successive time-dependent changes in the physical properties of the seals will be caused by chemical and mineralogical reactions but this aspect has not been fully recognized for clay plugs and al- most neglected for concrete. The ultimate state of contacting clay and concrete, implying complete de- gradation and loss of coherence of the plugs, must be defined and their function assessed [6,7]. It means, in practice, that the remainder after complete loss of the binder must still work acceptably with respect to the filtering and strength criteria. All these items were considered in the present study. 3.2. Test Program 3.2.1. Major Issues The scope of this study was to develop an optimal con- crete recipe with respect to fluidity for casting in deep boreholes, and with appropriate compressive strength and low potential to cause degradation of contacting clay. Pilot tests had shown that talc can serve as a superplasti- cizer but it remained to be shown that this concrete component does not raise pH beyond that of concrete with low-pH cement and no talc. The present study in- cluded such testing. For comparing the performance of concretes with organic and inorganic superplastizers (SP) two brands were prepared and tested, one with Portland cement and organic SP (Glenium 51) and one with Merit 5000 low-pH cement and inorganic SP (talc). The ag- gregate components were crushed quartzite, and fine- grained quartz. 3.2.2. Concrete Components The concrete seals to be cast in boreholes should have a minimum amount of cement for reducing the mutual chemical impact on contacting clay seals. The use of talc was firstly for decreasing the viscosity of the mixture at preparation and secondly for finding out if it can contrib- ute to the mechanical strength of the concrete by chemi- cal interaction with the cement component. The very low content of cement (<4.5%) will make the concrete sensitive to chemical and physical disturbances and the expected ultimate loss of binder will reduce the strength of the concretes. Only the aggregate grains will remain by then and for maintaining as much strength as possible the aggregate should have a high internal fric- tion, which was achieved by using freshly crushed quartzite as a main aggregate component. For obtaining a suitable overall grain size distribution of Fuller type, adequate finer material was added in the form of fine quartz-rich sand. 3.2.3. Superplasticizers The following materials were used as superplasticizers. Copyright © 2013 SciRes. ENG  R. PUSCH ET AL. Copyright © 2013 SciRes. ENG 253 3.2.5. Preparation of Test Samples Glenium: Glenium 51, a commonly used organic sub- stance manufactured by BASF Chemical Co, UK. Three concretes mixtures, one with Portland cement and two with low-pH Merit 5000 cement, were prepared by using a laboratory mixer. Talc: very fine white mineral powder with the che- mical formula 3MgO·4SiO2·H2O. It is chemically stable in ordinary groundwater and has no impact on the environment. It is hydrophobic and low-viscous and does not form gels. The manufacturer of the ma- terial was VWR International Company, UK. The grain size distribution is shown in Figure 3. Intense agitation was used for reaching a high degree of homogeneity. The semi-fluid concrete mixtures were poured in plastic tubes of 10 cm length and 5 cm diame- ter and slightly vibrated. The tubes, which had been pa- per-lined for providing the maturing samples with tap water, were stored under water in an aquarium. 3.2.4. Aggregate The recipes for the Glenium and talc concretes using Portland cement are given in Tables 1 and 2 and for the concrete using low-pH Merit 5000 cement as described by Table 3. The amount of water was selected so as to make them equally fluid for casting. The aggregate, delivered by Forshammar AB, Sweden, consisted of crushed and ground quartzite to which very fine milled rock flour was added. This fraction, which contained 75.6% quartz and 14% Na/Ca feldspars, has a specific density of 2600 kg/m3. The complete granu- lometry of the aggregate material is shown in Figure 4. One notices that for Portland cement the highest den- sity was obtained when the amount of cement was very Figure 3. Grain size distribution of talc powder used in the study. Weight percent smaller than the respective size is given on the vertical axis. Figure 4. The grain size distribution of the aggregate material consisting of 70% “coarse” and 30% “fine”, quartz-dominated particles. 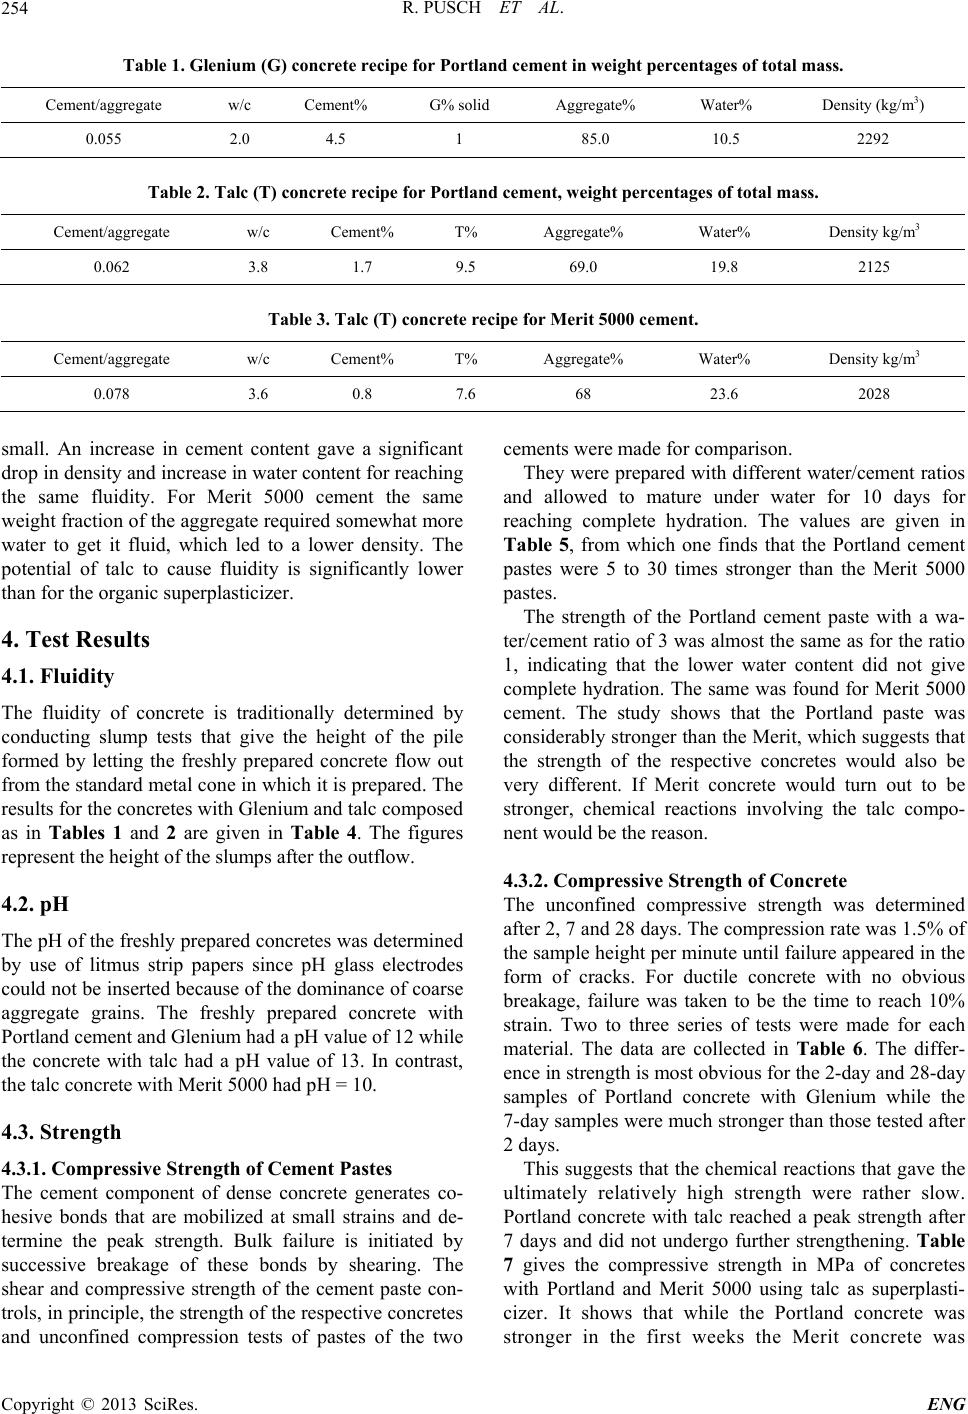 R. PUSCH ET AL. 254 Table 1. Glenium (G) concrete recipe for Portland cement in weight percentages of total mass. Cement/aggregate w/c Cement% G% solid Aggregate% Water% Density (kg/m3) 0.055 2.0 4.5 1 85.0 10.5 2292 Table 2. Talc (T) concrete recipe for Portland cement, weight percentages of total mass. Cement/aggregate w/c Cement% T% Aggregate% Water% Density kg/m3 0.062 3.8 1.7 9.5 69.0 19.8 2125 Table 3. Talc (T) concrete recipe for Merit 5000 cement. Cement/aggregate w/c Cement% T% Aggregate% Water% Density kg/m3 0.078 3.6 0.8 7.6 68 23.6 2028 small. An increase in cement content gave a significant drop in density and increase in water content for reaching the same fluidity. For Merit 5000 cement the same weight fraction of the aggregate required somewhat more water to get it fluid, which led to a lower density. The potential of talc to cause fluidity is significantly lower than for the organic superplasticizer. 4. Test Results 4.1. Fluidity The fluidity of concrete is traditionally determined by conducting slump tests that give the height of the pile formed by letting the freshly prepared concrete flow out from the standard metal cone in which it is prepared. The results for the concretes with Glenium and talc composed as in Tables 1 and 2 are given in Table 4. The figures represent the height of the slumps after the outflow. 4.2. pH The pH of the freshly prepared concretes was determined by use of litmus strip papers since pH glass electrodes could not be inserted because of the dominance of coarse aggregate grains. The freshly prepared concrete with Portland cement and Glenium had a pH value of 12 while the concrete with talc had a pH value of 13. In contrast, the talc concrete with Merit 5000 had pH = 10. 4.3. Strength 4.3.1. Compressive Strength of Cement Pastes The cement component of dense concrete generates co- hesive bonds that are mobilized at small strains and de- termine the peak strength. Bulk failure is initiated by successive breakage of these bonds by shearing. The shear and compressive strength of the cement paste con- trols, in principle, the strength of the respective concretes and unconfined compression tests of pastes of the two cements were made for comparison. They were prepared with different water/cement ratios and allowed to mature under water for 10 days for reaching complete hydration. The values are given in Table 5, from which one finds that the Portland cement pastes were 5 to 30 times stronger than the Merit 5000 pastes. The strength of the Portland cement paste with a wa- ter/cement ratio of 3 was almost the same as for the ratio 1, indicating that the lower water content did not give complete hydration. The same was found for Merit 5000 cement. The study shows that the Portland paste was considerably stronger than the Merit, which suggests that the strength of the respective concretes would also be very different. If Merit concrete would turn out to be stronger, chemical reactions involving the talc compo- nent would be the reason. 4.3.2. Compressive Strength of Concrete The unconfined compressive strength was determined after 2, 7 and 28 days. The compression rate was 1.5% of the sample height per minute until failure appeared in the form of cracks. For ductile concrete with no obvious breakage, failure was taken to be the time to reach 10% strain. Two to three series of tests were made for each material. The data are collected in Table 6. The differ- ence in strength is most obvious for the 2-day and 28-day samples of Portland concrete with Glenium while the 7-day samples were much stronger than those tested after 2 days. This suggests that the chemical reactions that gave the ultimately relatively high strength were rather slow. Portland concrete with talc reached a peak strength after 7 days and did not undergo further strengthening. Table 7 gives the compressive strength in MPa of concretes with Portland and Merit 5000 using talc as superplasti- cizer. It shows that while the Portland concrete was stronger in the first weeks the Merit concrete was Copyright © 2013 SciRes. ENG 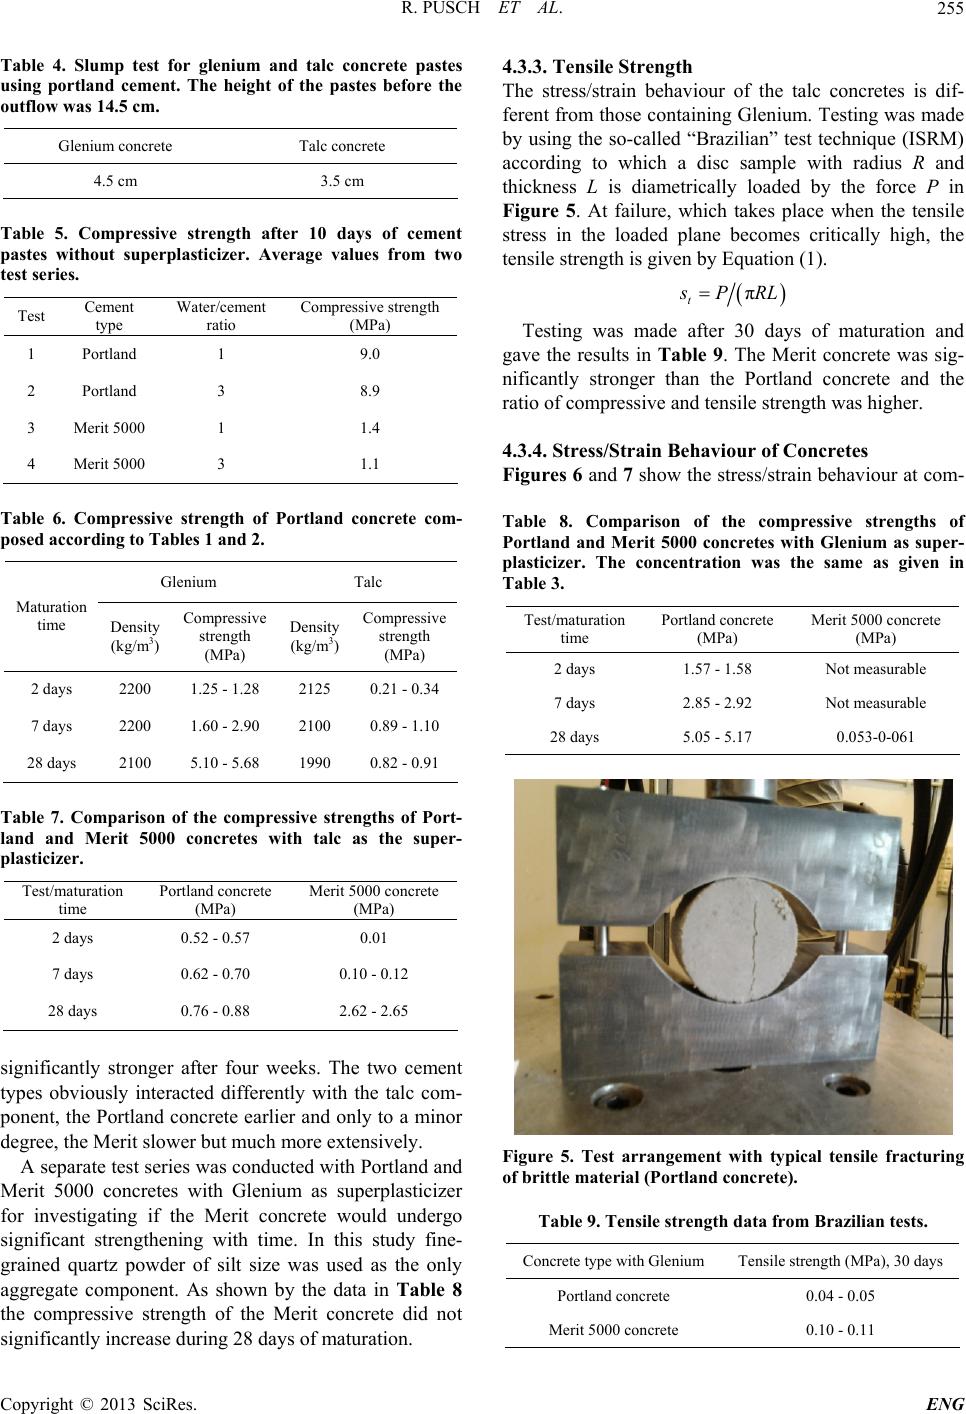 R. PUSCH ET AL. 255 Table 4. Slump test for glenium and talc concrete pastes using portland cement. The height of the pastes before the outflow was 14.5 cm. Glenium concrete Talc concrete 4.5 cm 3.5 cm Table 5. Compressive strength after 10 days of cement pastes without superplasticizer. Average values from two test series. Test Cement type Water/cement ratio Compressive strength (MPa) 1 Portland 1 9.0 2 Portland 3 8.9 3 Merit 5000 1 1.4 4 Merit 5000 3 1.1 Table 6. Compressive strength of Portland concrete com- posed according to Tables 1 and 2. Glenium Talc Maturation time Density (kg/m3) Compressive strength (MPa) Density (kg/m3) Compressive strength (MPa) 2 days 2200 1.25 - 1.28 2125 0.21 - 0.34 7 days 2200 1.60 - 2.90 2100 0.89 - 1.10 28 days 2100 5.10 - 5.68 1990 0.82 - 0.91 Table 7. Comparison of the compressive strengths of Port- land and Merit 5000 concretes with talc as the super- plasticizer. Test/maturation time Portland concrete (MPa) Merit 5000 concrete (MPa) 2 days 0.52 - 0.57 0.01 7 days 0.62 - 0.70 0.10 - 0.12 28 days 0.76 - 0.88 2.62 - 2.65 significantly stronger after four weeks. The two cement types obviously interacted differently with the talc com- ponent, the Portland concrete earlier and only to a minor degree, the Merit slower but much more extensively. A separate test series was conducted with Portland and Merit 5000 concretes with Glenium as superplasticizer for investigating if the Merit concrete would undergo significant strengthening with time. In this study fine- grained quartz powder of silt size was used as the only aggregate component. As shown by the data in Table 8 the compressive strength of the Merit concrete did not significantly increase during 28 days of maturation. 4.3.3. Tensile Strength The stress/strain behaviour of the talc concretes is dif- ferent from those containing Glenium. Testing was made by using the so-called “Brazilian” test technique (ISRM) according to which a disc sample with radius R and thickness L is diametrically loaded by the force P in Figure 5. At failure, which takes place when the tensile stress in the loaded plane becomes critically high, the tensile strength is given by Equation (1). π t PRL Testing was made after 30 days of maturation and gave the results in Table 9. The Merit concrete was sig- nificantly stronger than the Portland concrete and the ratio of compressive and tensile strength was higher. 4.3.4. Stress/Strain Behaviour of Concretes Figures 6 and 7 show the stress/strain behaviour at com- Table 8. Comparison of the compressive strengths of Portland and Merit 5000 concretes with Glenium as super- plasticizer. The concentration was the same as given in Table 3. Test/maturation time Portland concrete (MPa) Merit 5000 concrete (MPa) 2 days 1.57 - 1.58 Not measurable 7 days 2.85 - 2.92 Not measurable 28 days 5.05 - 5.17 0.053-0-061 Figure 5. Test arrangement with typical tensile fracturing of brittle material (Portland concrete). Table 9. Tensile strength data from Brazilian tests. Concrete type with Glenium Tensile strength (MPa), 30 days Portland concrete 0.04 - 0.05 Merit 5000 concrete 0.10 - 0.11 Copyright © 2013 SciRes. ENG  R. PUSCH ET AL. 256 pression of the Portland and Merit concretes matured under water for 7 days, the peak values representing the compressive strength. The Portland concrete showed 3% compressive strain giving a peak value representing brit- tle failure. In contrast, the Merit concrete showed ductile behaviour and progressive strain (Figure 7). After 28 days the Merit concrete was as stiff as the Portland con- crete and showed axial fracturing that is typical of brittle material (Figure 8). 4.4. Chemical and Mineralogical Reactions 4.4.1. XRD The function of the concrete is to provide axial support to the clay seals for at least one hundred thousand years, according to Swedish specifications [3]. During this time the concrete must offer sufficient bearing capacity and tightness, which requires high density and a minimum content of cement. A further criterion is that it must not significantly alter the contacting clay seals. Such impact is caused by the alkali nature of the concrete solution that Figure 6. Uniaxial compressive test of Portland concrete with talc after 7 days. Figure 7. Uniaxial compressive test of Merit concrete with talc after 7 days. Figure 8. Failed Merit concrete with talc matured for 28 days. originates from the alteration of Portland cement as con- cluded from a three year field experiment [4]. This study showed that extensive alteration of the smectite clay oc- curs at the interface by dissolution and cation substitution, with transformation to less expansive clay minerals and amorphous siliceous compounds. Such reactions were found to lead to significant and early loss in the strength of the concrete within a distance of a few centimetres from the clay/concrete contact. The present study was confined to investigate chemi- cal changes of the two concrete versions without interac- tion with clay. 25 g of Portland or Merit 5000 cement were mixed with 15 g of water, and prepared either with or without 2.2 g of talc. XRD analysis of the starting powders, as well as the products that matured, was made after 7 days (Figures 9-11). The talc peaks in the XRD pattern in Figure 10 are labeled. The other peaks all belong to cement minerals, namely portlandite (Port), ettringite (E), brownmillerite (B) and larnite (L) as well as quartz (Q) and calcite (C). The most intense peaks are labeled. The XRD analysis was made using the instrument parameters: Cu-Kα radia- tion, 40 kV 30 mA, Ni filter and a Lynx Eye detector us- ing a Bruker D8 diffractometer. 4.4.2. Scanning Electron Imaging The formation of talc coatings of aggregate grains was evident when observed at the micron-scale but no direct textural evidence of talc dissolution could be seen for Portland concrete (Figures 12 and 13). For the Merit some changes were seen (Figures 14 and 15). The scanning electron microscopy verified two notable Copyright © 2013 SciRes. ENG 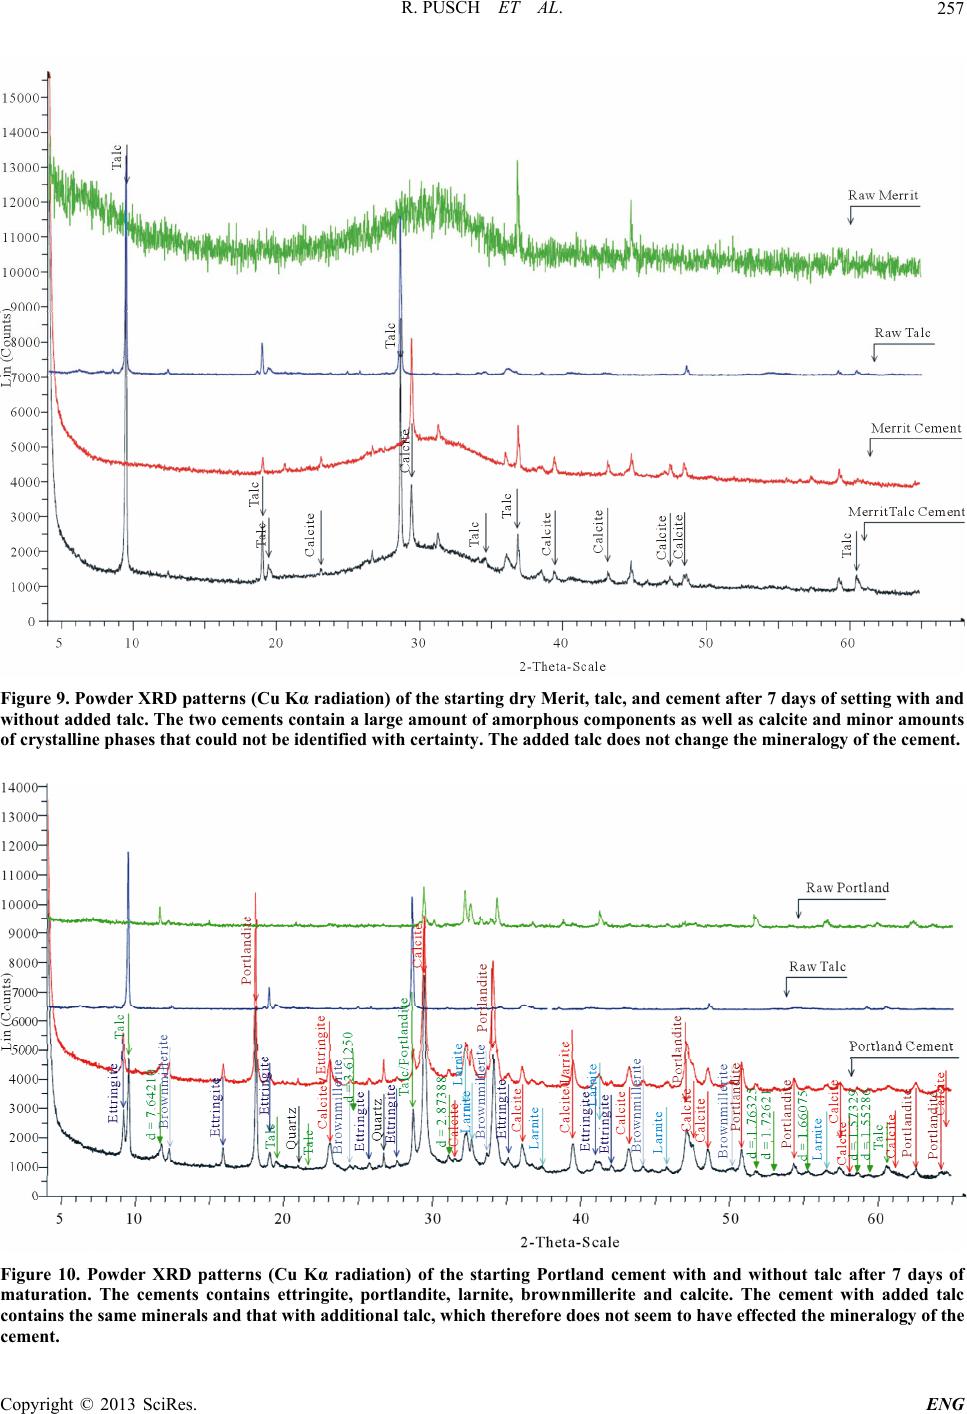 R. PUSCH ET AL. Copyright © 2013 SciRes. ENG 257 Figure 9. Powder XRD patterns (Cu Kα radiation) of the starting dry Merit, talc, and cement after 7 days of setting with and without added talc. The two cements contain a large amount of amorphous components as well as calcite and minor amounts of crystalline phases that could not be identified with certainty. The added talc does not change the mineralogy of the cement. Figure 10. Powder XRD patterns (Cu Kα radiation) of the starting Portland cement with and without talc after 7 days of maturation. The cements contains ettringite, portlandite, larnite, brownmillerite and calcite. The cement with added talc contains the same minerals and that with additional talc, which therefore does not seem to have effected the mineralogy of the cement. 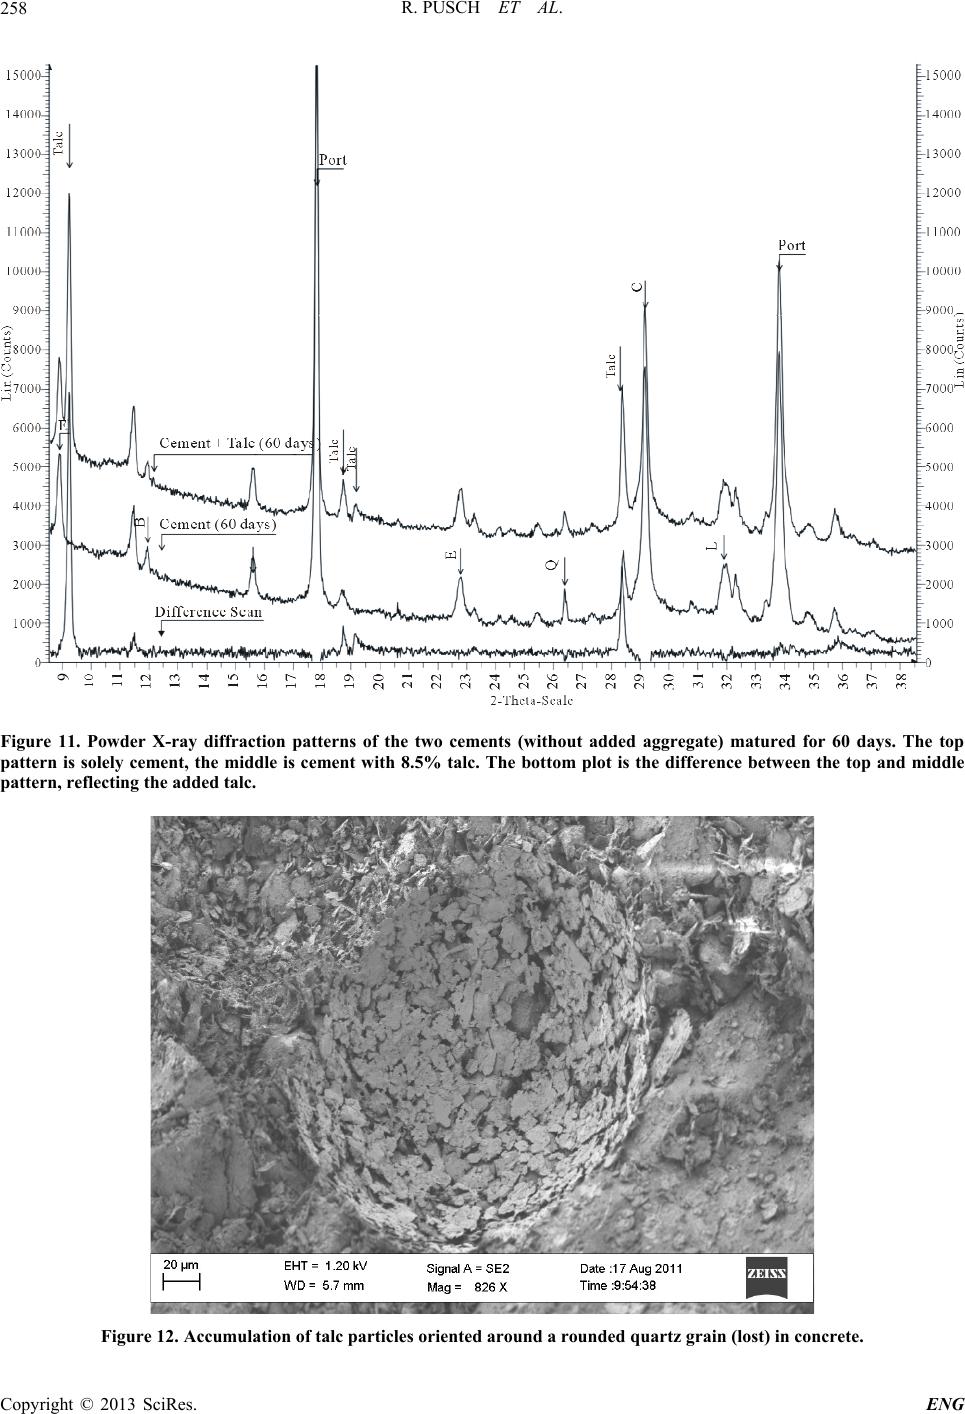 R. PUSCH ET AL. 258 9 Figure 11. Powder X-ray diffraction patterns of the two cements (without added aggregate) matured for 60 days. The top pattern is solely cement, the middle is cement with 8.5% talc. The bottom plot is the difference between the top and middle pattern, reflecting the added talc. Figure 12. Accumulation of talc particles oriented around a rounded quartz grain (lost) in concrete. Copyright © 2013 SciRes. ENG 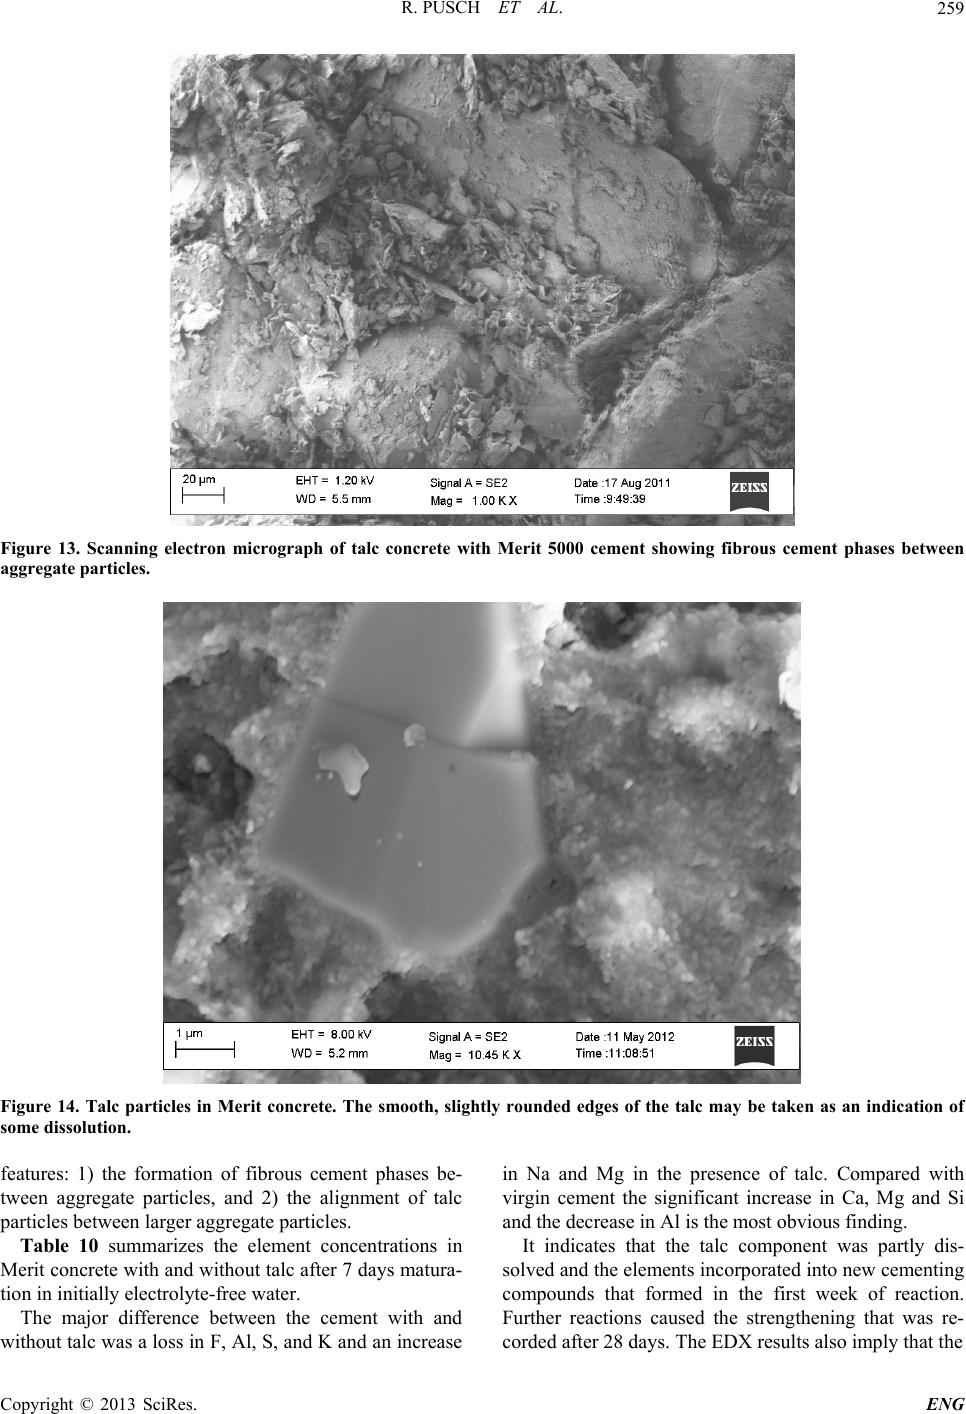 R. PUSCH ET AL. Copyright © 2013 SciRes. ENG 259 Figure 13. Scanning electron micrograph of talc concrete with Merit 5000 cement showing fibrous cement phases between aggregate particles. Figure 14. Talc particles in Merit concrete. The smooth, slightly rounded edges of the talc may be taken as an indication of some dissolution. features: 1) the formation of fibrous cement phases be- tween aggregate particles, and 2) the alignment of talc particles between larger aggregate particles. Table 10 summarizes the element concentrations in Merit concrete with and without talc after 7 days matura- tion in initially electrolyte-free water. The major difference between the cement with and without talc was a loss in F, Al, S, and K and an increase in Na and Mg in the presence of talc. Compared with virgin cement the significant increase in Ca, Mg and Si and the decrease in Al is the most obvious finding. It indicates that the talc component was partly dis- solved and the elements incorporated into new cementing compounds that formed in the first week of reaction. Further reactions caused the strengthening that was re- corded after 28 days. The EDX results also imply that the  R. PUSCH ET AL. 260 Figure 15. SEM photo of Merit cement with talc. The spectrum was taken from the spherical object, which is a cement grain that collapsed during dissolution of the cement balls. Table 10. Element concentration (weight%) of Merit 5000 cement with and without talc measured by energy dispersive X-rays (EDX). Material F Na Mg Al Si S K Ca Ti Fe Raw - - 2.63 1.57 4.46 0.11 - 1.37 - - Matured without talc 1.12 0.07 1.14 1.11 6.28 0.32 0.13 8.84 3.00 - Matured with talc 0.08 0.60 3.06 0.60 7.66 0.08 0.03 8.15 2.47 0.23 dissolution of talc provided additional Mg for the ce- menting minerals. 4.5. Hydraulic Conductivity In this study the hydraulic conductivity was determined on 2 cm thick samples, matured for different periods of time days, by mounting them in oedometers and expos- ing them to a hydraulic gradient of 25 m/m (meter water height per meter flow length). For the Portland concrete the conductivity was found to be 4E−10 m/s. This is in fair agreement with values reported by Powers [8], who found the conductivity of fresh Portland concrete paste to be E−10 m/s after 6 - 8 days and to drop to E−13 m/s after a very long time. For the concrete with Merit cement and talc the conductivity of a 7 days old sample was 5E−9 m/s and 8E−10 m/s for a three week old one. The two concretes hence behaved similarly with respect to permeability. The conductivity is controlled by the degree of filling Copyright © 2013 SciRes. ENG  R. PUSCH ET AL. 261 of the voids in the cement paste through the progressive replacement of the original cement minerals by precipi- tating hydration products, initially in the form of cement gel. The volume of the gel including gel pores produced by hydration is approximately 2.3 times the volume of the cement elements, which leads to a considerable re- duction in free pore space according to Powers [8]. The present authors believe that the hydraulic gradient has a considerable impact on the gel structure, which develops over a long period of time. Thus, high gradients are ex- pected to cause piping and creation of channels that may not self-seal. 5. Microstructural Modelling 5.1. Principles Statistical treatment can be applied to define microstruc- tural parameters [9]. For the talc-concrete the solid ma- trix consists of four major components, 1) aggregate par- ticles, 2) cement grains, 3) talc particles, and 4) water. The aim was to define the granulometric size distribution of these components, for which the sieve curves were utilized. For the microstructural modelling the largest grains were all assumed to have an equivalent “diameter” of 1 mm and all aggregate grains to be tetrahedrons mo- tivated by the angular shape caused by the crushing. Each grain had an edge length representing the “equiva- lent diameter” and a volume that being the base area multiplied by the height and divided by 3. Its weight was the volume multiplied by 2700 kg/m3, which made it possible to calculate the number of grains belonging to the respective size fractions, for which the equivalent diameter was taken to be 0 - 0.8 mm (Fraction 1), 0.4 - 0.8 mm (Fraction 2), and 0 - 0.4 mm (Fraction 3). All particles in the respective fraction were assumed to have the same size and the number of them was calculated from the weights given by the sieve curve. The size of the quadratic REV1 in 2D was defined as 2000 × 2000 μm2. The thickness of it was taken to be 400 μm for giv- ing fair representation of larger particles. The distribution of tetrahedrons was made randomly using four examples, which all lead to nearly the same particle and void dis- tributions indicated in Figure 16. The thickness of the “2D” section was assumed to be 400 μm and hence rep- resent a pseudo-3D box, which made it possible to in- clude complete aggregate grains of the 0 - 0.4 mm frac- tion, i.e. the most important population. 5.2. Derivation of Calibrated Model 5.2.1. Objective The principle of converting 3D to 2D versions of par- ticulate systems was made using a method employed by [5] for applying the Hagen-Poiseuille model used for calculating conductivity. A first issue was to define a model with basic components, the aggregate grains, for comparing it with empirical data in order to find whether the size and variation of the primary pores is reasonable. Omitting grains larger than 1 mm and also talc, and tak- ing cement grains to be spheres, a first step was to calcu- late the number of grains belonging to selected size frac- tions in the 400 μm thick elements with 2000 μm edge lengths. Four cases representing different distributions of ag- gregate grains were analyzed [9], using the densities ρtalc = 2750 kg/m3, ρquartzite = 2650 kg/m3, ρcement = 2900 kg /m3. The basis of the modeling was the weight percentages of the three grain fractions 1 mm, 0.8 mm and 0.4 mm, omitting grains larger than 1 mm. The number of 0 - 0.4 mm grains in Fraction 1 of the REV of the concretes was 0.58, while the number of Fraction 2 grains was 1.86, and 28.9 grains of those belonging to Fraction 3. The cement grains were assumed to form 30 clusters, each with 1000 tightly grouped particles. 5.2.2. 2D Model for Calculating the Hydraulic Conductivity Using the calculated number of grains of each fraction and the numbers of talc and cement clusters, a great vari- ety of microstructural constitutions can be derived as exemplified by Figure 17 in which one recognizes the quartzite and quartz tetrahedrons represented by triangles with 3 different sizes corresponding to the three size fractions mentioned. The talc particles appear as thick stacks marked red in the 2D sections, sticking to the ag- gregate grains. The figure to the right shows the distribu- tion of voids, represented by circles of two sizes, 150 and 75 μm. 5.2.3. Hydraulic Conductivity Calculation of the hydraulic conductivity of the model was made by using the Hagen/Poiseuille law, adopting here the way of conceptualizing an individual pore as an equivalent capillary tube in which flow occurs according to the law for capillary flow, cf. [10,11]. The volumetric flow rate, Qh can be written as the sum of the flow rates of individual saturated capillaries within the ith fraction of the porous medium. One hence gets iti QqNp where qt is the volumetric flow rate for a single tube channel (cm3/s) and Npi being the number of pores of the ith pore size fraction [12]. For a system consisting of N capillaries with radius r, and a total cross section area of Atot, the porosity n can be derived from Equation (2). 2 πtot nNrA (2) 1Representative elementary volume. Copyright © 2013 SciRes. ENG  R. PUSCH ET AL. Copyright © 2013 SciRes. ENG 262 Figure 16. Schematic view of the REV for talc concrete in 2D. The section is taken to be 400 μm thick and host aggregate grains representing the size fractions 0.8 - 1 mm, 0.4 - 0.8 mm, 0 - 0.4 mm. The non-hydrated cement grains are assumed to be 20 μm in diameter. The talc particles are assumed to cover the whole surface of the indicated aggregate grains and to have an average thickness of 100 micrometer. Figure 17. Left: 2D model with tetrahedral aggregate grains, circular cement grains and talc patches (thick lines) in the left picture. The cement clusters are circular, each of them representing 1000 cement particles. Right: Location of the voids before hydration of the cement: 12 with 150 µm diameter and 39 with 75 µm diameter. By using the Hagen-Poiseuille law (Equation (3)) one gets for the flow rate v: 4 π8vr PL (3) where, η is the fluid viscosity, ΔP is the pressure differ- ence between in- and outflow ends, L is the total length of the capillary. Applying this to the four versions of the model the flow rate q of water was found to be 8.7E−4 to 1.2E−3 cm3/s. Using Darcy’s law tot qKPLA , the average conductivity K was in the interval 3.3E−5 to 5.9E−5 m/s [9]. The K-values refer to the case of non-hydrated cement, neglecting tortuosity, which is a measure of the influence of twisted or dead-ending pores [13-15]. Applying the tortuosity factor π/2, meaning that the diameter of the flow paths are reduced by about 60%, the net hydraulic conductivity of no more than E−6 m/s was obtained, which is typical of sandy/silty soils of high density. The models are therefore concluded to be relevant from the  R. PUSCH ET AL. 263 point of hydraulic conductivity. The microstructure will change significantly from the considered “dry” state to the “wet” stage when cement hydration has taken place, implying absorption of water and swelling of the cement particles [8]. Following Pow- ers one can assume that the volume of the hydrated ce- ment grains increases by 100%. This reduces the size and interconnectivity of the voids, which will be occupied by cement gels. Thus, the geometry of the ultimately formed system of pores and capillaries depends strongly on the changes of volume of the cement hydration products [16]. Estimating the size of the individual water-bearing channels of cross sections, like those in Figure 17, to be reduced by 50% the net average hydraulic conductivity of the matured modeled concretes will drop from E−7 to less than E−10 m/s, which is hence in agreement with Powers’ and or own results. The ultimate conductivity after complete formation of cementing reaction products goes down further but dissolution and loss of sealing components will make it rise in a very long time perspec- tive. 5.2.4. Maturation and Strength Increase Cement hydration and hardening: two processes lead to the hardening of cement by chemical reaction when mixed with water: primarily the reaction between trical- cium aluminate, and secondly the hydration of the cal- cium silicates [17]. Since the concretes in the current study have very small amounts of cement, their strength is significantly lower and their hydraulic conductivity higher than for typical construction concretes, which have a water/cement ratio of 0.23 to 0.4. The relative volumes of the aggregate grains, talc, cement hydration products and excess water determine the distribution of bonds and hence the strength of the microstructural net- work. They are determined by processes influenced by phase transitions [17], and by the successive dispersion and loss of the binders. Strength distribution in the microstructure of concrete: the microstructural models described in the preceding section can be used for developing hypotheses concern- ing the distribution of the strength-producing bonds pro- vided by the cement component and of the rate of strength growth. For this purpose one can consider a model version with 30 cementing units in a volume of 1.6 mm3, corresponding to 1.6E−9 bonding units per cubic meter of concrete. A large number of them, approxima- tely 50% in the model, are separated from aggregate grains by stacks of talc lamellae, and since virgin talc has negligible shear strength the bulk strength of talc con- crete is predicted to be low compared with ordinary con- crete with no superplasticizer. However, chemical reac- tions involving dissolution the talc component involving dissolution of talc and precipitation of cementing com- plexes, are concluded to give a successive increase in strength as we see from the SEM pictures of the Merit concrete (Figure 14), but not in those of the Portland cement. A possible explanation of this difference is that the dissolution/precipitation processes takes place quickly and locally in the high-pH Portland concrete and slower and more wide-spread in low-pH Merit concrete with talc. 6. The Bearing Capacity of the Concrete with Respect to the Actual Loading in Deep Boreholes 6.1. Stress Distribution in Boreholes with Clay and Concrete Seals The role of the concrete seals is to support the clay plugs and to serve as a filter for preventing clay particles from migrating out into the fracture zones. The concrete con- tains very little cement for minimizing the clay-degrad- ing impact of pH caused by cement, which does therefore not generate significant wall friction. The concrete ma- tures slowly and does not harden until after one week. Before this, it acts as a viscoplastic material with sub- stantial internal friction. The clay also behaves viscoplas- tically and expands by absorbing water from the sur- rounding rock. It stiffens as a function of time after in- stallation and establishes sufficient bonding to the rock to carry itself after a couple of days. The bore sealing procedure is as follows: 1) concrete is cast to fill the hole from the bottom up to 5 m above the lowest fracture zone and left to mature for 2 days to one week; 2) the first clay plug is placed with its upper end 5 m below the second lowest fracture zone and left to ma- ture for 2 days: 3) concrete is cast over the clay plug and left to mature for a further 2 days; 4) the second clay plug is installed and left to mature for 2 days, and so on. A 1000 m deep hole will be intersected by 5 - 20 fracture zones, meaning that the entire effective time for sealing the hole is about 20 - 100 days, assuming that each in- stallation takes one day. In principle, all the seals must have hardened sufficiently to carry the overlying material throughout the sealing campaign. The clay plugs can expand axially but not be compressed because the clay is confined in perforated copper tubes that form stiff units, meaning that only the clay “skin” formed between the tubes and the rock needs to be considered. The concrete seals can be compressed but not expanded. For determining whether each concrete seal can carry the clay plug placed above it without yielding, the pres- sure distribution in the entire series of seals must be known. If the bearing capacity of a concrete plug is not sufficient it will be pressed up along the tube with clay, by which the sealing capacity of the clay is strongly re- Copyright © 2013 SciRes. ENG 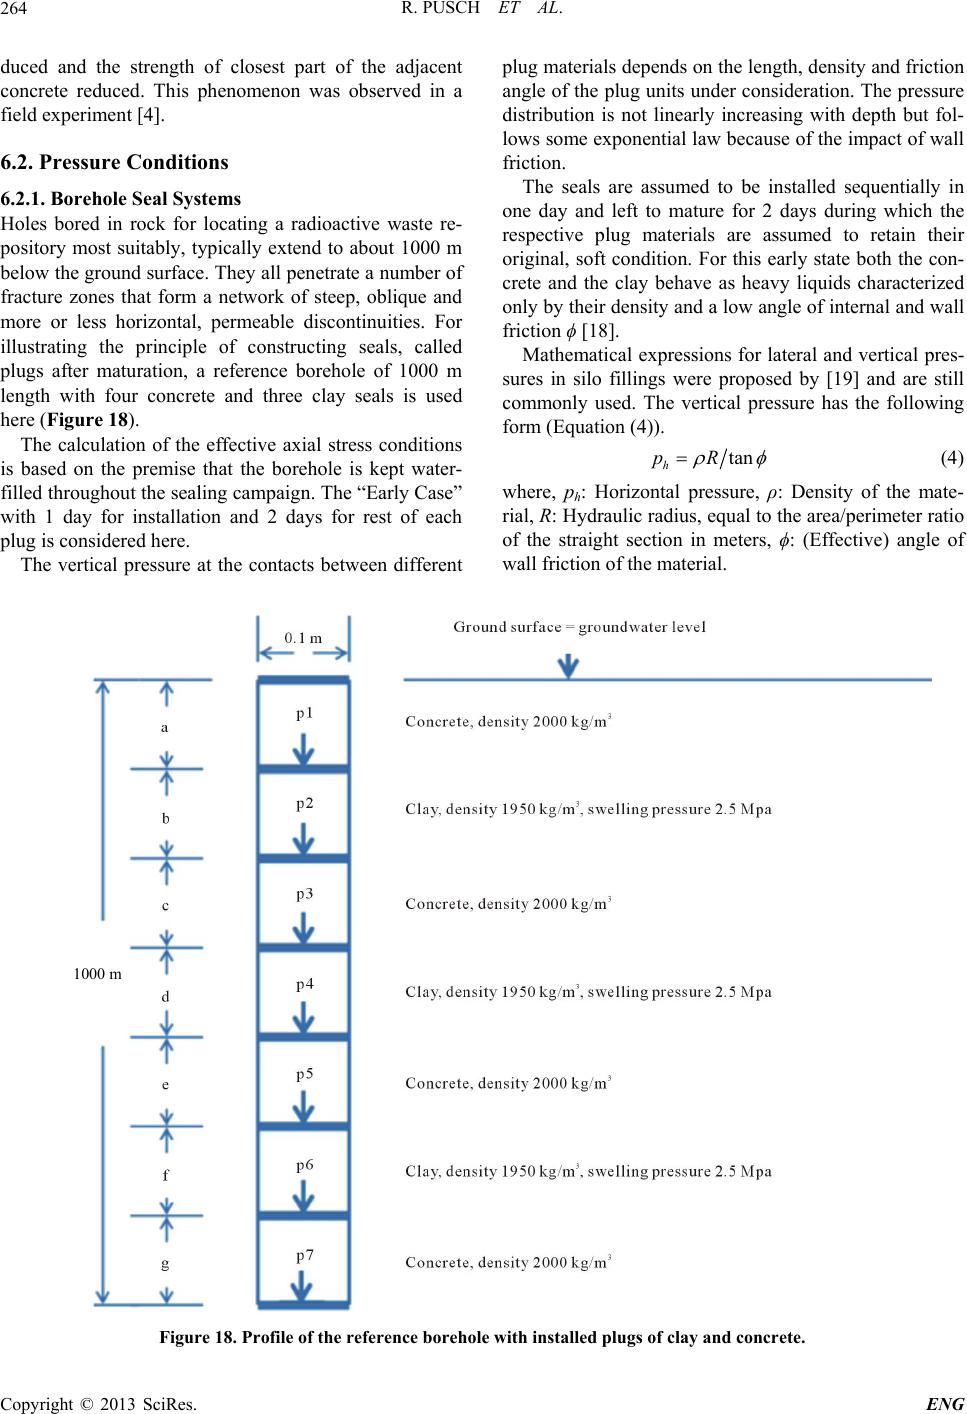 R. PUSCH ET AL. Copyright © 2013 SciRes. ENG 264 plug materials depends on the length, density and friction angle of the plug units under consideration. The pressure distribution is not linearly increasing with depth but fol- lows some exponential law because of the impact of wall friction. duced and the strength of closest part of the adjacent concrete reduced. This phenomenon was observed in a field experiment [4]. 6.2. Pressure Conditions The seals are assumed to be installed sequentially in one day and left to mature for 2 days during which the respective plug materials are assumed to retain their original, soft condition. For this early state both the con- crete and the clay behave as heavy liquids characterized only by their density and a low angle of internal and wall friction ϕ [18]. 6.2.1. Borehole Seal Systems Holes bored in rock for locating a radioactive waste re- pository most suitably, typically extend to about 1000 m below the ground surface. They all penetrate a number of fracture zones that form a network of steep, oblique and more or less horizontal, permeable discontinuities. For illustrating the principle of constructing seals, called plugs after maturation, a reference borehole of 1000 m length with four concrete and three clay seals is used here (Figure 18). Mathematical expressions for lateral and vertical pres- sures in silo fillings were proposed by [19] and are still commonly used. The vertical pressure has the following form (Equation (4)). The calculation of the effective axial stress conditions is based on the premise that the borehole is kept water- filled throughout the sealing campaign. The “Early Case” with 1 day for installation and 2 days for rest of each plug is considered here. tan h pR (4) where, ph: Horizontal pressure, ρ: Density of the mate- rial, R: Hydraulic radius, equal to the area/perimeter ratio of the straight section in meters, ϕ: (Effective) angle of wall friction of the material. The vertical pressure at the contacts between different 1000 m Figure 18. Profile of the reference borehol with installed plugs of clay and concrete. e  R. PUSCH ET AL. 265 The concrete plugs will undergo some slight shrinkage and compression under their own weight. This generates axial shortening and thereby generation of wall friction that increases with the age of the cast concrete. The clay plugs undergo evolution in the form of ex- pansion of the clay through the perforation of the tubes (cf. Figure 3) that initially contain highly compacted expandable (smectite) clay blocks. A clay “skin” is formed around the tubes, providing an increasingly strong bond between the rock and the clay. The shear strength of the clay skin increases with time caused by the increasing swelling (effective) pressure, meaning that the “wall fric- tion” increases. 6.2.2. Evolution of the Effective Vertical Stress in the Seals in a Deep Hole The hole is assumed to be located in rock with the groundwater level coinciding with the ground surface. The pressure generated by the own weight of the seals is gravitational and hence directed downwards while the wall friction acts upwards and hence reduces the gravita- tional force. Figure 18 specifies the levels for which the effective pressure (P1, P2, etc.) shall be determined. All segments have the same height, i.e. 142.85 m (1000/7 m). The calculation refers to the successive construction stages, starting with casting concrete to 142.85 m height and leaving it for two days to rest (Stage 1), after which a clay plug consisting of jointed 12 m long perforated copper tubes filled with highly compacted clay are in- serted with the top at 2 × 142.85 m = 285.70 m (Stage 2). After letting the clay plug rest for two days on top of the first concrete plug, the second concrete plug is cast with its top 428.55 m above the lower end of the hole (Stage 3). It is left to rest for two days after which the second clay plug is inserted, its upper end being 571.40 m above the base of the hole (Stage 4). Two days later concrete is cast over it with the upper end being 714.25 m above the base of the hole (Stage 5). This third concrete plug is left to rest for two days after which the third clay plug is in- serted reaching up to 857.15 m above the base of the hole (Stage 6). After two days of rest the fourth concrete plug is cast up to the ground surface (Stage 7). Calculated pressure distribution: calculation of the vertical pressure according to this principle gave the pressure distribution in Figure 19, from which one con- cludes that the pressure increases successively with the depth, ranging from −0.30 MPa2 at the base of the up- permost concrete plug to −7.76 MPa at the base of the borehole. The pressure increase is not linear for Stage 4 and subsequent stages because of the assumed increase in internal and wall friction angles. The compressive strength for each stage is consistently higher than the effective stress, meaning that stable conditions prevail throughout the sealing campaign. The only possibly critical condi- tion is represented by Stage 2 for which the strength of the clay “skin” has to be relied on for avoiding failure of the concrete where the clay plug is in contact. In practice one can raise the safety factor by letting the clay plug hang on the drill rig during the required 2 days of matu- ration. 0 200 400 600 800 1000 1200 ‐9‐8‐7‐6‐5‐4‐3‐2‐10 Depth,m Effectivepressure,MPa stage1 stage2 stage3 stage4 stage5 stage6 stage7 Figure 19. Distribution of the effective pressure in the respective construction stages. The bearing capacity is represented by he upper curve for each stage and the effective pressure by the lower curves. t 2Minus indicates pressure, plus is for tension. Copyright © 2013 SciRes. ENG  R. PUSCH ET AL. 266 Impact of volume change: the concrete plugs will un- dergo some slight shrinkage and compression under their own weight. This generates axial shortening and thereby generation of wall friction that increases with the age of the concrete. With increased age of the plugs follows increased shear and compressive strengths, implying that the system of plugs becomes stronger and that axial strain under their own weight will be small. The ductility, expandability and self-sealing capacity of the clay plugs will make the whole series cohere and effectively tighten the holes. 7. Discussion and Conclusions The study led to new types of concrete for sealing deep boreholes using crushed and milled quartzite with very fine quartz-rich material as aggregate material, and Merit 5000 cement with talc as the superplasticizer. A recipe of such a concrete is proposed in Table 11. The cement content (0.8%) is very low in order to limit the growth in void size that results from dissolution and loss of this component, and also for minimizing the impact of high pH on the chemical stability of contacting clay seals in the boreholes. The density of the concrete is believed to be sufficiently high to make the concrete perform acceptably for very long periods of time even after complete loss of the cement since the aggregate matrix is as stiff and moraine soil. The pH of the Merit concrete is also around 10 and hence much lower than that of Portland concrete. The major conclusions from the study are: When using talc as a superplastifier, the Merit con- crete has a low compressive strength after 7 days, i.e. about 1/5 of that of Portland concrete, but is more than 3 times higher strength after 28 days, which in- dicates that the chemical reactions involving dissolu- tion of the talc and neoformation of silicious cement- ing compounds provides the high ultimate strength; The Merit concrete is tough and ductile in the early maturation phase as indicated by tensile stressing, but shows brittleness after a few weeks. This makes the concrete perform acceptably both in the construction phase and later; Talc serves to reduce the viscosity in the preparation stage and to contribute to the strength of the maturing concrete; Merit concrete with properly composed quartz-rich aggregate and with talc additive fulfils the criteria set, except that its placeability has not yet been demon- strated. 8. Acknowledgements This study profited from using a Bruker D8 diffractome- ter and a Zeiss Auriga FIB-SEM crossbeam microscope Table 11. Talc (T) concrete recipe for Merit 5000 cement, weight percentages. Cement/ aggregate w/c Cement%T %Aggregate% Water%Density kg/m3 0.078 3.60.8 7.668.0 23.6 2028 at the University of Greifswald both of which were fi- nanced by the German research foundation (DFG). We also thank Manfred Zander for his technical assistance in operating the Auriga microscope. REFERENCES [1] N. Bockgård, “Hydraulic Effects of Unsealed Boreholes. Numerical Groundwater Flow Modelling of the Forsmark and Laxemar Site,” Report of Sub Project 2 of Borehole Sealing Project Phase 4, Svensk Kärnbränslehantering, 2011. [2] R. Pusch and G. Ramqvist, “Borehole Sealing Project,” Final Report of Phase 3, SKB, 2007. [3] Ch. Svemar, “Cluster Repository Project (CROP),” Final Report of European Commission Contract FIR1-CT-2000, Brussels, 2005. [4] L. N. Warr and G. H. Grathoff, “Sealing of Investigation Boreholes: Mineralogical and Geochemical Borehole Plug Analyses,” SKB Report, Ernst-Moritz-Arndt-Universität, Greifswald, 2010. [5] R. Pusch and R. N. Yong, “Microstructure of Smectite Clays and Engineering Performance,” Taylor & Francis, New York, 2006. [6] R. Chaplow, “Review of Requirements for Sealing Inves- tigation of Boreholes,” Nuclear Decommissioning Author- ity Radioactive Waste Management Directorate, Robert Chaplow Associates Ltd., Oxfordshire, 2011. [7] R. Pusch, G. Ramqvist, N. Bockgård and L. Ekman, “Seal- ing of Investigation Boreholes Phase 4,” Final Report, SKB, 2011. [8] T. C. Powers, “Structure and Physical Properties of Hard- ened Portland Cement Paste,” Journal of American Ce- ramic Society, Vol. 41, No. 1, 1958, pp. 1-6. doi:10.1111/j.1151-2916.1958.tb13494.x [9] A. Pourbakhtiar, “Pilot Study of Method for Constructing Concrete Seals and Fracture Grouts in Deep Boreholes and Cementitious Backfills in Tunnels, Drifts and Shafts in Crystalline Rock,” Master Thesis, Lulea University of Technology, Luleå, 2012. [10] G. K. Batchelor, “An Introduction to Fluid Dynamics,” Cambridge University Press, Cambridge, 1967. [11] D. Hillel, “Soil and Water: Physical Principles and Proc- esses,” Academic Press, New York, 1971. [12] L. M. Arya, F. J. Leij, P. J. Shouse and M. van Genuchten, “Relationship between the Hydraulic Conductivity Func- tion and the Particle-Size Distribution,” Soil Science So- ciety of America Journal, Vol. 63, No. 5, 1999, pp. 1063- 1070. doi:10.2136/sssaj1999.6351063x [13] Y. Mualem, “A New Model Predicting the Hydraulic Conductivity of Unsaturated Porous Media,” Water Re- Copyright © 2013 SciRes. ENG  R. PUSCH ET AL. 267 sources Research, Vol. 12, No. 3, 1976, pp. 513-522. doi:10.1029/WR012i003p00513 [14] K. Kosugi, “General Model for Unsaturated Hydraulic Conductivity for Soils with Lognormal Pore-Size Distri- bution,” Soil Science Society of America Journal, Vol. 63, No. 2, 1999, pp. 270-277. doi:10.2136/sssaj1999.03615995006300020003x [15] T. Vogel, M. Th. van Genuchten and M. Cislerova, “Ef- fect of the Shape of the Soil Hydraulic Functions near Saturation on Variablysaturated Flow Predictions,” Ad- vances in Water Resources, Vol. 24, No. 2, 2000, pp. 133- 144. doi:10.1016/S0309-1708(00)00037-3 [16] P. Paulini, “A Through Solution Model for Volume Changes of Cement Hydration,” Elsevier Science, Cement and Concrete Research, Vol. 24, No. 3, 1993, pp. 488- 496. doi:10.1016/0008-8846(94)90137-6 [17] F. Locher, “Cement, Principles of Production and Use,” Verlag, Berlin, 2006. [18] A. W. Jenike, “Storage and Flow of Solids,” Utah Engi- neering Experiment Station, University of Utah, Salt Lake City, 1970, Bulletin No. 123. [19] J. Ravenet, “Silo Problems,” Bulk Solids Handing, Vol. 1, No. 4, 1981, pp. 667-679. Copyright © 2013 SciRes. ENG
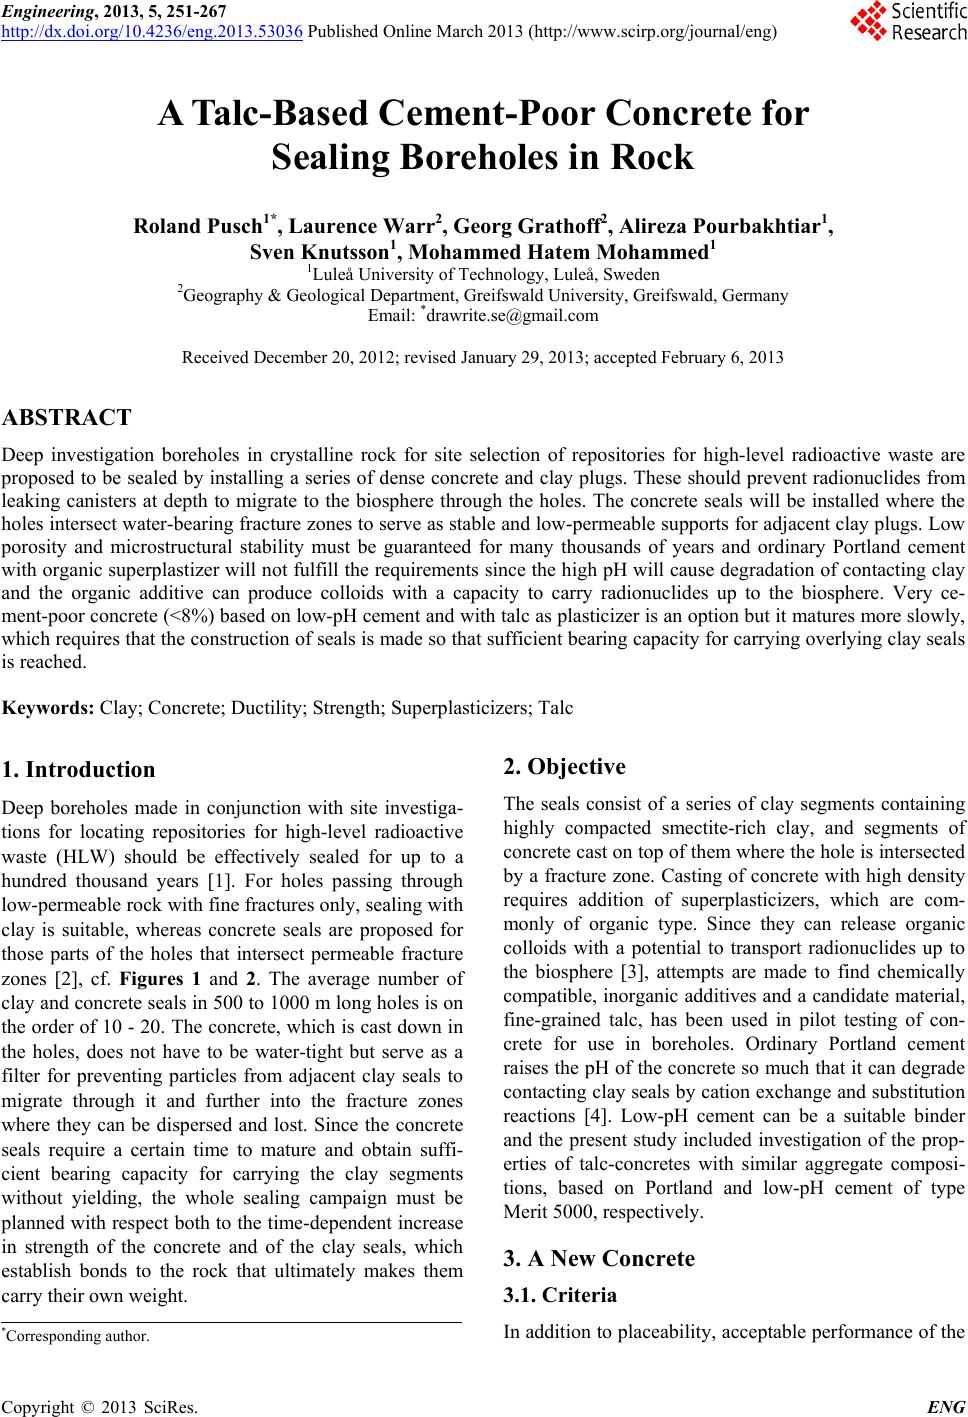
|