 Psychology 2013. Vol.4, No.1, 1-10 Published Online January 2013 in SciRes (http://www.scirp.org/journal/psych) http://dx.doi.org/10.4236/psych.2013.41001 Copyright © 2013 SciRes. 1 An Experimental Analysis of the Assessment and Perception of Behavior Change: How Summary Measures Influence Sensitivity to Change Processes Anselma G. Hartley1, Jack C. Wright1, Audrey L. Zakriski2, Anne N. Banducci3 1Department of Cognitive, Linguistic, & Psychological Sciences, Brown University, Providence, USA 2Department of Psychology, Connecticut College, New London, USA 3Department of Psychology, University of Maryland, College Park, USA Email: Anselma_Hartley@brown.edu Received October 6th, 2012; revised November 6th, 2012; accepted December 4th, 2012 A series of experiments examined how summary assessment measures influence people’s ability to detect change in behavior over time and across situations. Two measures that are often used to assess child be- havior (Teacher Report Form) and adult personality (Five Factor Inventory) were examined. Each instru- ment led perceivers to focus on the overall frequency of targets’ behavior, even when targets differed both in how they reacted to social events and in how often they experienced those events in their interactions with others. Although people adopted an overall frequency perspective when using summary measures, they detected changes in events and targets’ if … then … reactions to events when using alternative con- text-specific measures. The findings demonstrate how summary trait methods can shift perceivers’ atten- tion away from situational factors and thereby yield trait scores that are insensitive to context-specific but potentially important changes in targets’ social behavior. Keywords: Personality; Social Perception; Assessment; Behavior Change; Social Context Introduction A potential conflict exists between the way people think about personality and how researchers assess it. On the one hand, researchers often emphasize the breadth and stability of traits and therefore use personality measures that aggregate over variability that may occur over time and situations (Mischel, 2009; Watson, 2004). On the other hand, social cog- nition research suggests that people incorporate situational information into their personality impressions (Kammrath, Mendoza-Denton, & Mischel, 2005; Smith & Collins, 2009). Despite the widespread use of “summary” trait measures in both child and adult assessment, little research has explored how social perceivers use them under laboratory conditions in which the relevant inputs can be isolated and manipulated. The present research illustrates how such methods can deepen our understanding of how summary trait measures influence per- ceivers’ sensitivity to personality change. In this paradigm, we create targets who show different patterns of change over time in their social environments and in how they responded to them. We examine the possibility that summary trait measures lead perceivers to focus on overall behavior rates and to de-empha- size contextual information they might otherwise use. We test the further implication that this emphasis on overall frequencies leads raters to report that target behavior is stable over time even when targets show clear changes in how they respond to specific social situations. Summary approaches have a long tradition in child and adult assessment. On widely used child measures (e.g., Teacher Re- port Form or TRF, Achenbach & Rescorla, 2001), an adult typically rates how well brief statements describe the child. Many of these statements focus on the frequency of behaviors (“teases a lot,” “threatens people”), some include trait adjec- tives (“stubborn”), and less often they refer to the context in which the behaviors occur (“disobedient at school”, “defiant, talks back”). Popular “Big Five” measures used to assess adult personality (e.g., NEO-PI-R and the NEO-Five Factor Inven- tory or FFI, Costa & McCrae, 1992) also include behavior fre- quency statements (e.g., “seldom sad or depressed”), trait ad- jectives (“is a cheerful, high-spirited person”), and statements that explicitly refer to behavior in context (“if he doesn’t like people, he lets them know it”). Although these child and adult measures vary in how their items were generated and how often they refer to contexts, they share an essential feature: Both aggregate into summary scales that do not reveal what these contexts are, how often they occur, or how responses to them may vary. Such measures thus focus on mean-level behavior tendencies, and do not reveal individual differences in how people respond to specific contexts (Cervone, 2005; Cervone, Shadel, & Jencius, 2001). Alternative models incorporate context into personality as- sessment by examining if … then … links between events that occur in a person’s social environment (e.g., if provoked) and their reactions to them (e.g., then hostile) (Vansteelandt & Van Mechelen, 1998; Wright & Mischel, 1987). Studies adopting such approaches have demonstrated that personality is revealed not simply through overall trait or behavior levels, but through an individual’s contextualized patterning of trait-relevant be- havior (Fournier, Moskowitz, & Zuroff, 2008; Hartley, Zakriski, & Wright, 2011; Hoffenaar & Hoeksma, 2002; Smith, Shoda, Cumming, & Smoll, 2009). A complementary line of “socially situated” cognition research proposes that context plays an  A. G. HARTLEY ET AL. important role in social perception and judgment (Reeder, Monroe, & Pryor, 2008; Smith & Collins, 2009). Although early studies on the “fundamental attribution error” (Ross, 1977) argued that situational influences are often ignored, subsequent research found that people do incorporate contextual informa- tion into their personality judgments, but when and how they do so depends on several factors (Gilbert & Malone, 1995). For example, people have difficulty integrating situational influ- ences into their dispositional judgments when the salience of the stimuli is low and cognitive load is high (Chun, Speigel, & Kruglanski, 2002). People’s ability to process behavioral and situational information also depends on their statistical knowl- edge and investment in the target (Schaller, 1992), and on their affective state (Hunsinger, Isbel, & Clore, 2011). Despite considerable field research using summary measures (Gresham et al., 2010; Terracciano, McCrae, & Costa, 2009), little work has examined how perceivers use them under con- trolled laboratory conditions. Social cognition research has used experimental methods to study people’s use of situational in- formation (Chun et al., 2002; Kammrath et al., 2005; Trope & Gaunt, 2000), yet this work has not examined how summary trait measures influence what people encode in their ratings. Some researchers have claimed that summary measures are implicitly contextualized by the respondent even when items lack explicit contextual cues (Tellegen, 1991; Wood & Roberts, 2006), and are therefore sensitive to reaction patterns (Denissen & Penke, 2008). For example, items that contain trait adjectives (e.g., “thoughtful and considerate”, “is a cheerful, high spirited person”) might lead the rater to infer the situations that are most relevant and to judge how the target reacts when those situa- tions are encountered. However, we are unaware of an experi- mental test of this idea. Other researchers have speculated that summary methods lead people to rely on global representations lacking in specific time or setting cues (Schwarz & Oyserman, 2011). Support for this argument is found in studies showing that summary measures lead people to ignore conditional if … then … links between events and reactions and focus instead on overall act frequencies (Wright et al., 2001). In the present study, we test the idea that summary measures—including popular child behavior measures and adult five-factor meas- ures—are designed to assess overall behaviors, do this well, but in doing so miss changes in how people respond to specific social situations. We extended past work in several ways. First, rather than focusing on a single time point, we created targets that changed over time, both in how often they encountered events (“event rates”) and in the conditional probability of their responses to them (“reaction rates”). In Studies 1-2ab, peer provocation and adult discipline were the focal events and aggression was the focal reaction, as these are relevant to child assessment (Dirks, Treat, & Weersing, 2007). This yielded two targets who showed “converging” changes in event rates and reaction rates (i.e., both decreased or both increased), and thus their overall rates of aggression increased or decreased. The two other tar- gets showed “diverging” changes: One experienced an increase in aversive events, but became less likely to respond aggres- sively to them; the other experienced a decrease in aversive events, but became more likely to respond aggressively. These targets are especially interesting because they show opposite changes in event and reaction rates, yet show no change in overall aggression rates. If summary measures track only over- all rates, as we have proposed, they should distinguish between targets whose overall rates differ, but fail to distinguish be- tween targets who show opposite reaction change but constant overall behavior rates. If, on the other hand, these measures are implicitly contextualized as others have suggested, they should distinguish between targets whose reactions to events changed over time, even if their overall behavior rates did not. Second, we used both child and adult targets, and we exam- ined both popular measures for studying child behavior (TRF; Achenbach & Rescorla, 2001) and adult personality (NEO-FFI; Costa & McCrae, 1992). In each of our experiments, partici- pants used the instrument to rate the target at the end of one period of observation, and then again at the end of a second period. Studies 1-2ab focused on aggressive behaviors of chil- dren that are relevant to the TRF, and Study 3 focused on (dis) agreeable behaviors of adults that are relevant to the agreeable- ness domain on the FFI. Guided by past theorizing and evi- dence (Schwarz & Oyserman, 2011; Wright et al., 2001), we hypothesized that relevant scales on the TRF (aggression) and FFI (agreeableness) would be sensitive to changes in targets’ overall behavior rates, but insensitive to differences between the diverging targets whose reactions changed in opposite di- rections. Third, we examined whether participants can detect changes in rates of eliciting events and changes in targets’ conditional reactions to them, even if this is not evident when they use summary trait measures. Based on people’s sensitivity to con- text at a single time point (Chun et al., 2002; Wright et al., 2001), we predicted that participants’ open-ended descriptions of targets would refer not only to their overall behavior tenden- cies, but also to events targets encountered and their event- specific reactions. We further expected that participants would differentiate between the diverging targets when explicitly asked to estimate how often targets encountered events and the conditional probability of their reactions to those events. Be- cause people can have difficulty judging conditional probabili- ties (see Fox & Levav, 2004), we examined how two response formats—a typical rating format (e.g., Vansteelandt & Van Mechelen, 1998) versus a frequency-count estimation format (Gigerenzer, 2008)—influenced their performance. Support for these hypotheses would indicate that widely used summary assessment methods divert people’s attention away from situa- tion-specific changes in behavior they otherwise notice and thereby yield ratings that reflect only targets’ overall behavior frequencies. Study 1 We first examined change over time. Using a 2 (event rate) × 2 (reaction rate) × 2 (phase) design, we manipulated whether a target child experienced an increase or decrease in the probabil- ity of aversive events (“event rates”), and an increase or de- crease in the conditional probability of aggressive behavior when those events occurred (“reaction rates”). We hypothesized that the TRF is primarily sensitive to base-rates, and thus should be influenced by all factors that contribute to overall behavior (i.e., events and reactions), and not just by targets’ reaction rates. Thus, the TRF should be unable to distinguish between the functionally diverging targets even though one showed an increase in aggressive reactions to aversive events and one showed a decrease. Copyright © 2013 SciRes. 2  A. G. HARTLEY ET AL. Method Participants Forty-three undergraduates from the pool in an introductory psychology class participated at Brown University. Three were removed: two who completed materials out of order, and one who did not understand the instructions. This yielded a sample of 40 (20 M, 20 W, Mage = 19.2 years, SD = 1.17). All studies reported were approved by Brown University’s Institutional Review Board. Materials The experimental stimuli were based on Wright et al. (2001), but described the target at two points. The target was identified as a fictitious 11-year-old boy (“Dan”) in a residential summer program. Participants viewed 32 vignettes that described the target at the beginning of the summer (Phase 1) and 32 that described him 9 weeks later (Phase 2). Four targets were cre- ated. One encountered an increase in aversive events and showed an increase in aggressive reactions to those events (E+/R+) (“+” = increase). The second showed a decrease in both event rates and reaction rates (E−/R−) (“−” = decrease). The third encountered an increase in aversive events, but showed a decrease in aggressive reactions (E+/R−). The fourth had the reverse arrangement (E−/R+). Each vignette, presented for 9 seconds on an otherwise blank computer screen, described the setting and an interaction be- tween Dan and another person. The setting, agent, agent action, target name, and response appeared in the same order. Events consisted of aversive peer events (tease, threaten), aversive adult events (warn, discipline), nonaversive peer events (proso- cial talk, ask), and non-aversive adult events (prosocial talk, ask/instruct). Reactions were aggressive or nonaggressive. An example of a peer aversive event with an aggressive reaction is: “In the dining hall a boy says, ‘Shut up and give me your des- sert.’ Dan replies, ‘No, you shut up. I want it.’” An example of an adult aversive event with a non-aggressive reaction is: “In swimming, a counselor says, ‘You better not go past that green rope.’ Dan says, ‘Okay, I won’t.’” Table 1 shows the probabilities of aversive events, p(E), the conditional probabilities of aggressive reactions to those events, p(R|E), and the corresponding frequencies. The probabilities of aversive events are obtained by dividing the number of aversive events per phase by the total number of vignettes per phase (32). Conditional probabilities of aggressive reactions are obtained by dividing the number of aggressive behaviors to aversive events by the number of aversive events encountered. The overall probability or “base rate” of aggressive behaviors, p(R) is obtained by p(E)*p(R|E); this is equivalent to the number of aggressive behaviors per phase divided by the total number of vignettes per phase. The converging E+/R+ and E−/R− targets showed increases (or decreases) both in aversive events and in aggressive reactions to them, and therefore their base rates of aggression increased (or decreased) over phases. The diverging E−/R+ and E+/R− targets (rows 2 - 3) differed in the condi- tional probability of their aggressive reactions to aversive events, but had equal base rates of aggression at each phase. Dependent Measures Open-Ended Descriptions. Participants read, “You’ve just Table 1. Properties of the four experimental targets for all studies. Phase 1 Phase 2 Condition p(E) p(R|E) p(R) p(E) p(R|E) p(R) E−/R− .75 .75 .56 .25 .25 .06 (24/32)(18/24)(18/32) (8/32) (2/8) (2/32) E−/R+ .75 .25 .19 .25 .75 .19 (24/32)(6/24)(6/32) (8/32) (6/8) (6/32) E+/R− .25 .75 .19 .75 .25 .19 (8/32)(6/8) (6/32) (24/32) (6/24)(6/32) E+/R+ .25 .25 .06 .75 .75 .56 (8/32)(2/8) (2/32) (24/32) (18/24)(18/32) Note: p(E) = probability of aversive event; p(R|E) = probability of aggressive reaction to aversive event; p(R) = base-rate probability of aggressive behavior. Note that p(R) = p(E) p(R|E). “+” indicates increase; “−” indicates decrease in event or reaction rate. E = event; R = reaction. Values in parentheses indicate frequencies on which probabilities and conditional probabilities were based; for p(E) and p(R), the denominator is always the total number of vignettes per phase (32), and for p(R|E), the denominator is the number of aversive events per phase. read about Dan during the first week of June (second week of August) in the residential summer program. Please describe in a few sentences what was most important about Dan and the summer program during that time.” Teacher Report Form. As in Wright et al. (2001), we used a subset of the 118 items from the 1993 version of the TRF (Achenbach, 1993) to avoid fatigue. Specifically, we used the scale that was most relevant to this study (aggression, 25 items) and a contrast scale (withdrawal, 9 items), with “school” changed to “camp” for our stimuli. An example of an aggres- sion item is “argues a lot”; an example of a withdrawal item is “unhappy, sad, or depressed.” Items were rated using the TRF’s 0 - 2 scale. Test-retest reliability of the TRF aggression and withdrawal scales in field studies is reported to be .89 and .85 respectively when the interval is 2 - 3 weeks (Achenbach, Howell, McConaughy, & Stanger, 1995). The TRF aggression scale correlates modestly but significantly with classroom ob- servations of verbal aggression and disruptive behavior (Henry, 2006). Perceived Overall Change. Participants rated changes in Dan’s “overall behavior”, “behavior toward peers”, and “be- havior toward counselors”. These were averaged into an “over- all target change” scale (α = .96). Next, they rated how peers’ and adults’ overall “behaviors towards Dan changed.” These were averaged into an “overall social environment change” scale (α = .96). All items used a 7-point scale (1 = much worse, 7 = much improved). Behavior, Event, and Reaction Measures. To clarify whether participants detected overall behavior rates, event rates, and reaction rates at each phase, these items corresponded as closely as possible to the stimuli. Participants first rated the overall frequency of the target’s aggressive and prosocial be- haviors shown during Phase 1 using 4 items (e.g., “Dan argued or quarreled”, “talked politely/made friendly requests”). They then rated how often Dan encountered aversive and non-aver- sive events at Phase 1, using 4 items (e.g., “peers teased, threa- Copyright © 2013 SciRes. 3 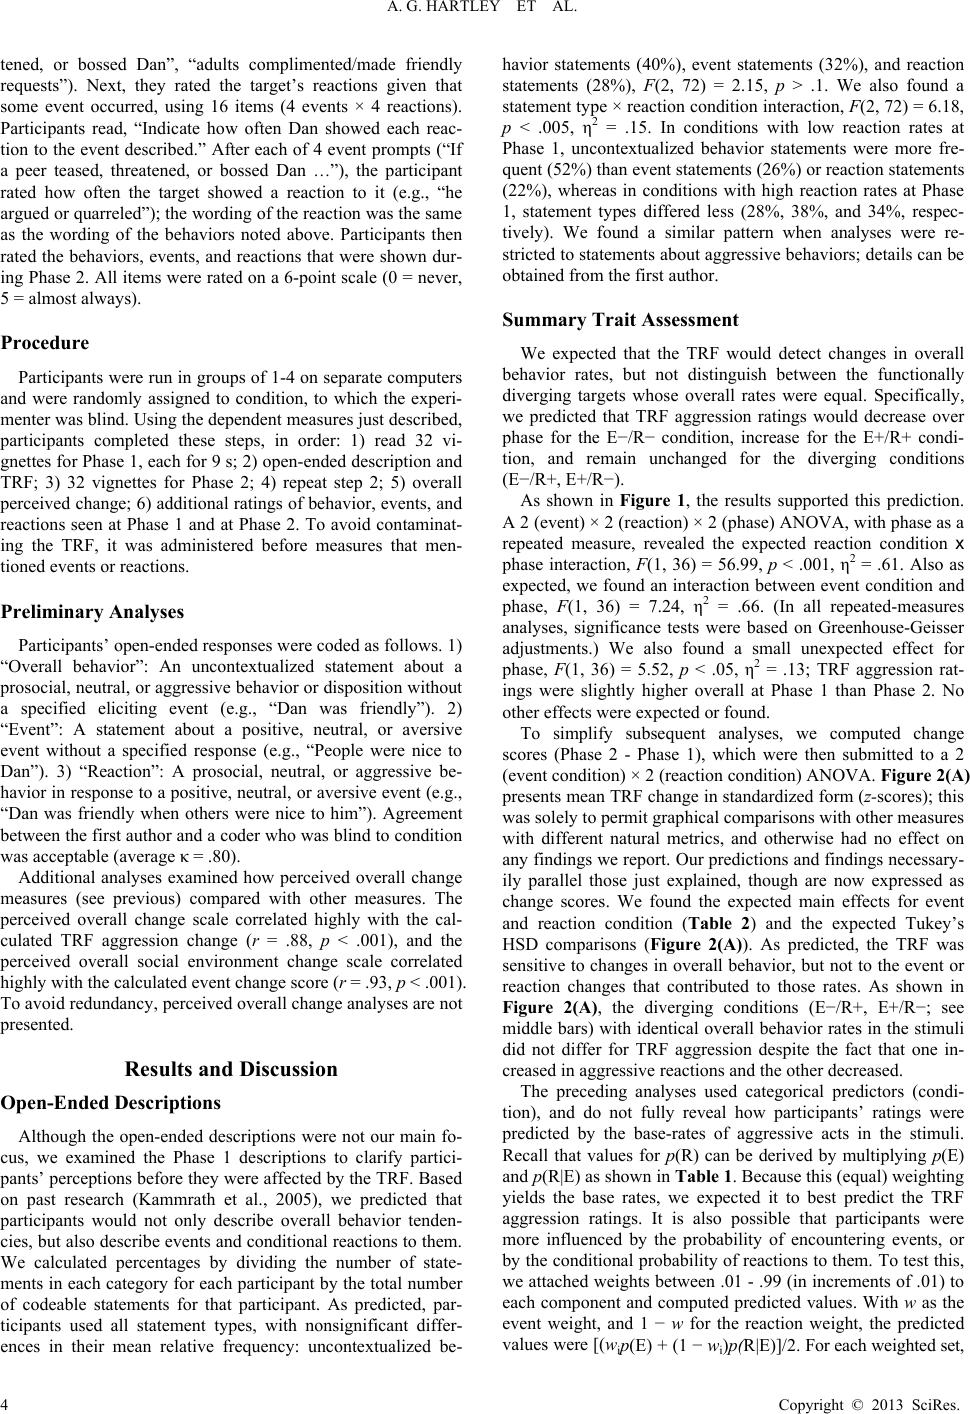 A. G. HARTLEY ET AL. tened, or bossed Dan”, “adults complimented/made friendly requests”). Next, they rated the target’s reactions given that some event occurred, using 16 items (4 events × 4 reactions). Participants read, “Indicate how often Dan showed each reac- tion to the event described.” After each of 4 event prompts (“If a peer teased, threatened, or bossed Dan …”), the participant rated how often the target showed a reaction to it (e.g., “he argued or quarreled”); the wording of the reaction was the same as the wording of the behaviors noted above. Participants then rated the behaviors, events, and reactions that were shown dur- ing Phase 2. All items were rated on a 6-point scale (0 = never, 5 = almost always). Procedure Participants were run in groups of 1-4 on separate computers and were randomly assigned to condition, to which the experi- menter was blind. Using the dependent measures just described, participants completed these steps, in order: 1) read 32 vi- gnettes for Phase 1, each for 9 s; 2) open-ended description and TRF; 3) 32 vignettes for Phase 2; 4) repeat step 2; 5) overall perceived change; 6) additional ratings of behavior, events, and reactions seen at Phase 1 and at Phase 2. To avoid contaminat- ing the TRF, it was administered before measures that men- tioned events or reactions. Preliminary Analyses Participants’ open-ended responses were coded as follows. 1) “Overall behavior”: An uncontextualized statement about a prosocial, neutral, or aggressive behavior or disposition without a specified eliciting event (e.g., “Dan was friendly”). 2) “Event”: A statement about a positive, neutral, or aversive event without a specified response (e.g., “People were nice to Dan”). 3) “Reaction”: A prosocial, neutral, or aggressive be- havior in response to a positive, neutral, or aversive event (e.g., “Dan was friendly when others were nice to him”). Agreement between the first author and a coder who was blind to condition was acceptable (average κ = .80). Additional analyses examined how perceived overall change measures (see previous) compared with other measures. The perceived overall change scale correlated highly with the cal- culated TRF aggression change (r = .88, p < .001), and the perceived overall social environment change scale correlated highly with the calculated event change score (r = .93, p < .001). To avoid redundancy, perceived overall change analyses are not presented. Results and Discussion Open-Ended Descriptions Although the open-ended descriptions were not our main fo- cus, we examined the Phase 1 descriptions to clarify partici- pants’ perceptions before they were affected by the TRF. Based on past research (Kammrath et al., 2005), we predicted that participants would not only describe overall behavior tenden- cies, but also describe events and conditional reactions to them. We calculated percentages by dividing the number of state- ments in each category for each participant by the total number of codeable statements for that participant. As predicted, par- ticipants used all statement types, with nonsignificant differ- ences in their mean relative frequency: uncontextualized be- havior statements (40%), event statements (32%), and reaction statements (28%), F(2, 72) = 2.15, p > .1. We also found a statement type × reaction condition interaction, F(2, 72) = 6.18, p < .005, η2 = .15. In conditions with low reaction rates at Phase 1, uncontextualized behavior statements were more fre- quent (52%) than event statements (26%) or reaction statements (22%), whereas in conditions with high reaction rates at Phase 1, statement types differed less (28%, 38%, and 34%, respec- tively). We found a similar pattern when analyses were re- stricted to statements about aggressive behaviors; details can be obtained from the first author. Summary Trait Assessment We expected that the TRF would detect changes in overall behavior rates, but not distinguish between the functionally diverging targets whose overall rates were equal. Specifically, we predicted that TRF aggression ratings would decrease over phase for the E−/R− condition, increase for the E+/R+ condi- tion, and remain unchanged for the diverging conditions (E−/R+, E+/R−). As shown in Figure 1, the results supported this prediction. A 2 (event) × 2 (reaction) × 2 (phase) ANOVA, with phase as a repeated measure, revealed the expected reaction condition x phase interaction, F(1, 36) = 56.99, p < .001, η2 = .61. Also as expected, we found an interaction between event condition and phase, F(1, 36) = 7.24, η2 = .66. (In all repeated-measures analyses, significance tests were based on Greenhouse-Geisser adjustments.) We also found a small unexpected effect for phase, F(1, 36) = 5.52, p < .05, η2 = .13; TRF aggression rat- ings were slightly higher overall at Phase 1 than Phase 2. No other effects were expected or found. To simplify subsequent analyses, we computed change scores (Phase 2 - Phase 1), which were then submitted to a 2 (event condition) × 2 (reaction condition) ANOVA. Figure 2(A) presents mean TRF change in standardized form (z-scores); this was solely to permit graphical comparisons with other measures with different natural metrics, and otherwise had no effect on any findings we report. Our predictions and findings necessary- ily parallel those just explained, though are now expressed as change scores. We found the expected main effects for event and reaction condition (Table 2) and the expected Tukey’s HSD comparisons (Figure 2(A)). As predicted, the TRF was sensitive to changes in overall behavior, but not to the event or reaction changes that contributed to those rates. As shown in Figure 2(A), the diverging conditions (E−/R+, E+/R−; see middle bars) with identical overall behavior rates in the stimuli did not differ for TRF aggression despite the fact that one in- creased in aggressive reactions and the other decreased. The preceding analyses used categorical predictors (condi- tion), and do not fully reveal how participants’ ratings were predicted by the base-rates of aggressive acts in the stimuli. Recall that values for p(R) can be derived by multiplying p(E) and p(R|E) as shown in Table 1. Because this (equal) weighting yields the base rates, we expected it to best predict the TRF aggression ratings. It is also possible that participants were more influenced by the probability of encountering events, or by the conditional probability of reactions to them. To test this, we attached weights between .01 - .99 (in increments of .01) to each component and computed predicted values. With w as the event weight, and 1 − w for the reaction weight, the predicted values were [(wip(E) + (1 − wi)p(R|E)]/2. For each weighted set, Copyright © 2013 SciRes. 4  A. G. HARTLEY ET AL. Copyright © 2013 SciRes. 5 Phase Mean TRF 12 0102030 E- R- * E- R+ E+ R- E+ R+ * Table 2. F-tests and effect sizes for ANOVAs of Teacher Report Form (TRF) ratings, event judgments, and reaction judgments, for Studies 1-2ab. TRF Event Reaction Study Source F η2 F η2 F η2 1 Reaction 56.99 .61 10.77 .23 126.54.78 Event 70.24 .66 137.38 .79 42.42.54 R × E .32 .01 1.56 .04 1.85 .05 2a Reaction 40.90 .53 12.46 .26 92.89.72 Event 47.02 .57 154.74 .81 25.85.42 R × E 2.39 .06 8.17 .19 1.19 .03 2b Reaction 90.75 .72 8.87 .20 50.78.59 Event 94.78 .73 45.25 .56 .95 .02 R × E .03 .00 .02 .00 .08 .00Figure 1. Mean Teacher Report Form (TRF) aggression ratings by phase, for Study 1. Experimental conditions are shown next to each line. Error bars indicate +/− 1 SEM. Asterisks indicate significant differences across phase (ps < .001). Note: R × E = Reaction × Event interaction. Degrees of freedom were (1, 36) for all studies. All F’s > 7.40 (12.83) were significant at p < .01 (.001); all other F’s shown were p > .05. -1.5 -1.0-0.50.00.51.01.5 (A) TRF Means Mean Difference (z) -R- +R- -R+ +R+ ab bc St udy 1St udy 2aSt udy 2b -R- +R- -R+ +R+ abb c -R- +R- -R+ +R+ ab bc -1.5 -1.0-0.50.00.51.01.5 (B) Event Means -R- +R- -R+ +R+ aa bc St udy 1St udy 2aSt udy 2b -R- +R- -R+ +R+ aa bc -R- +R- -R+ +R+ aab bc cd -1.5 -1.0-0.50.00.51.01.5 (C) Reaction Means -R- +R- -R+ +R+ a b c d St udy 1St udy 2aSt udy 2b -R- +R- -R+ +R+ a b c d -R- +R- -R+ +R+ a b a b (D) TRF R-Square W eight ed Cues R- Squared 00.2 0.40.60.8 1.0 00.2 0.4 0.60.8 1.0 S1 S2a S2b AF (E) Event R-Square W eight ed C ues 00.2 0.40.60.8 1.0 00.2 0.40.6 0.8 1.0 S1 S2a S2b EV (F) Reaction R-Sq uar e W eight ed C ues 00.2 0.40.60.8 1.0 00.2 0.4 0.6 0.8 1.0 S1 S2a S2b RE Figure 2. Results for Teacher Report Form (TRF), event, and reaction measures for Studies 1 (S1), 2a (S2a), and 2b (S2b). Top row (panels A-C) shows mean change scores for each measure (standardized within study). Experimental conditions are on the abscissa. Bars within a panel that do not share a subscript (a)-(d) are significantly different based on Tukey’s HSD. Error bars indicate +/− 1 SEM. Bottom row (panels (D)-(F)) shows cue weight analysis results for TRF, event, and reaction judgments, respectively. A “weighted cue” value of 0 on the abscissa represents a full weighting of events; 1 represents a full weighting of reactions. The ordinate shows the R2 values for predictions of participants’ ratings for phases 1 and 2 combined. Dotted lines indicate hypothetical perfect sensitivity to act-frequencies (AF); events (EV), and reactions (RE).  A. G. HARTLEY ET AL. we computed scores from these values, used them to predict participants’ deviation from their mean TRF aggression rating over the two phases, and computed R2. If participants showed perfect sensitivity to the base rate of aggression, a peak R2 of 1.0 would occur at equal weighting of events and reactions (.50 on the abscissa; see line “AF” in Figure 2(D)). Perfect sensitiv- ity to events is shown by line “EV” in Figure 2(E); perfect sensitivity to reactions is shown by line “RE” in Figure 2(F). As expected, results for the TRF resembled the theoretically perfect AF curve in Figure 2(D) (see “S1” for Study 1), and were best modeled (R2 = .81) when event rates (.55) and reac- tion rates (.45) were nearly equally weighted. Event Judgments We examined participants’ judgments of events using the same method as for the TRF. We predicted that event judg- ments would show increases in the E+ conditions and decreases in the E− conditions. As expected, the largest effect was the main effect for event condition (Table 2), with judged event change higher on average for the E+ conditions and pairwise comparisons showing discrimination between the functionally diverging conditions (Figure 2(B)). We also found a smaller, unexpected main effect for reaction condition, with judged event change higher on average for R+ conditions. As shown in Figure 2(B), the mean change for the E+/R− condition, though in the expected direction, was lower than one would expect if participants’ event ratings were influenced only by events. As shown in Figure 2(E), results for participants’ event judgments resembled the theoretical results (see line “EV”) and were best modeled (R2 = .80) when the weight was high for event rates (w = .78) and low for reaction rates (.22). Reaction Ju dgments Parallel analyses were performed for judgments of aggres- sive reactions to aversive events. We expected participants to be sensitive to changes in target’s reaction rates and for their ratings to increase in the R+ conditions and decrease in the R− conditions. As expected, the largest effect was the main effect for reaction condition (see Table 2), with pairwise comparisons showing discrimination between the diverging conditions (Fig- ure 2(C)). However, we also found a main effect for event condition; the marginal mean was higher for E+ conditions. As shown in Figure 2(C), the mean changes for the diverging conditions (E−/R+, E+/R−), were not as large as one would expect if reaction ratings were influenced only by reaction rates. As shown in Figure 2(F), reaction ratings were best modeled (R2 = .82) when the weights were less extreme (w = .63 for reactions, .37 for events) than was found for event judgments. Compared to the results for event judgments, these results do not correspond as closely to the theoretically perfect results (see line “RE”). Summary As expected, the TRF aggression scale was sensitive to changes in the overall rate of targets’ aggression. It did not detect differences between targets whose base rates were un- changed, even though one of them increased in aggressive reac- tions and the other decreased. Although participants focused on targets encountered events and their conditional reactions to those events when context-sensitive measures were used. This occurred even though they provided these judgments at the end of the experiment, when memory demands were high. Partici- pants’ reaction judgments were influenced more than antici- pated by how often the targets encountered relevant events. act frequencies when using the TRF, they detected how often Studies 2a-b One interpretation oftive difficulty judging re Method Participants. For Studynts (23 W, 17 M, Mage = 21 Studies 2a-b, stimuli were ne 1993 TRF to determine if the fi mat (see Study 1, Method) into a frequency-count format. Par- participants’ rela action rates is that the changes they observed violated their expectations about the stability of behavior over time. For ex- ample, some studies suggest that temporal stability is high rela- tive to the cross-situational consistency of behavior (Fleeson, 2001), and that people over-rely on the former when making judgments about personality (Mischel & Peake, 1982). Study 2a therefore examined whether participants’ judgments would be more sensitive to reaction changes when targets’ behavior varied across settings (i.e., classrooms) rather than over time as in Study 1. A second interpretation is that judging reactions to events is more complex than judging overall behavior rates or event rates. Past research demonstrates that people have diffi- culty interpreting conditional probabilities (Fox & Levav, 2004) and that formally equivalent tasks may be easier when they are presented in a frequency-count format (Gigerenzer, 2008). To address these questions, Study 2b reformatted the event and reaction dependent measures into a frequency-count format and asked participants to provide separate estimates of how often events and relevant reactions to those events occurred. 2a, 40 stude .22 years, SD = 3.50) participated, and for Study 2b, 40 (21 W, 19 M, Mage = 22.92 years, SD = 3.82) participated. Partici- pants in both studies were recruited from the Brown University community through flyers advertising a “psychology study” and were paid $8 for volunteering. Materials and procedure. For arly identical to those in Study 1, but minor revisions were made to describe cross-situational change rather than temporal change. Whereas Study 1 described the target’s behavior at two distinct points in time (June and August) Studies 2a-b described the target’s behavior in two classroom settings (art and music). Otherwise, the specific events and reactions described were the same as those used in Study 1. Study 1 used items from the ndings from Wright et al.’s (2001) study of behavior at a sin- gle time point extended to behavior change. Study 2a-b used items from the 2001 TRF to determine if our results generalize to the more recent version of the instrument. The aggression scales in the two versions are similar, with 19 of the 20 items in the 2001 version also appearing in the 1993 version (see Achenbach & Rescorla, 2001). The remaining dependent mea- sures in Study 2a were identical to those used in Study 1, with minor word changes to ask about cross-situational change. For example, when participants were asked about the target’s be- havior at Phase 1, the word “June” was changed to “art class”; likewise for Phase 2, “August” was changed to “music class.” Study 2b was identical to Study 2a, except that the behavior, event, and reaction measures were changed from a rating for- Copyright © 2013 SciRes. 6  A. G. HARTLEY ET AL. ticipants were first asked to report the overall frequency of the target’s behaviors, or n(R), at Phase 1 and Phase 2. The pro- gram required that participants’ answers be between 0 - 32. The same format was used for event judgments, n(E). Using the n(E) estimate provided, the reaction prompt read, “You reported that peers teased Dan [n(E)] times. Out of those [n(E)] times, how many times did Dan respond by arguing or quarreling?”; we refer to this as n(R ∩ E), where ∩ = the intersection of reac- tions and events. Answers were required to be between 0 and n(E) previously estimated. We computed the conditional prob- ability of a reaction given an event (“computed reaction”) as, p(R|E) = n(R ∩ E)/n(E). Results and Discussion As predicted, Studies 2a and 2b were similar pported the hy- po es in events. The ex- pe d, as was the now familiar, smaller main ef reaction change, we expected the fr tional pr gressive acts, and did no dy 3 One might argue that o for the child assessment method (TRF) do not aply-used adult personality m Method Thirty-nine undergradu6 M, Mage = 19.21 years, SD = 1.10) from an introdhology pool participated. St the results for TRF ratings for to those in Study 1 and again su thesis that the TRF would be sensitive to overall behavior rates, and not detect changes in diverging targets. The main effects (Table 2), pairwise comparisons (Figure 2(A)), and cue weighting analyses (Figure 2(D)) were similar to those for Study 1. As expected, TRF ratings for Studies 2a-b were best predicted (R2 = .77 and .82, respectively) when weights for events (w = .50) and reactions (.50) were equal, as would occur for ideal act frequency sensitivity. The results for Study 2a again supported the hypothesis that participants would be sensitive to chang cted main effect for event condition was obtained, as was a smaller effect for reaction condition (Table 2). As expected, participants detected the difference between the events rates for the E+/R− and E−/R+ targets, but again they were also some- what affected by reaction rates. Participants’ event ratings (Figure 2(E)) were best predicted (R2 = .83) when the weight was high for events rates (w = .75) and low for reaction rates (.25), as expected. For reaction judgments, the expected main effect for reaction condition was foun fect for event condition (Table 2). Change for the diverging conditions (E−/R+, E+/R−) was differentiated (Figure 2(C)), but less clearly than one would expect if reaction ratings were solely influenced by reaction rates. Reaction judgments (Figure 2(F)) were best predicted (r = .78) when the weight was higher for reaction rates (w = .64) than for event rates (.36). Thus, the results essentially replicated those in Study 1; the cross-setting format of Study 2a did not measurably affect participants’ sen- sitivity to reaction change. Although the cross-setting format did not seem to increase participants’ sensitivity to equency-count format used in Study 2b to increase partici- pants’ sensitivity to event rates and reaction rates by decoupling the conditional probability format of the reaction rating task. For event judgments, we found the expected main effect for event condition (Table 2), and change scores for the diverging conditions (E−/R+, E+/R−) were in the expected direction (Figure 2(B)). However, mean change was less extreme than expected for both diverging conditions (E+/R−; E−/R+), and participants demonstrated slightly less sensitivity to events using this response format. Compared to Studies 1-2a, event judgments were predicted (R2 = .60) by a weighted combination of events (w = .65) and reactions (.35) (see Figure 2(E)). In contrast, the frequency-count format did increase partici- pants’ sensitivity to reaction change. The computed condi obabilities were uniquely influenced by the actual conditional probabilities of targets’ reactions (Table 2). As shown in Fig- ure 2(C), the means for the diverging conditions (E−/R+, E+/R−) were different and now comparable to the converging conditions with corresponding reaction change (E+/R+, E−/R−). The cue weight analysis (Figure 2(F)) showed that the reaction measure was best predicted when the reaction weight was rela- tively high (w = .88) and the event weight was low (.12). How- ever, Figure 2(F) also reveals that the means in the converging conditions were less extreme and the reaction measures more variable (i.e., standard errors larger) than in previous studies, resulting in a lower peak R2 value (.59). Summary. As in Study 1, in Studies 2a-b, TRF ratings were predicted by the actual base-rates of ag t distinguish between targets who showed equal overall change, but opposite changes in aggressive reactions. As in Study 1, participants’ event judgments were sensitive to actual event rates, though they were somewhat influenced by reaction rates. For Study 2b, event judgments were influenced by actual event rates, but were noisier when the frequency-count format was used. In contrast, the frequency-count format in Study 2b improved participants’ sensitivity to reaction change: Condi- tional probabilities derived from participants’ frequency esti- mates were influenced solely by changes in the conditional probabilities of targets’ reactions. These results indicate that people can assess change in reactions but have some difficulty under the conditions we created, and improve when the fre- quency-count format is used. Stu ur findings ply to wide easures (e.g., NEO-FFI; Costa & McCrae, 1992). As we have noted, some researchers have argued that five-factor measures may emphasize behavior frequencies less and allow observers to give greater weight to targets’ conditional reactions (see Wood & Roberts, 2006) and therefore detect reaction patterns (Denissen & Penke, 2008). If so, the FFI could distinguish be- tween our functionally diverging, but act-frequency equivalent targets. We suggest, however, that the majority of the FFI’s items are act frequency in nature, and we therefore predicted that the FFI, like the TRF, would be primarily affected by changes in the frequency of targets’ trait-relevant behaviors. Study 3 therefore focused on the FFI domain of agreeableness and created stimuli that were structurally identical to those used in Studies 1-2ab, but described a college student showing (dis)agreeable reactions to (non)aversive events. Although agreeableness (A) was the main interest, all domains were ana- lyzed. We expected other domains that were relevant to our stimuli—extraversion (E) and neuroticism (N)—to behave si- milarly to agreeableness, and not distinguish between function- ally diverging targets. We made no predictions for openness (O) and conscientiousness (C), as these behaviors were not the fo- cus of the study. ates (23 W, 1 uctory psyc imuli had the same event and reaction rates as in Study 1, but described a 19-year-old sophomore, and focused on agreeable- Copyright © 2013 SciRes. 7  A. G. HARTLEY ET AL. Copyright © 2013 SciRes. 8 imarily sensitive to changes in act re 3(A), the three traits most re eral Discussion This research usch to examine the perception and ase. Three main fi ness. Because the target was an adult, interactions involved pants were sensitive to changes in the social events the target encountered. Third, participants were sensitive, but somewhat less so, to the conditional probability of targets’ reactions to those events when explicitly asked to assess them. These results support the view that popular child and adult summary meas- ures assess overall behaviors rather than reactions. They also demonstrate that such measures can show stability even when changes occur in people’s reactions to events, and illustrate how people’s perceptions of change may diverge from conclu- sions based on their own summary trait ratings. only peers (rather than peers and adults). An example of an aversive event paired with a disagreeable reaction is: “Dan’s lab partner says, ‘I don’t want to do the analyses in the way we agreed.’ Dan replies, ‘Tough. We’re doing it my way and I’m not changing my mind.’” The dependent measure was the 60- item NEO-FFI (Costa & McCrae, 1992). Results and Discussion FFI scale scores were pr frequencies. As shown in Figu We have noted that people might “implicitly contextualize” items on child behavior checklists and adult personality invent- tories, even though most items in such measures do not explic- itly identify the context in which a behavior may occur (see Denissen & Penke, 2008; Tellegen, 1991; Wood & Roberts, 2006). In this view, the rater infers the situations that are most relevant and focuses on the target’s conditional responses to those situations. We predicted, however, that these measures would primarily assess overall behaviors and show little sensi- tivity to people’s reaction patterns. Our results supported this prediction and provided little evidence of implicit contextuali- zation for either of the measures we studied. The aggression scale on the child measure (TRF) distinguished between the targets based on their overall behavior frequencies. However, it did not distinguish between targets who showed opposite pat- terns of change in their social environments and how they re- acted to them. Likewise, domain scores on the adult measure (FFI) also appeared to be primarily sensitive to overall behavior and did not distinguish between changes that originated in the environment versus those that originated in the target’s reac- tions. levant to the experiment (A, E, N) showed results that were similar to those for the TRF in Studies 1 and 2. There were main effects for reaction condition, F’s(1, 35) > 2.56, ps < .001, η2’s = .37 (N), .54 (E), and .74 (A), main effects for event con- dition F’s(1, 35) > 39.36, ps < .001, η2’s = .53 (N), .61 (E), .63 (A), and no significant interactions nor discrimination between functionally diverging targets. As predicted, participants’ A, E, and N ratings were best predicted by a weighted combination of events (.45, .54, .59, respectively) and reactions (.55, .46, .41) (Figure 3(B)), which were all similar to the ideal act frequency result. For O, there was a main effect for reaction condition, F(1, 35) = 19.86, p < .001, η2 = .36, and for C a main effect for event condition, F(1, 35) = 15.01, p < .001, η2 = .3. Although the R2 values for O and C were lower than for the other traits, O ratings were better predicted by reactions (.61) than by events (.39), whereas the C ratings were better predicted by events (.75) than by reactions (.25). Gen The summary instruments we examined were built on the assumption that personality is stable and enduring, and there- fore focus on mean-level behaviors rather than situational influ- ences (see Cervone et al., 2001). In this regard, our results show that the TRF and FFI capture precisely what they were designed to capture: overall behavior. However, our results also highlight the tradeoffs associated with this emphasis on overall from changes in the social situations they encounter. Our studies ed an experimental approa sessment of behavior chang ndings emerged. First, two instruments that are widely used in child and adult assessment enabled raters to detect changes in overall behavioral tendencies, but did not enable them to dis- tinguish between targets who showed opposite changes in their trait-relevant reactions to events. Second, in both temporal (Study 1) and cross-situational paradigms (Study 2a), partici- (A) FFI Difference Scores ean erence -20-10 0+1 0+20 E-R- E+R- E-R+ E+R+ a b b c AgreeableExtravertedNeurotic(R)Openness Conscientious E-R- E+R- E-R+ E+R+ ab bc E-R- E+R- E-R+ E+R+ ab bc c E-R- E+R- E-R+ E+R+ a b ab bc E-R- E+R- E-R+ E+R+ aab bb 0.0 0.2 0.4 0.60.8 1.0 (B) FFI R-Squ are R-Squared W eight ed C ues AF A E O N .00.25 .50.75 1.0 C Figure 3. Results for NEO-FFI for Study 3. Panel A shows mean change scores for agreeableness (A), extraversion (E), neuroticism (N), openness scientiousness (C). Experimental conditions are on the abscissa. Bars within a panel that do not share a subscript (a)-(c) are (O), and con significantly different based on Tukey’s HSD. Error bars = +/− 1 SEM. Panel B shows cue weight analysis for FFI judgments for A, E, N, O, and C. AF = hypothetical perfect sensitivity to act-frequencies  A. G. HARTLEY ET AL. als is an- response- bility of the authors and does not necessarily represent the offi- cial views of the tal Health or the Nationa Vermont. Achenbach, T. M., Howell, C. T., McConaughy, S. H., & Stanger, C. (1995). Six-year predational sample of chil- dren and youth: I. Crs. Journal of the Ame- o illustrate how summary measures could show that behavior stable over time or across settings even when an individual ws clear changes in how they respond to social stim mate events and conditional reactions at Phases 1 and 2. This put the retrospective event and reaction ratings at a disadv sh uli. These findings suggest that research on change over time and across settings (see Helson, Jones, & Kwan, 2002; Terracciano et al., 2009) should not over-rely on summary trait or behavior measures, but should also incorporate measures that explicitly examine people’s reaction patterns and the make-up of their social environments. Overall, our findings from the event and reaction rating tasks indicate that, given the right assessment format, participants can report on events and r o eactions when asked. However, they also indicated that judgments about reactions, p(R|E), may be in- herently more difficult than overall frequency judgments be- cause they require the perceiver to encode how often an event occurred as well as how often a behavior co-occurred with it. We attempted to improve participants’ performance in Study 2b by decomposing the task into its two frequency components: participants first estimated the frequency of aversive events, n(E), and then estimated the frequency of aggressive acts to those events, n(R ∩ E). We then computed conditional prob- abilities from these two estimates in the usual fashion, p(R|E) = n(R ∩ E)/n(E). These derived estimates were affected uniquely by the actual conditional probabilities of targets’ reactions in the stimuli, and were not influenced by how often targets en- countered events, as found in Study 1 and 2a. A key challenge for future research is to determine the task formats that best enable people to disentangle event rates and reaction rates, but that are as simple and efficient as possible. Interpreting participants’ difficulty in judging reactions re- quires careful attention to our procedure. The reaction measure in Studies 1-2ab was administered for both Phase 1 and 2 after participants had filled out the TRFs. Completing the act fre- quency task first may have framed all subsequent measures in the experiment and may have influenced participants to think more as “act frequentists” rather than “contextualists” (see Schwarz & Oyserman, 2011; Wright et al., 2001). Findings from the open-ended assessments provide some support for this interpretation. Participants’ initial descriptions of the targets, which were provided before they were influenced by other measures at Phase 1, not only used uncontextualized behavior statements, but also used simple event statements and condi- tional if … then … statements about event-reaction links. Limitations of our studies should be noted. First, although our experimental approach answers questions about how sum- mary assessments measure change, our manipulations for the event and reaction change parameters were larger (.25/.75) than might typically be observed in natural settings. Additional laboratory studies will be needed to examine how the TRF, FFI, and other summary measures (e.g., BFI; John, Donahue, & Kentle, 1991) perform under a wider range of stimulus ma- nipulations. It will also be important to examine measures that appear to give greater emphasis to children’s reactions to events (e.g., SSRS, Gresham & Elliot, 1990) and those that also focus on features of the social environment (e.g., Fournier et al., 2008). Second, because our focus was on the TRF and FFI, other measures were either brief (e.g., open-ended descriptions) or were collected after all stimuli were shown. In contrast to other research on people’s use of contextual information (Chun et al., 2002; Wright et al., 2001), our studies required subjects to en- code multiple interactions over two phases, and only then esti- tage. However, field studies often involve even more challeng- ing conditions, in which raters’ are asked to summarize more complex social interactions over much longer time periods. Clearly, additional research will be needed to answer questions about how people use information about situations and reac- tions under a wide range of stimulus complexity and memory load conditions (see Chun et al., 2002). Overall, our findings suggest that instruments widely used to study personality change research are efficient at assessing overall behavior change, but ill-equipped to capture nuanced, context-specific dispositional and environmental change proc- esses. As a result, these measures may have difficulty revealing whether behavior change stems from changes in the person, the environment, or both. Given our findings that people are sensi- tive to changes in the environment and in people’s reactions (given the proper assessment format), it should be possible to develop measures that are more consistent with how people naturally encode behavior in context and that are better suited to assess the context-specific aspects of personality change. A major goal of future research in this area should be to deepen our understanding of the judgment processes that are engaged (or disengaged) when informants complete an assessment in- strument, and use that knowledge to help improve the quality of assessment practices in research and applied settings. Acknowledgements This research was supported in part by award number R15MH076787 and 3R15MH076787-01S1from the National Institute of Mental Health. The content is solely the National Institute of Men l Institutes of Health. We are especially grateful to David Freestone, whose programming assistance made it possi- ble to collect the data reported in Study 2b. We also thank Rus- sell Church and Elena Festa Martino for their comments on earlier versions of this work. REFERENCES Achenbach, T. M. (1993). Empirically based taxonomy: How to use syndromes and profile types derived from the CBCL/4-18, TRF, & YSR. Burlington: University of ictors of problems in a n oss-informant syndrome rican Academy of Child & Adolescent Psychiatry, 34, 336-347. Achenbach, T. M., & Rescorla, L. A. (2001). Manual for the ASEBA school-age forms & profiles. Burlington, VT: University of Vermont. doi:10.1097/00004583-199503000-00020 Cervone, D., Shadel, W. G., & Jencius, S. (2001). Social-cognitive theory of personality assessment. Personality and Social Psychology Review, 5, 33-50. doi:10.1207/S15327957PSPR0501_3 Cervone, D. (2005). Personality architecture: Within-person structures and processes. Annual Rev iew o f Psychology, 56, 423-452. doi:10.1146/annurev.psych.56.091103.070133 Chun, W. Y., Spiegel, S., & Kruglanski, A. W. (2002). Assimilative behavior identification can also be resource dependent: The uni- model perspective on personal-attribution phases. Journal of Person- ality and Social Psychology, 83, 542-555. doi:10.1037/0022-3514.83.3.542 osta Jr., P., & McCrae, R. R. (1992). NEO PI-R Professional Odessa, FL: Psychological Assessment Resources, CManual. Inc. Copyright © 2013 SciRes. 9  A. G. HARTLEY ET AL. Denissen, J. J. A., & Penke, L. (2008). Motivational individual reaction norms underlying the Five-Factor model of personality: First steps towards a theory-based conceptual framework. Journal of Research in Personality, 42, 1285-1302. doi:10.1016/j.jrp.2008.04.002 D V. R. (2007). The situation irks, M. A., Treat, T. A., & Weersing, specificity of youth responses to peer provocation. Journal of Clini- cal Child & Adolescent Psycho log y, 36, 621-628. doi:10.1080/15374410701662758 leeson, W. (2001). Toward a structure- and process-integrated view of personality: Traits as density distributions of states. Journal of Per- sonality and Social P sychology, 80, 1011-1027. F doi:10.1037/0022-3514.80.6.1011 ournier, M. A., Moskowitz, D. S., & Zuroff, D. C. (2008). Integrating dispositions, signatures, and the interpersonal dom Personality and Social P s y chology, F ain. Journal of 94, 531-545. doi:10.1037/0022-3514.94.3.531 ox, C. R., & Levav, J. (2004). Partition-edit-count: Naive extensional reasoning in judgment of conditional probability. mental Psychology: General , 133, 626- FJournal of Experi- 642. doi:10.1037/0096-3445.133.4.626 igerenzer, G. (2008). Rationality for mortals: How people cope with uncertainty. Oxford: Oxford University Press. ilbert, D. T., & Malone, P. S. (199 G G5). The correspondence bias. Psy- chological Bulletin, 1 1 7 , 21-38. doi:10.1037/0033-2909.117.1.21 resham, F. M., Cook, C. R., Collins, T., Rasethwane, K., Dart, E., Truelson, E. et al. (2010). Developing a chan havior rating scale as a progress monitor G ge-sensitive brief be- ing tool for social behavior: An example using the social skills rating system-teacher form. School Psychology Revie w, 39, 364-379. Gresham, F. M., & Elliott, S. N. (1990). Social skills rating system manual. Circle Pines: American Guidance Service. Hartley, A. G., Zakriski, A. L., Wright, J. C. (2011). Probing the depths of informant discrepancies: Contextual influences on divergence and convergence. Journal of Clinical Child & Adolescent Psychology, 40, 1-13. doi:10.1080/15374416.2011.533404 elson, R., Jones, C., & Kwan, V. S. Y. (2H002). Personality change and Social Psy- over 40 years of adulthood: Hierarchical linear modeling analyses of two longitudinal samples. Journal of Personality chology, 83, 752-766. doi:10.1037/0022-3514.83.3.752 enry, D. B. (2006). Associations between peer nominations, teacher ratings, self-reports, and observations of malicious and disruptive behavior. Assessment, 1 3, 241-252. H doi:10.1177/1073191106287668 offenaar, P. J., & Hoeksma, J. B. (2002). The structure of opposition- ality: Response dispositions and situational aspects. Journal of Psy- chology and Psychiatry and Allied Health Disciplines, 4 H 3, 375-385. pression formation. Personality Hunsinger, M., Isbell, L. M., & Clore, G. L. (2011). Sometimes happy people focus on the trees and sad people focus on the forest: Con- text-dependent effects of mood in im and Social Psychology Bulletin. John, O. P., Donahue, E. M., & Kentle, R. L. (1991). The big five in- ventory—Versions 4a and 54. Berkeley, CA: University of Califor- nia. Kammrath, L. K., Mendoza-Denton, R., & Mischel, W. (2005). Incor- porating if … then … personality signatures in person perception: Beyond the person-situation dichotomy. Journal of Personality and Social Psychology, 88, 605-618. doi:10.1037/0022-3514.88.4.605 ischel, W. (2009). From personality and assessment (1968) to per-M ch in Personality, 43, 282-290. sonality science. Journal of Resear doi:10.1016/j.jrp.2008.12.037 Mischel, W., & Peake, P. K. (1982). Beyond déjà vu in the search for cross-situational consistency. Psychological Review, 89, 730-755. doi:10.1037/0033-295X.89.6.730 s f Personality and Social Psychol- Reeder, G. D., Monroe, A. E., & Pryor, J. B. (2008). Impressions of Milgram’s obedient teachers: Situational cues inform inference about motives and traits. Journal o ogy, 95, 1-17. doi:10.1037/0022-3514.95.1.1 oss, L. (1977). The intuitive psychologist and his shortcomings: Dis- tortions in the attribution process. In L. Berkowitz (Ed.), Advances in experimental social psychology (Vol. 10). R New York: Academic S tereotypes. Journal of Personality and Social Psychology, 63, Press. challer, M. (1992). In-group favoritism and statistical reasoning in social inference: Implications for formation and maintenance of group s 61-74. doi:10.1037/0022-3514.63.1.61 chwarz, N., & Oyserman, D. (2011). Asking questions about behavior: Self reports in evaluation research. In Melvin, M., Donaldson, S., & Campbell, B. (Eds.), Social Psychology S and Evaluation. New York: S a0015072 Guildford Press. mith, E. R., & Collins, E. C. (2009). Contextualizing person percep- tion: Distributed social cognition. Psychological Review, 116, 343- 364. doi:10.1037/ tterns and their interpersonal consequen- Smith, R. E., Shoda, Y., Cumming, S. P., & Smoll, F. L. (2009). Be- havioral signatures at the ballpark: Intraindividual consistency of adults’ situation-behavior pa ces. Journal of Research in Personalit y, 43, 187-195. doi:10.1016/j.jrp.2008.12.006 ellegen, A. (1991). Personality traits: Issues of definition, evidence and assessment. In W. Grove, & D. Cicchetti (Eds.), Th about psychology: Essays in ho Tinking clearly nor of Paul Everett Meehl (pp. 10-35). T 006 Minneapolis: University of Minnesota Press. erracciano, A., McCrae, R. R., & Costa Jr., P. (2009). Intra-individual change in personality stability and age. Journal of Research in Per- sonality, 44, 31-37. doi:10.1016/j.jrp.2009.09. 14.79.3.344 Trope, Y., & Gaunt, R. (2000). Processing alternative explanations of behavior: Correction or integration? Journal of Personality and So- cial Psychology, 79, 344-354. doi:10.1037/0022-35 Vansteelandt, K., & Van Mechlen, I. (1998). Individual differences in situation-behavior profiles: A triple-typology model. Journal of Per- sonality and Social P sychology, 75, 751-765. doi:10.1037/0022-3514.75.3.751 atson, D. (2004). Stability versus change, dependability versus error: Issues in the assessment of personality over search in Personality, 38, 319-350 W time. Journal of Re- . doi:10.1016/j.jrp.2004.03.001 Wood, D., & Roberts, B. W. (2006). Cross-sectional and longitudinal tests of the personality and role identity structural model (PRISM). Journal of Personalit y, 74, 779-810. doi:10.1111/j.1467-6494.2006.00392.x right, J. C., Lindgren, K. P., & Zakriski, A. L. (2001). Syndromal versus contextualized personality asse ronmental and dispositional determinant W ssment: Differentiating envi- s of boys’ aggression. Jour- nal of Personality and Social Psychology, 81, 1176-1189. doi:10.1037/0022-3514.81.6.1176 right, J. C., & Mischel, W. (1987). A conditional approach to dispo- sitional constructs: The local predictability of social behavi nal of Personality and Social Psych W or. Jour- ology, 53, 1159-1177. doi:10.1037/0022-3514.53.6.1159 Copyright © 2013 SciRes. 10
|