Paper Menu >>
Journal Menu >>
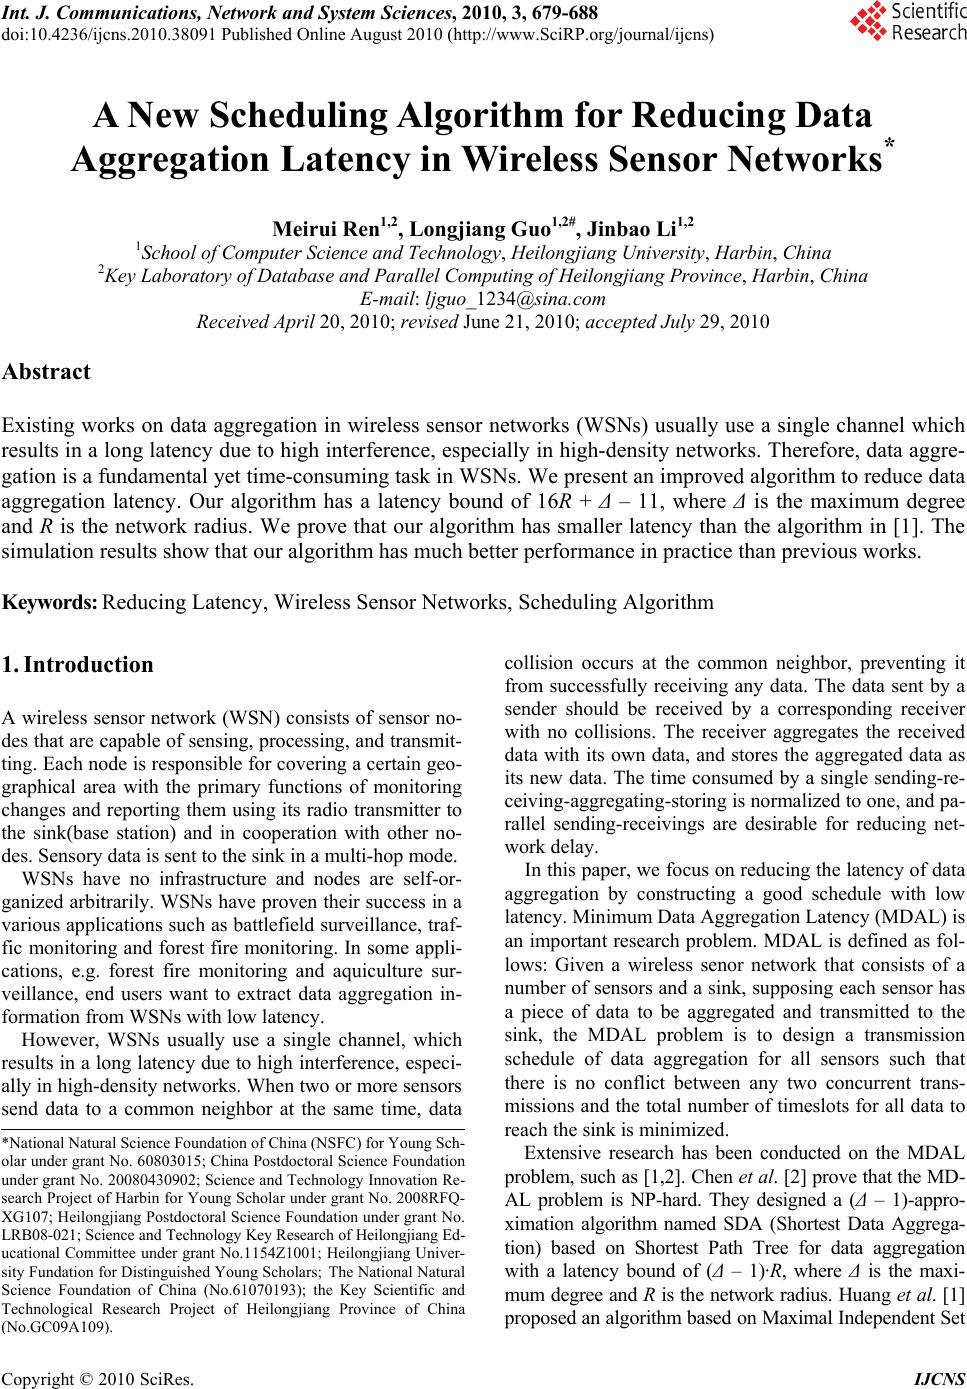 Int. J. Communications, Network and System Sciences, 2010, 3, 679-688 doi:10.4236/ijcns.2010.38091 Published Online August 2010 (http://www.SciRP.org/journal/ijcns) Copyright © 2010 SciRes. IJCNS A New Scheduling Algorithm for Reducing Data Aggregation Latency in Wireless Sensor Networks* Meirui Ren1,2, Longjiang Guo1,2#, Jinbao Li1,2 1School of Computer Science and Technology, Heilongjiang University, Harbin, China 2Key Laboratory of Database and Parallel Computing of Heilongjiang Province, Harbin, China E-mail: ljguo_1234@sina.com Received April 20, 2010; revised June 21, 2010; accepted July 29, 2010 Abstract Existing works on data aggregation in wireless sensor networks (WSNs) usually use a single channel which results in a long latency due to high interference, especially in high-density networks. Therefore, data aggre- gation is a fundamental yet time-consuming task in WSNs. We present an improved algorithm to reduce data aggregation latency. Our algorithm has a latency bound of 16R + Δ – 11, where Δ is the maximum degree and R is the network radius. We prove that our algorithm has smaller latency than the algorithm in [1]. The simulation results show that our algorithm has much better performance in practice than previous works. Keywords: Reducing Latency, Wireless Sensor Networks, Scheduling Algorithm 1. Introduction A wireless sensor network (WSN) consists of sensor no- des that are capable of sensing, processing, and transmit- ting. Each node is responsible for covering a certain geo- graphical area with the primary functions of monitoring changes and reporting them using its radio transmitter to the sink(base station) and in cooperation with other no- des. Sensory data is sent to the sink in a multi-hop mode. WSNs have no infrastructure and nodes are self-or- ganized arbitrarily. WSNs have proven their success in a various applications such as battlefield surveillance, traf- fic monitoring and forest fire monitoring. In some appli- cations, e.g. forest fire monitoring and aquiculture sur- veillance, end users want to extract data aggregation in- formation from WSNs with low latency. However, WSNs usually use a single channel, which results in a long latency due to high interference, especi- ally in high-density networks. When two or more sensors send data to a common neighbor at the same time, data collision occurs at the common neighbor, preventing it from successfully receiving any data. The data sent by a sender should be received by a corresponding receiver with no collisions. The receiver aggregates the received data with its own data, and stores the aggregated data as its new data. The time consumed by a single sending-re- ceiving-aggregating-storing is normalized to one, and pa- rallel sending-receivings are desirable for reducing net- work delay. In this paper, we focus on reducing the latency of data aggregation by constructing a good schedule with low latency. Minimum Data Aggregation Latency (MDAL) is an important research problem. MDAL is defined as fol- lows: Given a wireless senor network that consists of a number of sensors and a sink, supposing each sensor has a piece of data to be aggregated and transmitted to the sink, the MDAL problem is to design a transmission schedule of data aggregation for all sensors such that there is no conflict between any two concurrent trans- missions and the total number of timeslots for all data to reach the sink is minimized. *National Natural Science Foundation of China (NSFC) for Young Sch- olar under grant No. 60803015; China Postdoctoral Science Foundation under grant No. 20080430902; Science and Technology Innovation Re- search Project of Harbin for Young Scholar under grant No. 2008RFQ- XG107; Heilongjiang Postdoctoral Science Foundation under grant No. LRB08-021; Science and Technology Key Research of Heilongjiang Ed- ucational Committee under grant No.1154Z1001; Heilongjiang Univer- sity Fundation for Distinguished Young Scholars; The National Natural Science Foundation of China (No.61070193); the Key Scientific and Technological Research Project of Heilongjiang Province of China ( No.GC09A109 ) . Extensive research has been conducted on the MDAL problem, such as [1,2]. Chen et al. [2] prove that the MD- AL problem is NP-hard. They designed a (Δ – 1)-appro- ximation algorithm named SDA (Shortest Data Aggrega- tion) based on Shortest Path Tree for data aggregation with a latency bound of (Δ – 1)·R, where Δ is the maxi- mum degree and R is the network radius. Huang et al. [1] proposed an algorithm based on Maximal Independent Set  680 M. R. REN ET AL. which has a latency bound of 23R + Δ – 18. Here Δ con- tributes to an additive factor instead of a multiplicative one. The algorithm is a nearly constant approximation and it has a significantly less latency bound than earlier algo- rithms especially when Δ is large. In this paper, we present an algorithm relying on reducing the number of blue nodes and finding maximal non-conflicting transmission sched- ule sets which has a latency bound of 16R + Δ – 11. Our algorithm is also a nearly constant approximation and it has a significantly less latency bound than the existing best known algorithm in [1] when R is large. The remainder of this paper is organized as follows. The formalized MDAL problem and all related work are presented in Section 2. In Section 3, we propose our alg- orithm and give details of analysis on performance. In Section 4, we evaluate the average performance of the proposed algorithm through simulations and compare it with the algorithm in [1]. Section 5 concludes this paper. 2. Preliminaries In this section, we first present some assumptions and formalize the MDAL problem, and then we discuss all related work in details. 2.1. Problem Description We consider a wireless sensor network consisting of sta- tionary nodes along with one sink node distributed over an Euclidean plane. All the sensor nodes are homogene- ous. Each sensor node is equipped with a RF transceiver that can be used to send or receive data. We assume that each sensor node has omni-directional antenna and the transmission coverage of any sensor node is a circle with unit radius centered at the sensor. We assume that each sensor knows its geometric posi- tion in the network. The sink has global knowledge of all the sensors’ IDs and positions. Transmission is determin- istic and proceeds in synchronous time rounds controlled by a global clock. In each time round, any node cannot send and receive data simultaneously, i.e. any node either sends data or receives data in a round. Definition 1 [Neighbor Set] For a sensor node u, if there exists another sensor node v such that v lies in u’s transmission area, then v is called u’s neighbor. All of u’s neighbors form a set, which is called u’s Neighbor Set, denoted by Neighbor(u). Data sent by any sender simultaneously reaches all the nodes in its neighbor set. Definition 2 [Transmission Schedule] u → v is call- ed a Transmission Schedule, where u is called sender, v is called a receiver. u → v denotes that u transmits data to v. If two or more nodes are sending in the same round and there exists a node u in their overlapped transmission area, then u cannot successfully receive any data since all transmissions are interfering with each other. This situa- tion is called a collision. For example, in Figure 1(a), there are two ongoing transmission schedules u → v and x → v in the same round. v will not receive anything. In Figure 1(b), there are two ongoing transmission sched- ules u → v and x → y in the same round. v is in x’s transmission range, therefore v will not receive anything. Definition 3 [Conflicting Transmission Schedules] u → v and x → y are called Conflicting Transmission Sc- hedules if and only if v Neighbor(x) or y Neigh- bor(u). The main task of a sensor is to collect data and forw- ard aggregated data to the sink, and data can be “aggreg- ated” all the way to the sink. In other words, if a node has received one packet from its neighbor before its scheduled transmission time round, then it can merge this packet with its own data packet and simply waits to send this merged packet later. The situation where packets cannot be merged does exist, and it is called data collec- tion. In this paper we only focus on data aggregation meaning that data can be merged all the way to the sink. For simplicity, a wireless sensor network with sink node s can be represented as a graph G = (V, E), where V denotes all the sensor nodes in the network and s V, An edge (u, v) E indicates that u lies in v’s transmis- sion range and v lies in u’s transmission range. A data aggregation schedule is a sequence of transmi- ssion schedule sets {S1, S2, …, Sl}, where Si (i = 1,2,…l) is a transmission schedule set satisfying the following conditions: 1) Any two transmission schedules u → v, x → y in Si (i = 1,2,…l) are non-conflicting transmission schedules, i.e. v Neighbor(x) and y Neighbor(u). 2)i j, Sender (Si) ∩ Sender (Sj) = , where Sender (Si) denotes the sender set of transmission schedules in Si. 3) . 1 () {} l i i Sender SVs l is called the data aggregation latency. The MDAL problem is defined as follows. Given a graph G = (V, E) and the sink node s V, find a data aggregation schedule with the minimum latency. u v xu v x y (a) (b) Figure 1. Two types of collisions. Copyright © 2010 SciRes. IJCNS  M. R. REN ET AL. 681 2.2. Related Work Extensive research has been conducted on data aggrega- tion. One category of existing works focuses on how to design an energy efficient data aggregation algorithm. Th- ese works of data aggregation focus on energy efficiency. Data aggregation is also called convergecast. Convergec- ast is about a sensor network with a sink such that all se- nsor nodes collect data and report to the sink through mu- lti-hop communications. Annamalai et al. [3] designed a heuristic algorithm for both broadcast and convergecast. The convergecast tree constructed in their algorithm can be used for broadcast as well. Upadhyayula et al. [4] de- signed another heuristic algorithm for convergecast, aim- ing at reducing energy consumption and latency. These two works mentioned above both proposed heuristic app- roaches and used simulations to verify their results wit- hout giving theoretical analysis. In our work, we verified our results through both simulations and theoretical ana- lysis. Another category focuses on how to design a conflict- free scheduling. A distributed cross-layer scheduling pro- tocol for data aggregation was proposed in [5], in which each node negotiates with its parent to decide its times- lots for transmission and constructs a schedule for its qu- ery processing. Chipara et al. [6] developed a dynamic scheduling scheme supporting different kinds of aggreg- ation queries, assuming that an aggregation tree has alr- eady been constructed. Yu et al. [7] studied the energy- latency tradeoff of scheduling for data aggregation. Pract- ical issues of data aggregation, especially about the MAC layer, have also been studied in the literature. Huang and Zhang [8] studied packet loss and focused on reliability issues in data aggregation. Zhang et al. [9] addressed the issue of bursty convergecast in real-time applications. The high-volume burst traffic often arises in event-driven applications. These applications require for reliable and real-time packet delivery to the sink. The large number of packets generated within a short period leads to high degree of channel contention and thus a high probability of packet collision. Zhang et al. focused on improving channel utilization and reducing retransmission incurred by channel contention. Krishnamachari et al. [10] studied data aggregation from another aspect. They considered the case where there is a subset of nodes whose data need to be sent to the sink and regard aggregating these data as a way to save energy. Intanagonwiwat et al., in a short paper [11], evaluated the impact of greedy aggregation to increase the amount of path sharing and reduce energy consumption. All the above works aimed at minimizing the overall energy consumption of sensors subject to the latency constraint. The most relevant works of the MDAL problem are on theoretical side. Kesselman and Kowalski [12] designed a randomized, distributed algorithm with latency O(log n). In their model, it is assumed each node can vary its transmission range to reduce links. Chen et al. [2] de- signed a (Δ – 1)-approximation algorithm called SDA for data aggregation, which has a latency bound of (Δ – 1)·R, where Δ is the maximum degree of the network and R is the network radius. They also proved that the minimum data aggregation time problem is NP-hard. Huang et al. [1] designed an algorithm based on maximal independent sets which has a latency bound of 23R + Δ – 18. They reduced the data aggregation latency from a multiplica- tive factor of Δ to additive factor. Their algorithm is nearly constant and it has a significantly less latency bound than the previous algorithms when Δ is large. In this paper, we present an algorithm based on reduc- ing the number of blue nodes and maximal non-confli- cting transmission schedule sets which has a latency bound of 16R + Δ – 11. Our algorithm is also nearly con- stant and it has a significantly less latency bound than the previous algorithms. 3. Our Data Aggregation Algorithm In this section, we present our approximation algorithm. Our algorithm has a data aggregation latency of 16R + Δ – 11, where R is the network radius and Δ is the maxi- mum degree of the network. This result is better than the currently best known algorithm [1] whose latency is 23R + Δ – 18, since if Δ and R are both large, our algorithm achieves a smaller latency. Large Δ and R are frequent especially in large-scale, dense networks. The key behi- nd-the-scene ideas of our algorithm include reducing the number of blue nodes and maximal non-conflicting tra- nsmission schedule sets in data aggregation scheduling. Our algorithm has three phases: 1) Construct MIS Layer by Layer; 2) Data Aggregation Tree Construction reduc- ing the number of blue nodes; 3) Data Aggregation Sch- eduling based on maximal non-conflicting transmission schedule sets. The details of our algorithm are showed in the next fo- ur subsections. To better understand our algorithm, some examples are given in these four subsections. 3.1. Construct MIS Layer by Layer This phase is the same as [1]. For a given graph G = (V, E) and the sink node s V, a Breadth First Search Tree (BFST) rooted at s for the graph G is firstly constructed. In this phase, BFS starts at sink node s, which is the root of BFST at layer 0, then BFS explores all the neighbor- ing nodes which are added into BFST to be the children of s at layer 1. Then, the new nodes adjacent to layer 1 nodes are added into BFST at layer 2 to be the children of the nodes at layer 1, and so on. The BFS traversal ter- minates when every node in V has been visited. For ex- ample, Figure 2 shows a topology of G. Node 0 is the Copyright © 2010 SciRes. IJCNS  682 M. R. REN ET AL. sink. Each circle denotes a sensor node. Node ID lies in each circle. Figure 3 shows the BFST of G in Figure 2. The num- ber above each node denotes its layer in the BFST. L1 = {1, 2, 3, 4, 5} denotes that nodes 1, 2, 3, 4, 5 are at layer 1. Similarly, nodes 6, 7, 8, 9, 10 are at layer 2 and nodes 11, 12, 13, 14, 15, 16, 17 are at layer 3. In Figure 3 dashed lines denote the edges in G, but they are not in BFST of G. Algorithm 1 Construct MIS layer by layer Input: G = (V, E) and a sink node s V Output: Sequence of MISs BLACK = {BLACK0,…, BLACKl} and BFST BT. 1) Convert G = (V, E) into a BFST BT 2) Divide V into layers L0, L1, L2, …, Ll 3) BLACK0{s} 4) BLACK{BLACK0} 5) FOR i1 to l DO 6) Find an MIS BLACKi Li such that BLACKi is independent of BLACK0, BLACK1,…, BLACKi - 1. 7) BLACK BLACK∪{BLACKi} 8) ENDFOR 9) RETURN BLACK and BT Based on BFST, all nodes are divided into layers L0, L1, L2, …, Ll. We then form a Maximal Independent Set (MIS) layer by layer. This procedure begins from layer 0. On layer 0, there is only one node, the sink node s, s for- ms an MIS BLACK0 = {s}, which is marked as black. We then move on to layer 1 and construct an MIS BLACK1 and mark these nodes black again. Note that BLACKi must be independent of the MISs from layer 0 to layer i-1. This process is repeated until all the layers have been processed. The nodes which are not marked black are ma- rked white at last. The pseudocode of layered MIS con- struction is given in Algorithm 1 [1]. Figure 4 shows an example which constructs an MIS based on BFST in Figure 3. 11 1 10 0 13 8 5 3 7 2 14 12 6 15 4 9 16 17 Figure 2. Topology of G. Figure 3. BFST of G. Figure 4. Construct MIS layer by layer. 3.2. Data Aggregation Tree Construction The data aggregation tree construction has two phases: 1) Find a sequence of blue node sets {BLU E1, BLUE2, …, BLUEl − 1} that connect black nodes layer by layer, where the blue nodes in BLUEi interconnect black nodes in BL- ACKi – 1 and BLACKi + 1, at the same time, we also cons- truct a data aggregation tree DT; 2) Reduce the number of blue nodes layer by layer, meanwhile, we obtain an optimized data aggregation tree. The first phase is similar with the algorithm in [1]. The second phase is an optim- ized procedure which can reduce data aggregation laten- cy. Through the second phase some blue nodes are conv- erted into white leaves. The latency of data aggregation is reduced from 23R + ∆ – 18 to 16R + Δ – 11. The de- tails of analysis will be presented in Subsection 3.4. In the first phase, we find a sequence of blue node sets {BLUE1, BLUE2, …, BLUEl − 1} that interconnect black nodes layer by layer. To find blue node set BLUE1, we look at BLACK2. Each black node in BLACK2 has a par- ent in BFST BT and this parent must be white since black nodes are independent of each other. These white nodes Copyright © 2010 SciRes. IJCNS  M. R. REN ET AL. 683 are colored blue and an edge between black node and its white parent is added into data aggregation tree DT. Mo- reover, the blue node must be connected with the black node s in BLACK0. The edge between the blue node and the black node s is added into DT. Note that to find blue node set BLUEi, we color the parent of each black node in BLACKi + 1 blue. The blue node must be connected with the black node in BLACKi or BLACKi – 1. This proc- ess is repeated layer by layer and finally a sequence of blue node sets BLUE = {BLUE1, BLUE2, …, BLUEl – 1} and a desired data aggregation tree DT are both obtained. The pseudo code is presented in Algorithm 2. Figure 5 shows an example of finding a sequence of blue node sets based on the MIS in Figure 4. In the second phase, we reduce the number of blue no- des layer by layer and get an optimized data aggregation tree. The purpose of reducing the number of blue nodes is to reduce data aggregation latency. Recall the algori- thm analysis in [1], the data aggregation latency greatly depends on how many blue nodes lie inside the transmis- sion range of a black node. A small number of blue nodes results in a short data aggregation latency. Algorithm 2 Finding blue node sets Input: G = (V, E); Sink node sV; Sequence of MISs BLACK = {BLACK0, …, BLACKl}; BFST BT. Output: Sequence of blue node sets BLUE={BLUE1, BLUE2, …, BLUEl - 1} and data aggregation tree DT 1) Procedure FindBlueNodeSets(G, s, BLACK, BT) 2) DT = (VDT,EDT ); VDT V; EDT ; BLUE; 3) //Find blue node sets that connect black nodes 4) FOR i1 to l-1 DO 5) FOR each black nodes uBLACKi + 1 DO 6) Find u’s parent pBT(u) in BFST BT 7) Color pBT(u) blue 8) Add pBT(u) to BLUEi 9) Add an edge (u, pBT(u)) to EDT 10) Find a black node v which can commu- nicate with pBT(u) from BLACKi ∪BLACKi - 1 11) Add an edge (pBT(u), v) to EDT 12) ENDFOR 13) BLUE BLUE ∪BLUEi 14) ENDFOR 15) //Color remaining nodes white/ 16) FOR each remaining node u DO 17) Color u white 18) Find u’s parent pBT(u) in BFST BT 19) Add an edge (u, pBT(u)) to EDT 20) ENDFOR 21) RETURN BLUE and DT For a black node u, we only keep those blue nodes that can communicate with u’s 2-hop black neighbors. For a clear description, some concepts are given as follows. Definition 4 [Coverage and Coverage Density] For a blue node v BLUEi + 1, a subset of BLACKi + 2 Cover- age(v) BLACKi + 2, is called v’s Coverage if v can communicate with each black node in Cover ag e(v), i.e. v can Cover all black nodes in Coverage(v). The cardinal- ity of Coverage(v) is called v’s Coverage Density. For a black node u BLACKi, we only keep the blue nodes in BLUEi + 1 that can cover u’s 2-hop black neig- hbors in BLACKi + 2. The following lemma indicates that we can keep at most 13 blue nodes which can cover u’s 2-hop black neighbors in BLACKi + 2. Lemma 3.1 For a black node u BLACKi (i = 0, 1, …, l – 2), there are at most 13 blue nodes which can cover u’s 2-hop black neighbors in BLACKi + 2. Proof: For a black node u BLACKi (i = 0, 1, …, l – 2), suppose there are at least 14 blue nodes c1, c2,…,c14 which can cover u’s 2-hop black neighbors in BLACKi + 2. Assume that the transmission radius of a sensor node is 1. Consider D2u, a circular of radius 2 centered at the bl- ack node u. All u’s 2-hop black neighbors lie inside D2u. Since black nodes are mutually independent, for each bl- ack node in D2u, we consider a circular of radius 0.5 cen- tered at this black node, then all of those circulars must be disjoint. u’s blue children nodes lie inside D1u, a circ- ular of radius 1 centered at the black node u. Since we suppose there are at least 14 blue nodes c1, c2,…,c14 which can cover u’s 2-hop black neighbors, then each of u’s 2-hop black neighbors can be covered at least by one blue node of those 14 blue nodes. From u’s 2-hop black neighbors, we certainly find at least 14 bla- ck nodes b1, b2,…,b14 such that bi (i = 1,2,…,14) is cove- red only by ci (i = 1,2,…,14) and u’s other 2-hop black neighbors besides these 14 black nodes b1, b2,…,b14 are covered at least by two blue nodes. (If we can not find at least 14 black nodes b1, b2,…,b14, then there are at most 13 blue nodes which can cover u’s 2-hop black neighbors. The lemma is proved.) These 14 black nodes b1, b2,…, b14 certainly lie outside the circular D1u and inside the Figure 5. Finding blue node sets. Copyright © 2010 SciRes. IJCNS  684 M. R. REN ET AL. circular D2u centered at the black node u. (Refer to Fig- ure 6) We equably divide D2u into 13 sectors. According to the pigeonhole principle [13], there are two black nod- es at least lie inside the same sector, i.e. there are at least 2 circulars of radius 0.5 centered at black nodes lie inside the same sector. Without loss of generality, suppose bla- ck nodes b1 and b2 lie inside the same sector, and b1 is fa- rther than b2 from u. Since blue node c1 covers b1. Obvi- ously, c1 covers b2 too. (This fact can be simply validated by geometry. Refer to Figure 6.) This is contradictory to that b2 is covered only by c2, since b2 is covered by both c1 and c2. Therefore, the above assumption is false. This lemma is proved. Algorithm 3 Reducing the number of blue nodes Input: G = (V, E); Sequence of MISs BLACK; BFST BT; Sequence of blue node sets BLUE; Data aggrega- tion tree DT. Output: Reduced data aggregation tree based on DT. 1) Procedure ReduceBlueNodes (G, BLACK, BT, BLUE, DT) 2) //Reduce the number of blue nodes layer by layer 3) FOR i0 to l – 2 DO 4) NEWBLUE 5) FOR each black nodes u BLACKi DO 6) Find u’s blue children set BC(u) BLUEi + 1 7) Find u’s 2-hop black neighbors set BN(u) 8) Descending sort BC(u) on the coverage density 9) WHILE BN(u) DO 10) Get out a blue node x from BC(u) 11) BC(u)BC(u) − {x} 12) NEWBLU E NEWBLUE∪{x} 13) FOR each wCoverage(x) DO 14) Remove edge (w, pDT(w)) from EDT 15) Add edge (x, w) into EDT 16) ENDFOR 17) BN(u)BN (u) − Coverage(x) 18) ENDWHILE 19) ENDFOR 20) Color nodes in BLUEi + 1 − NEWBLUE from blue to white; 21) BLUE i + 1 NEWBLUE 22) ENDFOR 23) RETURN DT According to Lemma 3.1, we design Algorithm 3 to reduce the number of blue nodes. The idea of Algorithm 3 is based on a greedy strategy. For each black node u BLACKi, we find u’s blue children set BC(u) BLUEi + 1 and u’s 2-hop black neighbors set BN(u), then we sort BC(u) in a decreasing order on the coverage density. In the first repetition, we keep the blue node x which has the largest coverage density, and remove x from BC(u). For each w Coverage(x), we remove edge (w, p(w)) from the data aggregation tree and add edge (x, w) into the data aggregation tree. The covered black node set Coverage(x) by blue node x is removed from BN(u). This process is terminated until BN(u) is an empty set. Algo- rithm 3 is executed layer by layer. Finally, the rest blue nodes are converted from blue to white. The pseudo code is presented in Algorithm 3. For convenience, the output of Algorithm 3 is called Reduced Data Aggregation Tree. Figure 7 shows an example of reducing the number of blue nodes based on the result in Figure 5. To construct a data aggregation tree, we firstly execute Algorithm 2 to find a sequence of blue node sets {BLUE1, BLUE2, …, BLUEl − 1} that connect black nodes layer by layer and construct a data aggregation tree DT; Second, Algorithm 3 is executed to reduce the number of blue no- des layer by layer, and finally we obtain a data aggrega- tion tree. The pseudocode of the entire procedure of data aggregation tree construction is presented in Algorithm 4. Figure 6. Proof of lemma 3.1. Figure 7. Reducing the number of blue nodes. Copyright © 2010 SciRes. IJCNS  M. R. REN ET AL. 685 Algorithm 4 Data Aggregation tree construction Input: G = (V, E); Sink node sV; Sequence of maxi- mal independent sets BLACK; BFST BT . Output: A reduced data aggregation tree RDT 1) Execute FindBlueNodeSets (G, s, BLACK, BT) to obtain BLUE and DT; 2) RDTReduceBlueNodes (G, BLACK, BT, BLUE, DT); 3) RETURN RDT 3.3. Data Aggregation Scheduling In this section, we generate a data aggregation schedule based on the data aggregation tree. The process of gener- ating a data aggregation schedule is simple and it breaks the transmission rule of white nodes sending to black nodes, black nodes sending to blue nodes and blue nodes sending to black nodes. The process of data aggregation scheduling is the process of cutting leaves. The process of data aggregation scheduling takes in an input of a network topology G = (V, E) and a correspo- nding data aggregation tree DT. First, we pick a node u from the leaves of DT and generate a transmission sch- edule u → pDT(u), where pDT(u) is u’s parent in DT, then we check whether u → pDT(u) conflicts with any trans- mission schedule in the current non-conflicting transmis- sion schedule set Si (its initial value is null, i = 1,2,…). If it does not conflict with any transmission schedule in Si, then we add u → pDT(u) to Si. Otherwise, we check the next transmission schedule using a leaf of DT as the sender. Finding a maximal non-conflicting transmission schedule set based on the leaves of DT is similar with 0-1 knapsack problem and we present an approximate algor- ithm in Algorithm 5 due to it is NP-hardness. We do not prove the problem of finding a maximal non-conflicting transmission schedule set to be NP-hard due to page lim- itation. When we obtain a maximal non-conflicting trans- mission schedule set from the leaves of DT, we cut these leaves and edges associated with these leaves and their parents. This process is repeated until there is only one sink node s in DT. Algorithm 5 Data Aggregation Scheduling Input: G = (V, E); Sink sV; Data aggregation tree DT Output: Data aggregation schedule S 1) i1; S{}; 2) WHILE there exists an edge in DT DO 3) Si 4) Leaves{u| u a is leaf of DT} 5) WHILE Leaves DO 6) FOR each leaf u in Leaves DO 7) FOR each x→pDT(x)Si DO 8) IF Si= or uNeighbor(x) and pDT(x)Neighbor(u) 9) Si Si ∪{ u→pDT(u)} 10) ENDIF 11) ENDFOR 12) ENDFOR 13) ENDWHIL E 14) FOR each schedule u→pDT(u) in Si DO 15) Cut edge (u, pDT(u))from DT 16) ENDFOR 17) S S∪Si; ii + 1; 18) ENDWHILE The pseudo code of data aggregation scheduling is pre- sented in Algorithm 5. Note that in Algorithm 5, we con- sider two types of collisions discussed in Figure 1, whe- reas the transmission rule of FIRSTFIT in [1] only con- siders type (a) in Figure 1. As an example, given the reduced data aggregation tr- ee in Figure 7, the final data aggregation schedule is giv- en as follows: S1 = {11 → 10; 13 → 6; 7 → 4; 17 → 8; 5 → 0;} S2 = {12 → 10; 14 → 6; 8 → 4; 16 → 9;} S3 = {10 → 1; 15 → 6; 9 → 4;} S4 = {1 → 0; 6 → 4;} S5 = {2 → 0;} S6 = {3 → 0;} S7 = {4 → 0;}. Let L5−RDT denote the data aggregation latency of Al- gorithm 5. Then for this example we have L5−RDT = 7. Lemma 3.2 For a given data aggregation tree DT, the data aggregation latency of Algorithm 5 is no more than that of Algorithm 4 in [1]. Proof: Algorithm 4 in [1] has the aptotic transmission rule of white nodes sending to black nodes, black nodes sending to blue nodes and blue nodes sending to black no- des. Nevertheless, our Algorithm 5 does not follow this rule. Algorithm 5 picks nodes from the leaves of the data aggregation tree DT and generates transmission schedu- les. Furthermore, some black nodes are possibly leaves. For example, in Figure 7, node 7 is a black leaf. Without loss of generality, for all the leaves of DT, there are m white nodes and a black node b. According to the transmission rule of FIRSTFIT in [2], the m white nodes and the black node b are definitely in different se- nder sets Sender(Si),…, Sender(Sj − 1), Sender(Sj) (i < j) such that m white nodes are in Sender(Si),…, Sender(Sj − 1) and b is in Sender(Sj), where Si,…, Sj − 1, Sj are transmis- sion schedule sets. Moreover, according to the transmis- sion rule of Algorithm 5, m white nodes are in Sender (Si),…, Sender(Sj − 1) and either b is in Sender(Sj) if b → pDT(u) conflicts with transmission schedules in Si, …, Sj − 1 or b is in Sender(Sk) (i k j − 1) if b → pDT(u) does not conflict with transmission schedules in Si, …, Sj − 1. Thus, the data aggregation latency of Algorithm 5 is no more than that of Algorithm 4 in [1]. After cutting le- aves from the current data aggregation tree, similar proof can be applied on the residual data aggregation tree. For example, given the reduced data aggregation tree Copyright © 2010 SciRes. IJCNS  686 M. R. REN ET AL. in Figure 7, the final data aggregation schedule based on FIRSTFIT in [1] is given as follows: WHITE to BLACK S1 = {5 → 0; 11 → 10; 13 → 6; 17 → 8;} S2 = {16 → 9; 14 → 6; 12 → 10; 3 → 0;} S3 = {15 → 6;} S4 = {2 → 0;}; BLACK to BLUE S5 = {10 → 1; 9 → 4;} S6 = {6 → 4;} S7 = {7 → 4;} S8 = {8 → 4;}; BLUE to BLACK S9 = {1 → 0;} S10 = {4 → 0;}. Let L4[2]−RDT denote the data aggregation latency of Al- gorithm 4 in [1] taking in an input of a reduced data ag- gregation tree, then for this example we have L4[2]−RDT = 10 > L5−RDT = 7. 3.4. Performance Analysis In this section we show that Algorithm 5 has a latency bound of 16R + Δ – 11. Suppose that DT is a data aggre- gation tree generated by Algorithm 2 and RDT is a redu- ced data aggregation tree generated by Algorithm 3 tak- ing in an input of DT. Let L4[2]−DT denote the data aggre- gation latency of Algorithm 4 in [1] taking in an input of DT, L 4[2]−DT = 23R + Δ – 18; If we could estimate L4[2]−RDT = 16R + Δ – 11, according to Lemma 3.2, there is L5−RDT L4[2]−RDT, then L5−RDT 16R + Δ – 11, i.e. Al- gorithm 5 has a latency bound of 16R + Δ – 11. Now, let’s estimate L4[2]−RDT = 16R + Δ – 11. The tran- smission rule of Algorithm 4 in [1] has three parts: 1) WHITE to BLACK; 2) BLACK to BLUE; 3) BLUE to BLACK. 1) WHITE to BLACK: It takes at most Δ – 1 time slots [2] to finish the transmission. 2) BLACK to BLUE: It takes at most 4 time slots to finish the transmission. 3) BLUE to BLACK: We need to estimate how many blue nodes are competing to transmit to the same black parent. According to Lemma 3.1, we know that for a fixed black node u BLACKi (i = 0, 1, …, l – 2), there are at most 13 blue nodes which can cover u’s 2-hop bla- ck neighbors in BLACKi + 2. One of these 13 blue nodes must be node u’s parent. Therefore, there are at most 12 blue nodes which are competing to transmit to the same black parent. WHITE-to-BLACK needs Δ – 1 time slots. From layer R to layer 2, BLACK-to-BLUE and BLUE-to-BLACK together need (12 + 4)·(R – 2) time slots. Transmission from layer 2 to layer 1 needs 13 + 4 time slots and trans- mission from layer 1 to the sink needs 5 time slots. Al- together, L4[2]−RDT = (Δ – 1) + (12 + 4)·(R - 2) + 13 + 4 + 5 = 16R + Δ – 11. Therefore, L5−RDT L4[2]−RDT < L4[2]−DT = 23R + Δ – 18, i.e. Algorithm 5 has a latency bound of 16R + Δ – 11. Lemma 3.3 If R ≥ Δ – 11, our algorithm has approxi- mation ratio 17. Proof: Given a graph G = (V, E) and the sink node s V, let Lopt denote the minimum data aggregation latency. Since farthest node has to transmit data to the sink, the- refore Lopt ≥ R. L5−RDT / Lopt (16R + Δ – 11) / R 16 + (Δ – 11) / R, when R ≥ Δ – 11, L5−RDT/Lopt 17. Lemma 3.4 If R is enough large, our algorithm has approximation ratio 16 from an asymptotic point of view. Proof: According to the proof of lemma 3.3, when R tends to infinite, (Δ – 11)/R tends to zero, therefore our algorithm has approximation ratio 16 from an asymptotic point of view. For example, given a data aggregation tree DT without reducing the number of blue nodes in Figure 5, the final data aggregation schedule generated by Algorithm 4 in [1] is given as follows: WHITE to BLACK S1 = {5 → 0; 11 → 10; 13 → 6; 17 → 8;} S2 = {16 → 9; 14 → 6; 12 → 10;} S3 = {15 → 6;}; BLACK to BLUE S4 = {10 → 1; 9 → 4;} S5 = {6 → 2;} S6 = {7 → 3;} S7 = {8 → 4;} BLUE to BLACK S8 = {1 → 0;} S9 = {2 → 0;} S10 = {3 → 0;} S11 = {4 → 0;}. In this example, we have L4[2]−DT = 11. For the exam- ple of the topology shown in Figure 2, we have: L5−RDT = 7 < L4[2]−RDT = 10 < L4[2]−DT = 11. 4. Simulation Results In this section, we evaluate our work by conducting exte- nsive simulations. We compare our algorithm with Algo- rithm 4 in [1]. In the following, we first explain the obje- ctive of the simulations, the generation of a network and performance metric we used. Then we present the simul- ation results. There are two main factors that affect the data aggregation latency, network radius R and the ma- ximum degree of network topology Δ. The objective of the simulations is straightforward, that is to investigate the effects of R and Δ on the data aggregation latency. The performance metric is the number of transmission schedule sets in data aggregation schedule {S1, S2, …, Sl}, i.e. the value of l. The smaller l means that the better the algorithm performance. We also implemented a topology simulator that can ra- ndomly deploy sensors into a square region of size X × X, where X is the width of the square. The topology simu- lator takes in an input of a network radius R, a maximum degree of network topology Δ, a transmission range of each sensor node r. R is the length of the longest path in data aggregation tree DT from the sink to the leaf nodes of DT, i.e. the largest number of hops from the sink to Copyright © 2010 SciRes. IJCNS  M. R. REN ET AL. 687 the leaf nodes of DT. The output of this simulator is a topology which deploys N sensor nodes randomly into a square region of size X × X, where N = (Δ + 1)R2/(2π), and X = R·r/sqrt (2.0). The deduction of N and X is based on the assumption that the node density ρ is a constant such that in each node’s transmission range there are Δ neighbors. Therefore, ρ = (Δ + 1)/(π·r2), N = X2ρ = (Δ + 1)R2/(2π). Simulations are conducted from two points of view: 1) The sink is always the node nearest to the left-up corner. We investigate the effects of network radius R and the maximum degree Δ on the data aggregation late- ncy using the above topology simulator. First, Δ is fixed to 20, and the transmission range r is set to 30 m. R varies from 7 to 37 with an increment of 5. In Figure 8, for each R, we generated 30 random topolo- gies and computed the average data aggregation latency for 30 topologies. The average data aggregation latency is proportional to R. The pattern of those curves matched our theoretical estimation. Our algorithm has smaller lat- ency compared with Algorithm 4 in [1] (denoted as Hu- ang’s algorithm). Second, R is fixed to 8, and the transmission range r is set to 30 m. Δ varies from 18 to 63 with an increment of 5. As shown in Figure 9, for each fixed Δ, we generated 30 random topologies and computed the average data aggregation latency for 30 topologies. The average data aggregation latency is also proportional to Δ. Our algo- rithm has smaller latency compared with Huang’s algo- rithm. Since R is fixed, the gap between the two curves almost does not change. This is true according to our theoretical analysis. 2) The sink is always the node with ID 0. Its position is random. We randomly deployed sensors into a fixed region of size 400 m × 400 m. We investigated the ef- fects of the number of nodes N and the transmission range r on the data aggregation latency. Figure 8. The effect of R. First, the transmission range r is set to 30 m. N varies from 180 to 980 with an increment of 100. In Figure 10, for each N, we generated 30 random topologies and co- mputed the average data aggregation latency for 30 top- ologies. When N increases, R and Δ both increase. N is proportional to (Δ + 1)R2. Our algorithm has smaller latency compared with Huang’s algorithm. Second, the number of sensor nodes N is fixed to 200. r varies from 27 to 57 with an increment of 5. In Figure 11, for each r, we randomly deployed 200 sensors for 30 times and computed the average data aggregation latency for 30 topologies. In this simulation, the node density ρ is a constant since a in fixed region there is a fixed number of sensor nodes. R = sqrt(2.0)·X/r, and Δ = π·r2·ρ – 1. Ob- viously, when r increases, R decreases with 1/r and Δ in- creases with r2. Therefore, the two curves are nearly lin- ear. Our algorithm has smaller latency compared with Huang’s algorithm. Figure 9. The effect of Δ. Figure 10. The effect of N. Copyright © 2010 SciRes. IJCNS  M. R. REN ET AL. Copyright © 2010 SciRes. IJCNS 688 Figure 11. The effect of r. 5. Conclusions The Existing works on data aggregation in WSNs usually use a single channel which results in a long latency due to high interference, especially in high-density networks. Therefore, data aggregation is a fundamental yet time- consuming task in WSNs. In this paper, we investigate the minimum data aggregation latency problem. We used the techniques of reducing the number of blue nodes and finding maximal non-conflicting transmission schedule set based on leaves and designed an algorithm with a latency bound of 16R + Δ – 11, where Δ is the maximum degree and R is the network radius. We prove that our al- gorithm has smaller latency than other algorithms. Sim- ulation results show that our algorithm has much better performance in practice than previous works. 6. References [1] S. C.-H. Huang, P.-J. Wan, C. T. Vu, Y. S. Li and F. Yao, “Nearly Constant Approximation for Data Aggregation Scheduling in Wireless Sensor Networks,” Proceedings of 26th IEEE International Conference on Computer Communications, Anchorage, 6-12 May 2007, pp. 366- 372. [2] X. J. Chen, X. D. Hu and J. M. Zhu, “Minimum Data Aggregation Time Problem in Wireless Sensor Net- works,” Proceedings of 1st International Conference on Mobile Ad-Hoc and Sensor Networks, Lecture Notes in Computer Science, Wuhan, Vol. 3794, 13-15 December 2005, pp. 133-142. [3] V. Annamalai, S. K. S. Gupta and L. Schwiebert, “On Tree-Based Convergecasting in Wireless Sensor Net- works,” Proceedings of IEEE Wireless Communications and Networking, New Orleans, Vol. 3, 20 March 2003, pp. 1942-1947. [4] S. Upadhyayula, V. Annamalai and S. K. S. Gupta, “A Low Latency and Energy-Efficient Algorithm for Con- vergecast in Wireless Sensor Networks,” Proceedings of IEEE Global Telecommunications Conference, San Fran- cisco, Vol. 6, 1-5 December 2003, pp. 3525-3530. [5] H. J. Wu, Q. Luo and W. W. Xue, “Distributed Cross- Layer Scheduling for in-Network Sensor Query Process- ing,” Proceedings of 4th Annual IEEE International Con- ference on Pervasive Computing and Communications, Pisa, Vol. 10, 13-17 March 2006, pp. 180-189. [6] O. Chipara, C. Y. Lu and J. Stankovic, “Dynamic Con- flict-Free Query Scheduling for Wireless Sensor Net- works,” Proceedings of 14th IEEE International Confer- ence on Network Protocols, Santa Barbara, 12-15 No- vember 2006, pp. 321-331. [7] Y. Yu, B. Krishnamachari and V. K. Prasanna, “En- ergy-Latency Trade-Offs for Data Gathering in Wireless Sensor Networks,” Proceedings of 23rd Annual Joint Conference of the IEEE Computer and Communications Societies, Hong Kong, 7-11 March 2004, pp. 1-12. [8] Q. F. Huang and Y. Zhang, “Radial Coordination for Convergecast in Wireless Sensor Networks,” Proceed- ings of 29th Annual IEEE International Conference on Local Computer Networks, Tampa, 16-18 November 2004, pp. 542-549. [9] H. W. Zhang, A. Arora, Y.-R. Choi and M. G. Gouda, “Reliable Bursty Convergecast in Wireless Sensor Net- works,” Proceedings of the 6th ACM International Sym- posium on Mobile Ad Hoc Networking and Computing, Urbana-Champaign, 25-28 May 2005, pp. 266-276. [10] B. Krishnamachari, D. Estrin and S. B. Wicker, “The Impact of Data Aggregation in Wireless Sensor Net- works,” Proceedings of the 22nd International Confer- ence on Distributed Computing Systems, Vienna, 2-5 July 2002, pp. 575-578. [11] C. Intanagonwiwat, D. Estrin, R. Govindan and J. Hei- demann, “Impact of Network Density on Data Aggrega- tion in Wireless Sensor Networks,” Proceedings of the 22nd International Conference on Distributed Computing Systems, Vienna, 2-5 July 2002, pp. 457-472. [12] A. Kesselman and D. Kowalski, “Fast Distributed Algo- rithm for Convergecast in Ad Hoc Geometric Radio Networks,” Proceedings of 2nd International Conference on Wireless on Demand Network Systems and Service, St. Moritz, 19-21 January 2005, pp. 1-6. [13] R. A. Brualdi, “Introductory Combinatorics,” 3rd Edition, Prentice Hall, Upper Saddle River, 1999, pp. 27-34. |