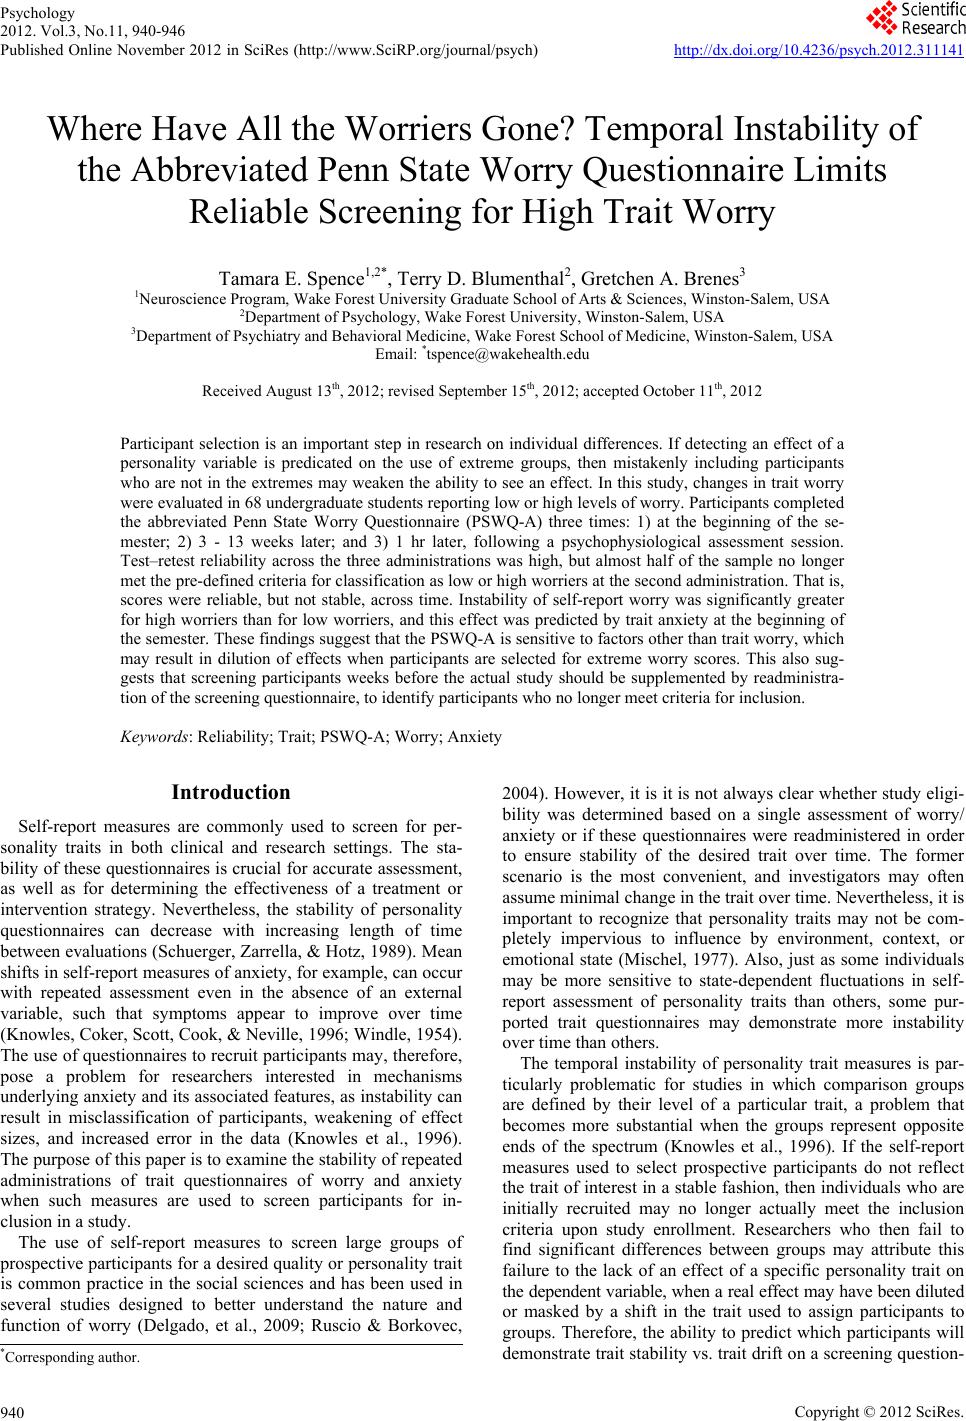
 Psychology 2012. Vol.3, No.11, 940-946 Published Online November 2012 in SciRes (http://www.SciRP.org/journal/psych) http://dx.doi.org/10.4236/psych.2012.311141 Copyright © 2012 SciRes. 940 Where Have All the Worriers Gone? Temporal Instability of the Abbreviated Penn State Worry Questionnaire Limits Reliable Screening for High Trait Worry Tamara E. Spence1,2*, Terry D. Blumenthal2, Gretchen A. Brenes3 1Neuroscience Program, Wake Forest University Graduate School of Arts & Sciences, Winston-Salem, USA 2Department of Psychology, Wake Forest University, Winston-Salem, USA 3Department of Psychiatry and Behavioral Medicine, Wake Forest School of Medicine, Winston-Salem, USA Email: *tspence@wakehealth.edu Received August 13th, 2012; revised September 15th, 2012; accepted October 11th, 2012 Participant selection is an important step in research on individual differences. If detecting an effect of a personality variable is predicated on the use of extreme groups, then mistakenly including participants who are not in the extremes may weaken the ability to see an effect. In this study, changes in trait worry were evaluated in 68 undergraduate students reporting low or high levels of worry. Participants completed the abbreviated Penn State Worry Questionnaire (PSWQ-A) three times: 1) at the beginning of the se- mester; 2) 3 - 13 weeks later; and 3) 1 hr later, following a psychophysiological assessment session. Test–retest reliability across the three administrations was high, but almost half of the sample no longer met the pre-defined criteria for classification as low or high worriers at the second administration. That is, scores were reliable, but not stable, across time. Instability of self-report worry was significantly greater for high worriers than for low worriers, and this effect was predicted by trait anxiety at the beginning of the semester. These findings suggest that the PSWQ-A is sensitive to factors other than trait worry, which may result in dilution of effects when participants are selected for extreme worry scores. This also sug- gests that screening participants weeks before the actual study should be supplemented by readministra- tion of the screening questionnaire, to identify participants who no longer meet criteria for inclusion. Keywords: Reliability; Trait; PSWQ-A; Worry; Anxiety Introduction Self-report measures are commonly used to screen for per- sonality traits in both clinical and research settings. The sta- bility of these questionnaires is crucial for accurate assessment, as well as for determining the effectiveness of a treatment or intervention strategy. Nevertheless, the stability of personality questionnaires can decrease with increasing length of time between evaluations (Schuerger, Zarrella, & Hotz, 1989). Mean shifts in self-report measures of anxiety, for example, can occur with repeated assessment even in the absence of an external variable, such that symptoms appear to improve over time (Knowles, Coker, Scott, Cook, & Neville, 1996; Windle, 1954). The use of questionnaires to recruit participants may, therefore, pose a problem for researchers interested in mechanisms underlying anxiety and its associated features, as instability can result in misclassification of participants, weakening of effect sizes, and increased error in the data (Knowles et al., 1996). The purpose of this paper is to examine the stability of repeated administrations of trait questionnaires of worry and anxiety when such measures are used to screen participants for in- clusion in a study. The use of self-report measures to screen large groups of prospective participants for a desired quality or personality trait is common practice in the social sciences and has been used in several studies designed to better understand the nature and function of worry (Delgado, et al., 2009; Ruscio & Borkovec, 2004). However, it is it is not always clear whether study eligi- bility was determined based on a single assessment of worry/ anxiety or if these questionnaires were readministered in order to ensure stability of the desired trait over time. The former scenario is the most convenient, and investigators may often assume minimal change in the trait over time. Nevertheless, it is important to recognize that personality traits may not be com- pletely impervious to influence by environment, context, or emotional state (Mischel, 1977). Also, just as some individuals may be more sensitive to state-dependent fluctuations in self- report assessment of personality traits than others, some pur- ported trait questionnaires may demonstrate more instability over time than others. The temporal instability of personality trait measures is par- ticularly problematic for studies in which comparison groups are defined by their level of a particular trait, a problem that becomes more substantial when the groups represent opposite ends of the spectrum (Knowles et al., 1996). If the self-report measures used to select prospective participants do not reflect the trait of interest in a stable fashion, then individuals who are initially recruited may no longer actually meet the inclusion criteria upon study enrollment. Researchers who then fail to find significant differences between groups may attribute this failure to the lack of an effect of a specific personality trait on the dependent variable, when a real effect may have been diluted or masked by a shift in the trait used to assign participants to groups. Therefore, the ability to predict which participants will demonstrate trait stability vs. trait drift on a screening question- *Corresponding author. 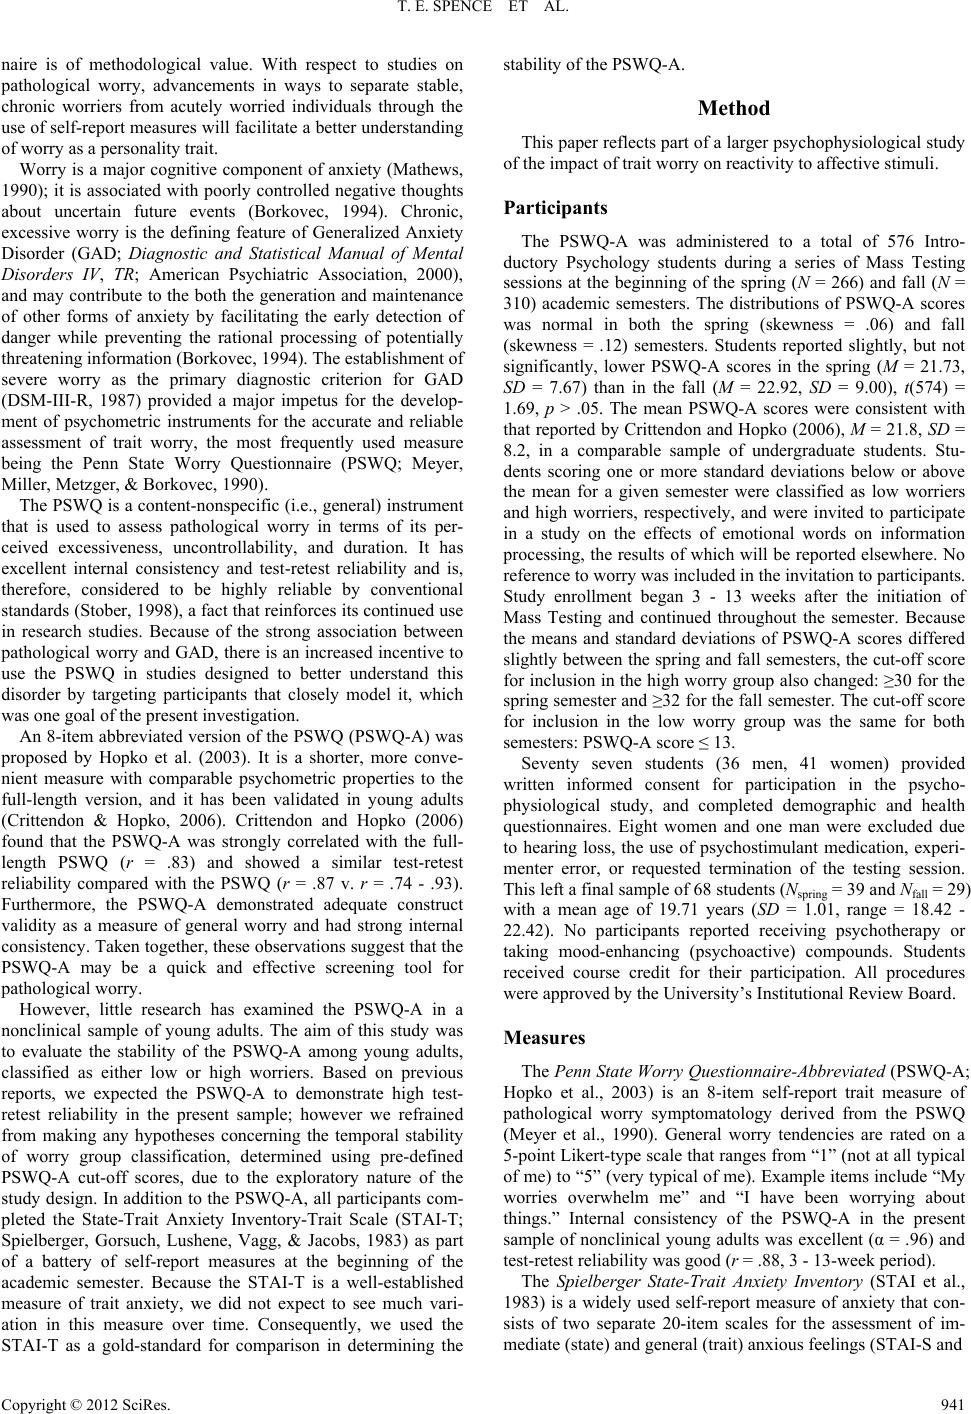 T. E. SPENCE ET AL. naire is of methodological value. With respect to studies on pathological worry, advancements in ways to separate stable, chronic worriers from acutely worried individuals through the use of self-report measures will facilitate a better understanding of worry as a personality trait. Worry is a major cognitive component of anxiety (Mathews, 1990); it is associated with poorly controlled negative thoughts about uncertain future events (Borkovec, 1994). Chronic, excessive worry is the defining feature of Generalized Anxiety Disorder (GAD; Diagnostic and Statistical Manual of Mental Disorders IV, TR; American Psychiatric Association, 2000), and may contribute to the both the generation and maintenance of other forms of anxiety by facilitating the early detection of danger while preventing the rational processing of potentially threatening information (Borkovec, 1994). The establishment of severe worry as the primary diagnostic criterion for GAD (DSM-III-R, 1987) provided a major impetus for the develop- ment of psychometric instruments for the accurate and reliable assessment of trait worry, the most frequently used measure being the Penn State Worry Questionnaire (PSWQ; Meyer, Miller, Metzger, & Borkovec, 1990). The PSWQ is a content-nonspecific (i.e., general) instrument that is used to assess pathological worry in terms of its per- ceived excessiveness, uncontrollability, and duration. It has excellent internal consistency and test-retest reliability and is, therefore, considered to be highly reliable by conventional standards (Stober, 1998), a fact that reinforces its continued use in research studies. Because of the strong association between pathological worry and GAD, there is an increased incentive to use the PSWQ in studies designed to better understand this disorder by targeting participants that closely model it, which was one goal of the present investigation. An 8-item abbreviated version of the PSWQ (PSWQ-A) was proposed by Hopko et al. (2003). It is a shorter, more conve- nient measure with comparable psychometric properties to the full-length version, and it has been validated in young adults (Crittendon & Hopko, 2006). Crittendon and Hopko (2006) found that the PSWQ-A was strongly correlated with the full- length PSWQ (r = .83) and showed a similar test-retest reliability compared with the PSWQ (r = .87 v. r = .74 - .93). Furthermore, the PSWQ-A demonstrated adequate construct validity as a measure of general worry and had strong internal consistency. Taken together, these observations suggest that the PSWQ-A may be a quick and effective screening tool for pathological worry. However, little research has examined the PSWQ-A in a nonclinical sample of young adults. The aim of this study was to evaluate the stability of the PSWQ-A among young adults, classified as either low or high worriers. Based on previous reports, we expected the PSWQ-A to demonstrate high test- retest reliability in the present sample; however we refrained from making any hypotheses concerning the temporal stability of worry group classification, determined using pre-defined PSWQ-A cut-off scores, due to the exploratory nature of the study design. In addition to the PSWQ-A, all participants com- pleted the State-Trait Anxiety Inventory-Trait Scale (STAI-T; Spielberger, Gorsuch, Lushene, Vagg, & Jacobs, 1983) as part of a battery of self-report measures at the beginning of the academic semester. Because the STAI-T is a well-established measure of trait anxiety, we did not expect to see much vari- ation in this measure over time. Consequently, we used the STAI-T as a gold-standard for comparison in determining the stability of the PSWQ-A. Method This paper reflects part of a larger psychophysiological study of the impact of trait worry on reactivity to affective stimuli. Participants The PSWQ-A was administered to a total of 576 Intro- ductory Psychology students during a series of Mass Testing sessions at the beginning of the spring (N = 266) and fall (N = 310) academic semesters. The distributions of PSWQ-A scores was normal in both the spring (skewness = .06) and fall (skewness = .12) semesters. Students reported slightly, but not significantly, lower PSWQ-A scores in the spring (M = 21.73, SD = 7.67) than in the fall (M = 22.92, SD = 9.00), t(574) = 1.69, p > .05. The mean PSWQ-A scores were consistent with that reported by Crittendon and Hopko (2006), M = 21.8, SD = 8.2, in a comparable sample of undergraduate students. Stu- dents scoring one or more standard deviations below or above the mean for a given semester were classified as low worriers and high worriers, respectively, and were invited to participate in a study on the effects of emotional words on information processing, the results of which will be reported elsewhere. No reference to worry was included in the invitation to participants. Study enrollment began 3 - 13 weeks after the initiation of Mass Testing and continued throughout the semester. Because the means and standard deviations of PSWQ-A scores differed slightly between the spring and fall semesters, the cut-off score for inclusion in the high worry group also changed: ≥30 for the spring semester and ≥32 for the fall semester. The cut-off score for inclusion in the low worry group was the same for both semesters: PSWQ-A score ≤ 13. Seventy seven students (36 men, 41 women) provided written informed consent for participation in the psycho- physiological study, and completed demographic and health questionnaires. Eight women and one man were excluded due to hearing loss, the use of psychostimulant medication, experi- menter error, or requested termination of the testing session. This left a final sample of 68 students (Nspring = 39 and Nfall = 29) with a mean age of 19.71 years (SD = 1.01, range = 18.42 - 22.42). No participants reported receiving psychotherapy or taking mood-enhancing (psychoactive) compounds. Students received course credit for their participation. All procedures were approved by the University’s Institutional Review Board. Measures The Penn State Worry Questionnaire-Abbreviated (PSWQ-A; Hopko et al., 2003) is an 8-item self-report trait measure of pathological worry symptomatology derived from the PSWQ (Meyer et al., 1990). General worry tendencies are rated on a 5-point Likert-type scale that ranges from “1” (not at all typical of me) to “5” (very typical of me). Example items include “My worries overwhelm me” and “I have been worrying about things.” Internal consistency of the PSWQ-A in the present sample of nonclinical young adults was excellent (α = .96) and test-retest reliability was good (r = .88, 3 - 13-week period). The Spielberger State-Trait Anxiety Inventory (STAI et al., 1983) is a widely used self-report measure of anxiety that con- sists of two separate 20-item scales for the assessment of im- mediate (state) and general (trait) anxious feelings (STAI-S and Copyright © 2012 SciRes. 941  T. E. SPENCE ET AL. STAI-T scales, respectively). The current experience of anxiety is evaluated using the STAI-S and rated on a 4-point Likert-type scale that ranges from “1” (not at all) to “4” (very much so). The frequency of anxious symptomatology is deter- mined using the STAI-T and rated from “1” (almost never) to “4” (almost always). Example items from the STAI-S and STAI-T are “I am tense” and “I feel nervous and restless,” re- spectively. In the present study, internal consistency of the STAI was excellent (α = .94 and α = .92 for the state and trait scales, respectively) and test–retest reliability of the STAI-T was strong (r = .83, 3 - 13-week period). The Generalized Anxiety Disorder 7-Item Questionnaire (GAD-7; Spitzer, Kroenke, Williams, & Lowe, 2006) is a brief instrument that measures the severity of GAD symptoms ex- perienced over a 2-week period. The extent to which individu- als are bothered by a given symptom (e.g., “worrying too much about different things”) is rated on a 4-pont Likert-type scale that ranges from “0” (not at all) to “3” (nearly every day). The Center for Epidemiologic Studies-Depression Scale (CES-D; Radloff, 1977) is a 20-item self-report measure of current depressive symptomatology, within a 1-week period. The frequency of each symptom (e.g., “I felt everything I did was an effort”) is rated on a 4-point Likert-type scale that ranges from “0” (rarely or none of the time [<1 day]) to “3” (most or all of the time [5 - 7 days]). Procedure Participants were screened for both trait worry and trait anxi- ety at the beginning of the academic semester. We were blind to participants’ worry and anxiety levels until the entire study was completed. Upon study enrollment, participants were tested individually in sessions lasting 1 - 1.5 hr. After informed consent was obtained and study eligibility was determined, participants completed the above question- naires prior to a 30 min acoustic startle assessment session1. Participants then completed a final set of questionnaires that contained the PSWQ-A and additional measures that are not germane to this study. In summary, the PSWQ-A was administered three times in order to 1) recruit participants with either low or high levels of trait worry (Mass Testing), 2) obtain a baseline measure of worry severity upon arrival at the laboratory (pre-session), and 3) evaluate the effects, if any, of the psychophysiological pro- cedure on worry severity (post-session). To compare the stabil- ity of trait worry with that of trait anxiety, the STAI-T was administered in conjunction with the PSWQ-A at both Mass Testing and pre-session. The time between the first and second administrations of these questionnaires was 3 - 13 weeks, whereas the time between the second and third administrations was approximately 1 hr. Data Analysis All data were analyzed using IBM SPSS Statistics version 19. Pearson’s product-moment correlations (r) were used to com- pute test-retest reliability estimates for multiple administra- tions of self-report measures and intercorrelations among pre- session measures of psychological distress. Effect sizes for all t-tests and analyses of variance (ANOVA) are reported using Cohen’s d (Cohen, 1992) and partial eta squared (2 η ), respectively. Greenhouse-Geisser epsilon (ε) corrected degrees of freedom were used to counteract possible violations of sphericity in repeated measures tests involving more than two levels. Although uncorrected degrees of freedom are reported below, statistical significance was determined using ε corrected values. All analyses consisted of two-tailed tests, and statistical significance was determined using an alpha level of .05. Results Temporal Instability of Worry Changes in PSWQ-A scores as a function of repeated assess- ment were examined using a 2 (semester: spring, fall) by 3 (time: Mass Testing, pre-session, post-session) mixed-model ANOVA with repeated measures for time. There was no effect of semester on PSWQ-A scores, p > .3. However, a main effect of time on self-report worry was observed, F(2,136) = 17.56, p < .001, ε = .658, 2 η = .21. Tests of pairwise comparisons were conducted using Bonferroni adjusted alpha levels of .017 per test (.05/3). Results indicated that there were significant reductions in the average PSWQ-A score from Mass Testing (M = 20.44, SE = 1.45) to pre-session (M = 18.15, SE = 1.11) and from pre-session to post-session (M = 16.82, SE = 1.12). Although the PSWQ-A had strong test–retest reliability across administrations (r = .88, p < .001, from Mass Testing to pre-session, and r = .96, p < .001, from pre- to post-session), further inspection of mean shifts in worry over time indicated that 41% of the sample failed to retain their original classi- fication as members of either the low worry group or high worry group from Mass Testing to pre-session. An indepen- dent-samples t-test between proportions indicated that a greater number of high worriers (69%) demonstrated significant drift in self-report worry during this time than low worriers (20%), t(67) = 4.09, p < .001. In an effort to better understand these mean shifts in worry, we divided the sample into four distinct groups based on PSWQ-A scores at pre-session (see Figure 1): 1) stable low worry (n = 31), M = 10.32, SE = .30; 2) unstable low worry, (n = 8), M = 15.75, SE = .80; 3) unstable high worry (n = 20), M = 25.00, SE = .84; and 4) stable high worry (n = 9), M = 33.67, SE = 1.18. Independent samples t-tests were used to eva- luate the average difference (D) in PSWQ-A scores between the stable and unstable worry groups at the third assessment point (post-session). Unstable high worriers reported significantly low- er levels of worry than stable high worriers, t(27) = 6.24, p < .001, D = 10.71, d = 1.20. However, unstable low worriers reported only marginally higher levels of worry than stable low worriers, t(37) = –2.05, p < .1, D = –2.04, d = –.33 (see Figure 1). 1Briefly, two miniature surface recording electrodes were placed on the skin above the orbicularis oculi muscle on the left side of the face, with a ground electrode placed on the left temple, and participants wore headphones through which 50-ms bursts of intense (100 dB) broad and noise were intermittently presented. During the testing session, participants passively viewed a series of words of varying emotional valence that were presented on a computer monitor at a viewing distance of 40 cm. For each word, the exposure duration was 1 s (average intertrial interval = 20 s). The electro- myographic activity of facial muscle contractions in response to the loud noises (i.e., the acoustic startle eyeblink response) was recorded, quantified, and subsequently analyzed as a function of both worry severity and word type (those startle data are not included in this paper). Electrodes and head- phones were removed before the third administration of the PSWQ-A. Temporal Stability of Trait Anxiety Similar to the PSWQ-A, the STAI-T demonstrated high test- Copyright © 2012 SciRes. 942  T. E. SPENCE ET AL. Figure 1. Changes in self-report worry in select groups of low and high worriers as a function of repeated assessment with the abbreviated Penn State Worry Questionnaire (PSWQ-A). Mean shifts in PSWQ-A scores from study recruitment (Mass Testing) to enroll- ment (pre-session) resulted in the reclassification of participants into four groups: 1) stable low worry (n = 31); 2) unstable low worry (n = 8); 3) unstable high worry (n = 20); and 4) stable high worry (n = 9). Error bars represent the SEM. retest reliability (r = .83, p < .001). Based on changes in self- report worry in this sample, stability of trait anxiety from Mass Testing to pre-session was investigated using a 4 (group) by 2 (time) mixed-model ANOVA with repeated measures for time (see Figure 2). There was a main effect of time on STAI-T scores, F(1,64) = 4.82, p < .05, 2 η = .07, driven by a reduc- tion from Mass Testing (M = 39.95, SE = 1.03) to pre-session (M = 38.03, SE = 1.05). In addition, there was a main effect of group, F(3,64) = 28.73, p < .001, 2 η = .57, such that the high worry groups had higher mean STAI-T scores than the low worry groups. However, the interaction between group and time was not significant, F(3,64) = 1.16, p > .3. To follow up the main effects, independent-samples t-tests were performed to examine differences in Mass Testing trait anxiety between groups as function of worry stability. Results indicated that participants in the stable high worry group (M = 51.11, SE = 3.11) reported significantly higher levels of trait anxiety at the beginning of the academic semester than those in the unstable high worry group (M = 44.45, SE = 1.66), t(27) = 2.07, p < .05, d = .83, despite the fact that members of both groups were originally recruited for comparable levels of worry severity. By contrast, Mass Testing trait anxiety did not significantly differ between participants in the stable low worry group (M = 30.00, SE = 1.22) and those in the unstable low worry group (M = 34.25, SE = 2.31), t(37) = –1.59, p > .1. Although trait anxiety and worry severity were highly corre- lated at both Mass Testing (r = .75, p < .001) and pre-session (r = .72, p < .001), significant shifts in worry were not paired with similar shifts in trait anxiety as a function of repeated assessment. Participants who were both highly worried and highly anxious showed less variance in self-report worry over time, providing a rationale to conduct a discriminant analysis of the predictive ability of trait anxiety at the beginning of the semester to determine the stability of worry several weeks later. Because trait anxiety did not differ between the low worry groups, the analysis was restricted to the high worry groups. The discriminant function, D = (.125 × trait anxiety) – 5.80, indicated a significant association between groups and Mass Testing STAI-T scores. Specifically, the canonical correlation between trait anxiety and the discriminant function (R = .37), F(1,16) = 7.46, p < .05, explained approximately 14% of the Figure 2. Stability of self-report trait anxiety over time. Groups were defined by differences in the consistency of worry (PSWQ-A scores) from Mass Testing to pre-session. The stable high worry group reported higher levels of trait anxiety than the unstable high worry group at both time points. By contrast, trait anxiety did not differ between the stable and unstable low worry groups. Error bars represent the SEM. variance between the stable and unstable high worry groups. Application of the function to group centroids generated mean scores of .572 and –.258 for the stable and unstable high worry groups, respectively. The cross-validated classification showed that overall 72.4% of high worriers were correctly classified as belonging to either the stable high worry group (33.3%) or the unstable high worry group (90.0%). The value of tau for the classification was .355, meaning that 35.5% fewer errors were made by using the discriminate function to predict worry group membership compared with random classification, which supports the conclusion that the probability of observing tem- poral stability of worry among individuals who report initial high PSWQ-A scores increases if they also report high STAI-T scores (odds ratio = 4.5). Visual inspection of the raw data revealed that a score ≥ 45 on the STAI-T accounted for 89% of the stable high worry group and 50% of the unstable high worry group. Additional Measures of Psychological Distress Worry, state and trait anxiety, GAD symptomatology, and depression assessed prior to the acoustic startle test (pre-session) were found to be significantly positively correlated with one another at the level of the whole sample (all ps < .001, see Table 1); however, the strength of these relationships was diluted by the inclusion of participants in the unstable worry groups, for whom there were much weaker associations be- tween pre-session worry and psychological distress. Significant differences in the strength of correlation coefficients among pre-session measures between the stable and unstable worry groups were evaluated using Fisher z-to-r transformations and are highlighted in Table 1. In order to better evaluate potential factors contributing to group differences in stability of self-report worry over time, each additional measure of psychological distress was examined as a function of final worry group classification using a series of one-way ANOVA. A significant main effect of group was observed for all measures (all ps < .001). F(3,64) values (with 2 η in parenthesis) for the STAI-T, STAI-S, GAD-7, and CES-D were 20.12 (.49), 9.63 (.31), 18.77 (.47), and 9.81 (.31), respectively. Tukey’s honestly significant difference (HSD) tests were then used to compare mean differences in self-report Copyright © 2012 SciRes. 943 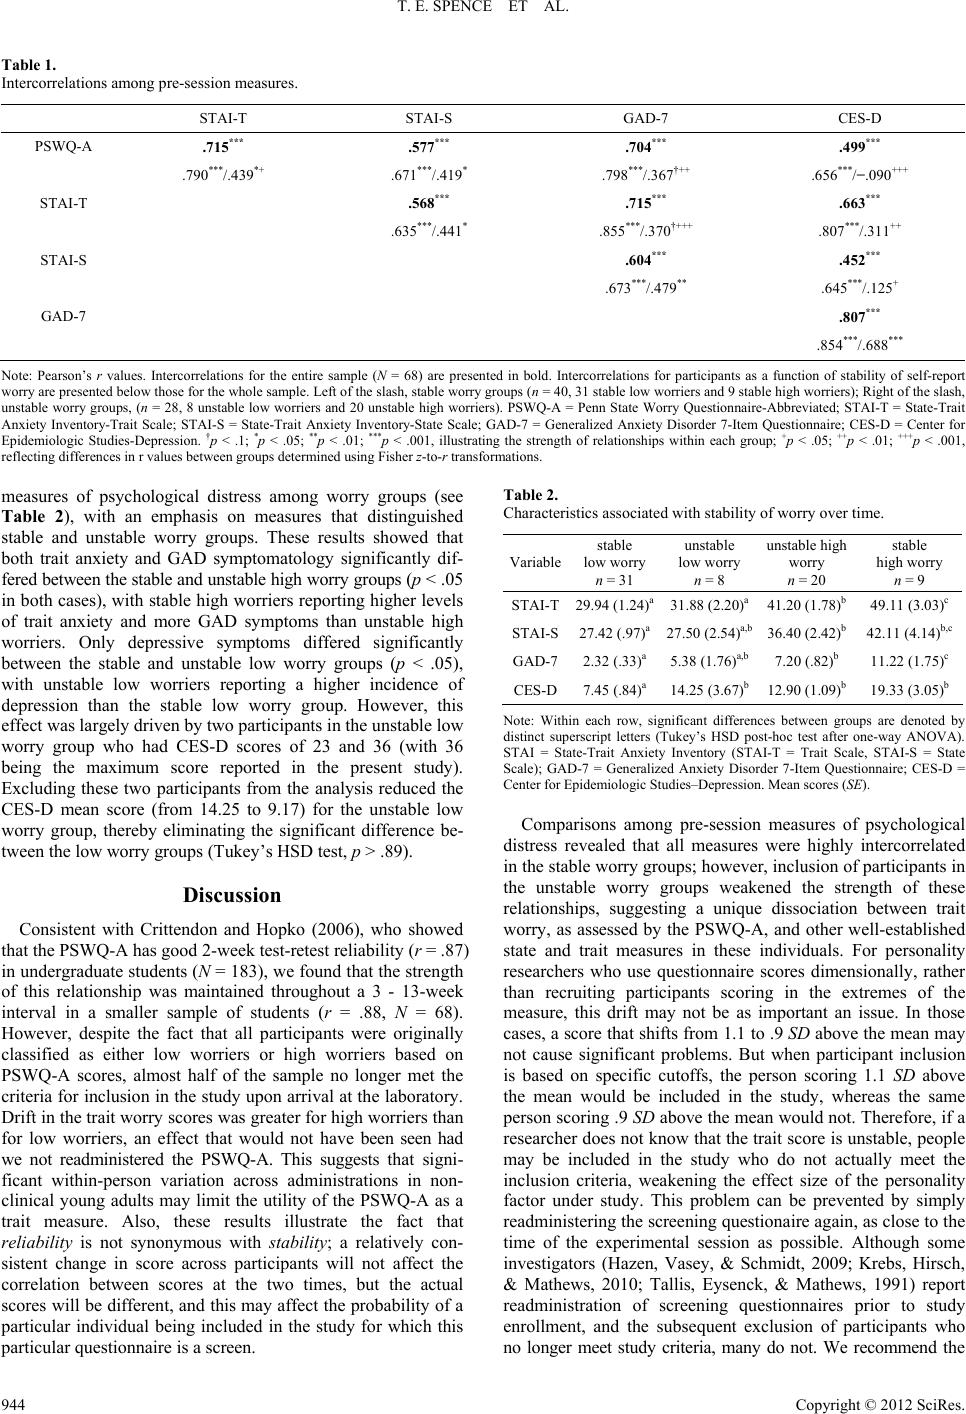 T. E. SPENCE ET AL. Copyright © 2012 SciRes. 944 Table 1. Intercorrelations among pre-session measures. STAI-T STAI-S GAD-7 CES-D PSWQ-A .715*** .577*** .704*** .499*** .790***/.439*+ .671***/.419* .798***/.367†++ .656***/−.090+++ STAI-T .568*** .715*** .663*** .635***/.441* .855***/.370†+++ .807***/.311++ STAI-S .604*** .452*** .673***/.479** .645***/.125+ GAD-7 .807*** .854***/.688*** Note: Pearson’s r values. Intercorrelations for the entire sample (N = 68) are presented in bold. Intercorrelations for participants as a function of stability of self-report worry are presented below those for the whole sample. Left of the slash, stable worry groups (n = 40, 31 stable low worriers and 9 stable high worriers); Right of the slash, unstable worry groups, (n = 28, 8 unstable low worriers and 20 unstable high worriers). PSWQ-A = Penn State Worry Questionnaire-Abbreviated; STAI-T = State-Trait Anxiety Inventory-Trait Scale; STAI-S = State-Trait Anxiety Inventory-State Scale; GAD-7 = Generalized Anxiety Disorder 7-Item Questionnaire; CES-D = Center for Epidemiologic Studies-Depression. †p < .1; *p < .05; **p < .01; ***p < .001, illustrating the strength of relationships within each group; +p < .05; ++p < .01; +++p < .001, reflecting differences in r values between groups determined using Fisher z-to-r transformations. measures of psychological distress among worry groups (see Table 2), with an emphasis on measures that distinguished stable and unstable worry groups. These results showed that both trait anxiety and GAD symptomatology significantly dif- fered between the stable and unstable high worry groups (p < .05 in both cases), with stable high worriers reporting higher levels of trait anxiety and more GAD symptoms than unstable high worriers. Only depressive symptoms differed significantly between the stable and unstable low worry groups (p < .05), with unstable low worriers reporting a higher incidence of depression than the stable low worry group. However, this effect was largely driven by two participants in the unstable low worry group who had CES-D scores of 23 and 36 (with 36 being the maximum score reported in the present study). Excluding these two participants from the analysis reduced the CES-D mean score (from 14.25 to 9.17) for the unstable low worry group, thereby eliminating the significant difference be- tween the low worry groups (Tukey’s HSD test, p > .89). Discussion Consistent with Crittendon and Hopko (2006), who showed that the PSWQ-A has good 2-week test-retest reliability (r = .87) in undergraduate students (N = 183), we found that the strength of this relationship was maintained throughout a 3 - 13-week interval in a smaller sample of students (r = .88, N = 68). However, despite the fact that all participants were originally classified as either low worriers or high worriers based on PSWQ-A scores, almost half of the sample no longer met the criteria for inclusion in the study upon arrival at the laboratory. Drift in the trait worry scores was greater for high worriers than for low worriers, an effect that would not have been seen had we not readministered the PSWQ-A. This suggests that signi- ficant within-person variation across administrations in non- clinical young adults may limit the utility of the PSWQ-A as a trait measure. Also, these results illustrate the fact that reliability is not synonymous with stability; a relatively con- sistent change in score across participants will not affect the correlation between scores at the two times, but the actual scores will be different, and this may affect the probability of a particular individual being included in the study for which this particular questionnaire is a screen. Table 2. Characteristics associated with stability of worry over time. Variable stable low worry n = 31 unstable low worry n = 8 unstable high worry n = 20 stable high worry n = 9 STAI-T29.94 (1.24)a31.88 (2.20)a 41.20 (1.78)b 49.11 (3.03)c STAI-S27.42 (.97)a27.50 (2.54)a,b 36.40 (2.42)b 42.11 (4.14)b,c GAD-72.32 (.33)a 5.38 (1.76)a,b 7.20 (.82)b 11.22 (1.75)c CES-D7.45 (.84)a 14.25 (3.67)b 12.90 (1.09)b 19.33 (3.05)b Note: Within each row, significant differences between groups are denoted by distinct superscript letters (Tukey’s HSD post-hoc test after one-way ANOVA). STAI = State-Trait Anxiety Inventory (STAI-T = Trait Scale, STAI-S = State Scale); GAD-7 = Generalized Anxiety Disorder 7-Item Questionnaire; CES-D = Center for Epidemiologic Studies–Depression. Mean scores (SE). Comparisons among pre-session measures of psychological distress revealed that all measures were highly intercorrelated in the stable worry groups; however, inclusion of participants in the unstable worry groups weakened the strength of these relationships, suggesting a unique dissociation between trait worry, as assessed by the PSWQ-A, and other well-established state and trait measures in these individuals. For personality researchers who use questionnaire scores dimensionally, rather than recruiting participants scoring in the extremes of the measure, this drift may not be as important an issue. In those cases, a score that shifts from 1.1 to .9 SD above the mean may not cause significant problems. But when participant inclusion is based on specific cutoffs, the person scoring 1.1 SD above the mean would be included in the study, whereas the same person scoring .9 SD above the mean would not. Therefore, if a researcher does not know that the trait score is unstable, people may be included in the study who do not actually meet the inclusion criteria, weakening the effect size of the personality factor under study. This problem can be prevented by simply readministering the screening questionaire again, as close to the time of the experimental session as possible. Although some investigators (Hazen, Vasey, & Schmidt, 2009; Krebs, Hirsch, & Mathews, 2010; Tallis, Eysenck, & Mathews, 1991) report readministration of screening questionnaires prior to study enrollment, and the subsequent exclusion of participants who no longer meet study criteria, many do not. We recommend the 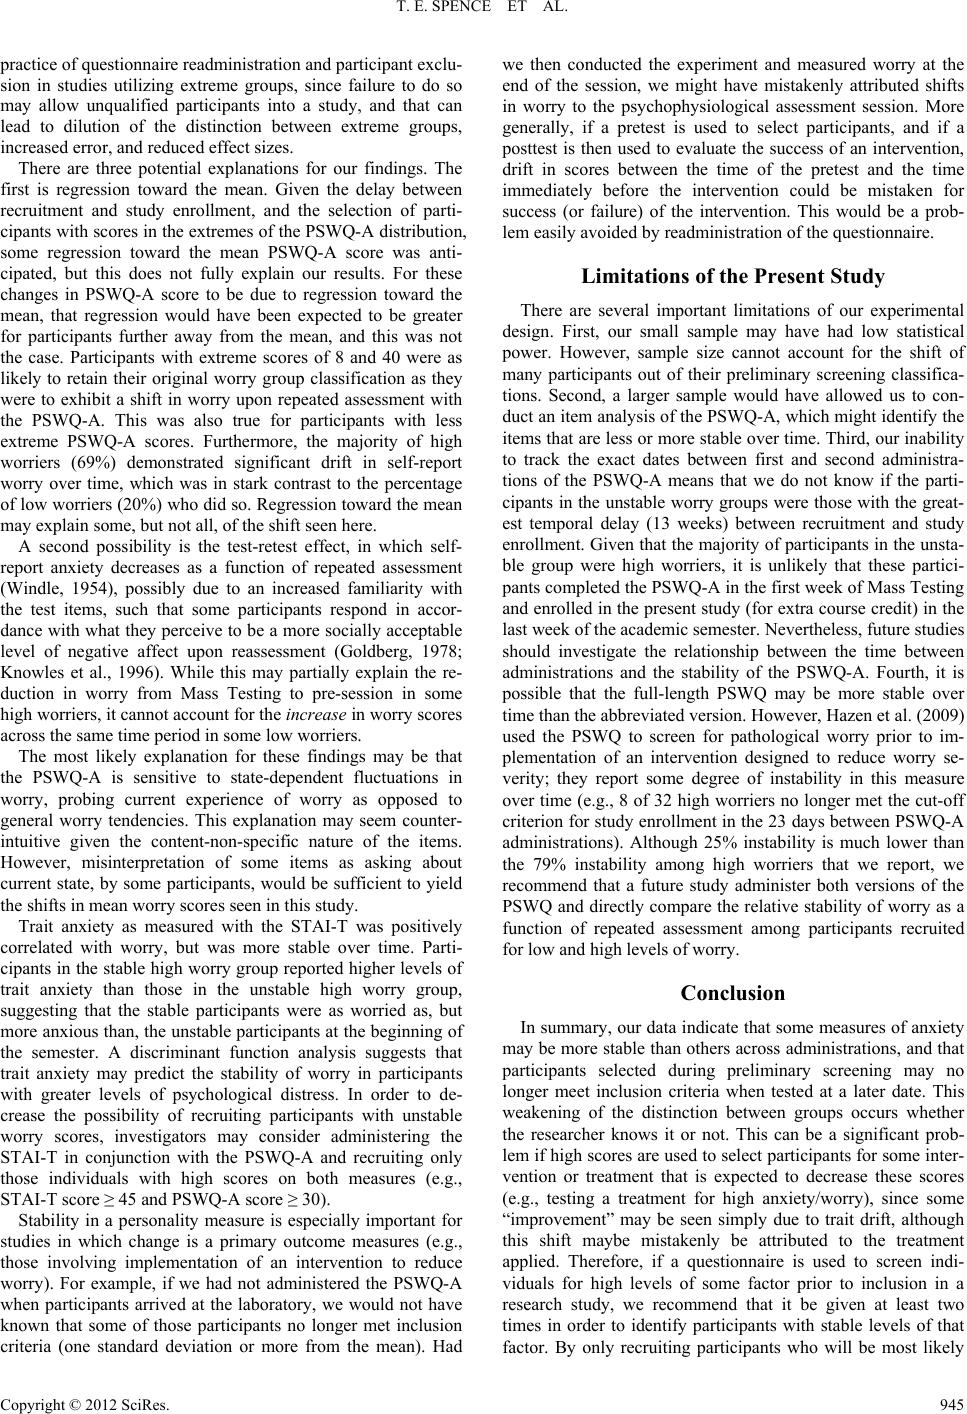 T. E. SPENCE ET AL. practice of questionnaire readministration and participant exclu- sion in studies utilizing extreme groups, since failure to do so may allow unqualified participants into a study, and that can lead to dilution of the distinction between extreme groups, increased error, and reduced effect sizes. There are three potential explanations for our findings. The first is regression toward the mean. Given the delay between recruitment and study enrollment, and the selection of parti- cipants with scores in the extremes of the PSWQ-A distribution, some regression toward the mean PSWQ-A score was anti- cipated, but this does not fully explain our results. For these changes in PSWQ-A score to be due to regression toward the mean, that regression would have been expected to be greater for participants further away from the mean, and this was not the case. Participants with extreme scores of 8 and 40 were as likely to retain their original worry group classification as they were to exhibit a shift in worry upon repeated assessment with the PSWQ-A. This was also true for participants with less extreme PSWQ-A scores. Furthermore, the majority of high worriers (69%) demonstrated significant drift in self-report worry over time, which was in stark contrast to the percentage of low worriers (20%) who did so. Regression toward the mean may explain some, but not all, of the shift seen here. A second possibility is the test-retest effect, in which self- report anxiety decreases as a function of repeated assessment (Windle, 1954), possibly due to an increased familiarity with the test items, such that some participants respond in accor- dance with what they perceive to be a more socially acceptable level of negative affect upon reassessment (Goldberg, 1978; Knowles et al., 1996). While this may partially explain the re- duction in worry from Mass Testing to pre-session in some high worriers, it cannot account for the increase in worry scores across the same time period in some low worriers. The most likely explanation for these findings may be that the PSWQ-A is sensitive to state-dependent fluctuations in worry, probing current experience of worry as opposed to general worry tendencies. This explanation may seem counter- intuitive given the content-non-specific nature of the items. However, misinterpretation of some items as asking about current state, by some participants, would be sufficient to yield the shifts in mean worry scores seen in this study. Trait anxiety as measured with the STAI-T was positively correlated with worry, but was more stable over time. Parti- cipants in the stable high worry group reported higher levels of trait anxiety than those in the unstable high worry group, suggesting that the stable participants were as worried as, but more anxious than, the unstable participants at the beginning of the semester. A discriminant function analysis suggests that trait anxiety may predict the stability of worry in participants with greater levels of psychological distress. In order to de- crease the possibility of recruiting participants with unstable worry scores, investigators may consider administering the STAI-T in conjunction with the PSWQ-A and recruiting only those individuals with high scores on both measures (e.g., STAI-T score ≥ 45 and PSWQ-A score ≥ 30). Stability in a personality measure is especially important for studies in which change is a primary outcome measures (e.g., those involving implementation of an intervention to reduce worry). For example, if we had not administered the PSWQ-A when participants arrived at the laboratory, we would not have known that some of those participants no longer met inclusion criteria (one standard deviation or more from the mean). Had we then conducted the experiment and measured worry at the end of the session, we might have mistakenly attributed shifts in worry to the psychophysiological assessment session. More generally, if a pretest is used to select participants, and if a posttest is then used to evaluate the success of an intervention, drift in scores between the time of the pretest and the time immediately before the intervention could be mistaken for success (or failure) of the intervention. This would be a prob- lem easily avoided by readministration of the questionnaire. Limitations of the Present Study There are several important limitations of our experimental design. First, our small sample may have had low statistical power. However, sample size cannot account for the shift of many participants out of their preliminary screening classifica- tions. Second, a larger sample would have allowed us to con- duct an item analysis of the PSWQ-A, which might identify the items that are less or more stable over time. Third, our inability to track the exact dates between first and second administra- tions of the PSWQ-A means that we do not know if the parti- cipants in the unstable worry groups were those with the great- est temporal delay (13 weeks) between recruitment and study enrollment. Given that the majority of participants in the unsta- ble group were high worriers, it is unlikely that these partici- pants completed the PSWQ-A in the first week of Mass Testing and enrolled in the present study (for extra course credit) in the last week of the academic semester. Nevertheless, future studies should investigate the relationship between the time between administrations and the stability of the PSWQ-A. Fourth, it is possible that the full-length PSWQ may be more stable over time than the abbreviated version. However, Hazen et al. (2009) used the PSWQ to screen for pathological worry prior to im- plementation of an intervention designed to reduce worry se- verity; they report some degree of instability in this measure over time (e.g., 8 of 32 high worriers no longer met the cut-off criterion for study enrollment in the 23 days between PSWQ-A administrations). Although 25% instability is much lower than the 79% instability among high worriers that we report, we recommend that a future study administer both versions of the PSWQ and directly compare the relative stability of worry as a function of repeated assessment among participants recruited for low and high levels of worry. Conclusion In summary, our data indicate that some measures of anxiety may be more stable than others across administrations, and that participants selected during preliminary screening may no longer meet inclusion criteria when tested at a later date. This weakening of the distinction between groups occurs whether the researcher knows it or not. This can be a significant prob- lem if high scores are used to select participants for some inter- vention or treatment that is expected to decrease these scores (e.g., testing a treatment for high anxiety/worry), since some “improvement” may be seen simply due to trait drift, although this shift maybe mistakenly be attributed to the treatment applied. Therefore, if a questionnaire is used to screen indi- viduals for high levels of some factor prior to inclusion in a research study, we recommend that it be given at least two times in order to identify participants with stable levels of that factor. By only recruiting participants who will be most likely Copyright © 2012 SciRes. 945  T. E. SPENCE ET AL. Copyright © 2012 SciRes. 946 to maintain their study inclusion criteria upon enrollment, we may save valuable time and resources, increase effect size, and reduce experimental error. Acknowledgements This work was funded by Wake Forest University Graduate School of Arts & Sciences and the Department of Psychology, and reflects research conducted by the first author in partial fulfillment of the requirements for the degree of Doctor of Phi- losophy in Neuroscience at Wake Forest University Graduate School of Arts & Sciences. We would like to thank Dustin Wood, Mike Furr, Eric Stone, and Daniel Blalock for their assistance and advice. REFERENCES American Psychiatric Association (1987). Diagnostic and statistical manual of mental disorders (3rd ed.). Washington DC: American Psychiatric Association. American Psychiatric Association (2000). Diagnostic and statistical manual of mental disorders (4th ed.). Washington DC: American Psychiatric Association. Borkovec, T. D. (1994). The nature, functions, and origins of worry. In G. Davey, & F. Tallis (Eds.), Worrying: Perspectives on theory, as- sessment and treatment (pp. 5-33). Chichester: John Wiley & Sons. Cohen, J. (1992). A power primer. Psychological Bulletin, 112, 155- 159. doi:10.1037/0033-2909.112.1.155 Crittendon, J., & Hopko, D. R. (2006). Assessing worry in older and younger adults: Psychometric properties of an abbreviated Penn State Worry Questionnaire (PSWQ-A). Journal of Anxiety Disorders, 20, 1036-1054. doi:10.1016/j.janxdis.2005.11.006 Delgado, L. C., Guerra, P., Perakakis, P., Mata, J. L., Perez, M. N., & Vila, J. (2009). Psychophysiological correlates of chronic worry: Cued versus non-cued fear reaction. International Journal of Psy- chophysiology, 74, 280-287. doi:10.1016/j.ijpsycho.2009.10.007 Goldberg, L. R. (1978). The reliability of reliability: The generality and correlates of intra-individual consistency in responses to structured personality inventories. Applied Psychological Measurement, 2, 269- 291. doi:10.1177/014662167800200209 Hazen, R. A., Vasey, M. W., & Schmidt, N. B. (2009). Attentional retraining: A randomized clinical trial for pathological worry. Jour- nal of Psychiatric Research , 43, 627-633. doi:10.1016/j.jpsychires.2008.07.004 Hopko, D. R., Stanley, M. A., Reas, D. L., Wetherell, J. L., Beck, J. G., Novy, D. M. et al. (2003). Assessing worry in older adults: Confir- matory factor analysis of the Penn State Worry Questionnaire and psychometric properties of an abbreviated model. Psychological As- sessment, 15, 173-183. doi:10.1037/1040-3590.15.2.173 Krebs, G., Hirsch, C. R., & Mathews, A. (2010). The effect of attention modification with explicit vs. minimal instructions on worry. Behav- ior Research and Therapy, 48, 251-256. doi:10.1016/j.brat.2009.10.009 Knowles, E. S., Coker, M. C., Scott, R. A., Cook, D. A., & Neville, J. W. (1996). Measurement-induced improvement in anxiety: Mean shifts with repeated assessment. Journal of Personality and Social Psychology, 71, 352-363. doi:10.1037/0022-3514.71.2.352 Mathews, A. (1990). Why worry? The cognitive function of anxiety. Behavior Research and Therapy, 28, 455-468. doi:10.1016/0005-7967(90)90132-3 Meyer, T. J., Miller, M. L., Metzger, R. L., & Borkovec, T. D. (1990). Development and validation of the Penn State Worry Questionnaire. Behavior Research and Therapy, 28, 487-495. doi:10.1016/0005-7967(90)90135-6 Mischel, W. (1977). On the future of personality measurement. Ame- rican Psychologist, 34, 246-254. doi:10.1037/0003-066X.32.4.246 Radloff, L. S. (1977). The CES-D scale: A self-report depression scale for research in the general population. Applied Psychological Meas- urement, 1, 385-401. doi:10.1177/014662167700100306 Ruscio, A. M., & Borkovec, T. D. (2004). Experience and appraisal of worry among high worriers with and without generalized anxiety disorder. Behavior Research and Thera py, 42, 1469-1482. doi:10.1016/j.brat.2003.10.007 Schuerger, J. M., Zarrella, K. L., & Hotz, A. S. (1989). Factors that influence the temporal stability of personality by questionnaire. Journal of Personality and Social Psychology, 56, 777-783. doi:10.1037/0022-3514.56.5.777 Spielberger, C. D., Gorsuch, R. L., Lushene, R., Vagg, P. R., & Jacobs, G. A. (1983). Manual for the State-Trait Anxiety Inventory. Palo Alto, CA: Consulting Psychologists Press. Spitzer, R. L., Kroenke, K., Williams, J. B., & Lowe, B. (2006). A brief measure for assessing generalized anxiety disorder: The GAD-7. Ar- chives of Internal Medicine, 166, 1092-1097. doi:10.1001/archinte.166.10.1092 Stober, J. (1998). Reliability and validity of two widely-used worry questionnaires: Self-report and self-peer convergence. Personality and Individual Differe n ces, 24, 887-890. doi:10.1016/S0191-8869(97)00232-8 Tallis, F., Eysenck, M., & Mathews, A. (1991). Elevated evidence requirements and worry. Personality and Individual Differences, 12, 21-27. doi:10.1016/0191-8869(91)90128-X Windle, C. (1954). Test-retest effect on personality questionnaires. Educational and Psychological Me asurement, 14, 617-633. doi:10.1177/001316445401400404
|