Food and Nutrition Sciences
Vol.4 No.9A(2013), Article ID:36488,13 pages DOI:10.4236/fns.2013.49A1021
Plasma Phospholipid Omega-3 Fatty Acids and Freshwater Fish Consumption in the Brazilian Amazon*
![]()
1Department of Biology, University of Ottawa, Ottawa, Canada; 2CINBIOSE, Université du Québec à Montréal (UQ`AM), Montréal, Canada; 3School of Dietetics and Human Nutrition, McGill University, Montreal, Canada; 4Faculdade UnB Planaltina, Universidade de Brasília, Planaltina, Brazil; 5Centre de recherche du CHU de Québec, CHUL, Axe Santé Publique et Pratiques Optimales en Santé, Québec, Canada.
Email: #aphilibe@uottawa.ca
Copyright (c) 2013 Aline Philibert et al. This is an open access article distributed under the Creative Commons Attribution License, which permits unrestricted use, distribution, and reproduction in any medium, provided the original work is properly cited.
Received May 14th, 2013; revised June 14th, 2013; accepted June 21st, 2013
Keywords: Plasma Phospholipid Fatty Acids; Omega-3; EPA; DHA; Fish Consumption; Gender; Brazil; Amazon
ABSTRACT
Background: Amazonian riverside communities consume large quantities of freshwater fish, comparable to marine fish consumption of Inuit, Scandinavian and Japanese populations. Few studies have considered the relation of high freshwater fish consumption and intake of omega-3 fatty acids (FA). Objective: The objective of the present study was to determine the profile of the concentrations of plasma phospholipid FAs and its relation with freshwater fish intake in 12 riverside communities in the Tapajós River basin (State of Pará, Brazilian Amazon). Design: This cross-sectional study included 333 adults (15 - 86 years old). Fish meal frequency was determined using a 7-day interview-administered dietary recall questionnaire. Fish were categorized as piscivorous and non-piscivorous fish on trophic level. Plasma phospholipid FAs were measured by capillary gas-liquid chromatography. Results: Participants consumed 5 to 6 fish meals a week, with twice as many non-piscivorous fish than piscivorous fish (4.4 fish/week vs 2.2 fish/week, respectively). The omega-3 FA levels in plasma phospholipids were low (EPA + DHA = 31.21 mg/L; %EPA + DHA = 2.59%). Omega-3 FAs increased with frequency of fish intake, and particularly with piscivorous fish, controlling for sociodemographic, anthropometric and lifestyle characteristics. DHA levels were greater in women than in men. Conclusions: Omega-3 FA in this Amazonian population increased with fish consumption, but although they consumed freshwater fish almost daily, the concentrations of omega-3 FA were relatively low and comparable to fish-eater communities for which fish is not a dietary mainstay. It is possible that nutrients present in marine, but not in certain freshwater fish species, may facilitate absorption of omega-3 FA. Sex and/or gender differences must be taken into account when assessing the relationship between fish consumption and plasma phospholipid omega-3 FA levels.
1. Introduction
Over the past 20 years, there has been a growing recognition of the importance of omega-3 fatty acids (FA) for health. Fish and seafood consumption have been encouraged as part of a healthy diet despite the fact that certain fish accumulate contaminants such as mercury (Hg). Although strong evidence supports fish consumption as a source for omega-3 FA intake, notable differences exist between marine and freshwater fish. Indeed, many studies have shown that the magnitude of the relation between fish intake and omega-3 levels in blood varies substantially [1-14]. Most of our knowledge on the relation between fish consumption and omega-3 FAs was obtained from populations with high levels of consumption of marine fish, such as Inuit, Scandinavian and Japanese populations [1,2,4,5,8,10,13,15-17]. Few studies have specifically examined this question with regard to freshwater fish eating populations [18-20], and for the majority of these, fish consumption was not a traditional dietary practice [3,5,7,18,20,21].
For many communities in the Brazilian Amazon, freshwater fish is a dietary mainstay and a large proportion of persons living in riverside villages eat fish daily or at least several times per week [22-26]. Many studies have been published on Hg exposure through fish consumption in this region (for review see [27]), but, to date, no study has examined omega-3 FA profiles and fish consumption in this population. The objectives of the present study, carried out in riverside communities of the Tapajós Basin in the Brazilian Amazon, were to determine the general profile of long-chain omega-3 FA and other FA in plasma phospholipids and to examine their relation with fish consumption in both genders.
2. Experimental Methods
The present study was part of the Caruso Project, a large interdisciplinary and ecosystemic investigation in the Lower Tapajós River valley of the Brazilian Amazon (http://www.unites.uqam.ca/gmf/caruso/caruso_home.htm). This project examined Hg sources and dynamics in the environment, human exposure and health effects, with a view to maximizing the use of nutritional local resources and minimizing Hg exposure [27-29].
2.1. Study Population and Design
The study population was recruited from 12 villages located in the Lower Tapajós River Basin on the main channel and meanders of the river (
The cross-sectional design, which used convenience sampling, is described in Lemire et al. [30]. Recruitment was carried out by house-to-house invitation and at village meetings in April 2006. The research project was explained and persons of 15 years and older were invited to participate on a voluntary basis. The study was carried out from May to July 2006 at a technical school in the nearby city of Itaituba. Villagers who accepted to participate in the study were scheduled and boats were sent to the villages to bring them to the city.
Of the 450 persons who participated in the study,
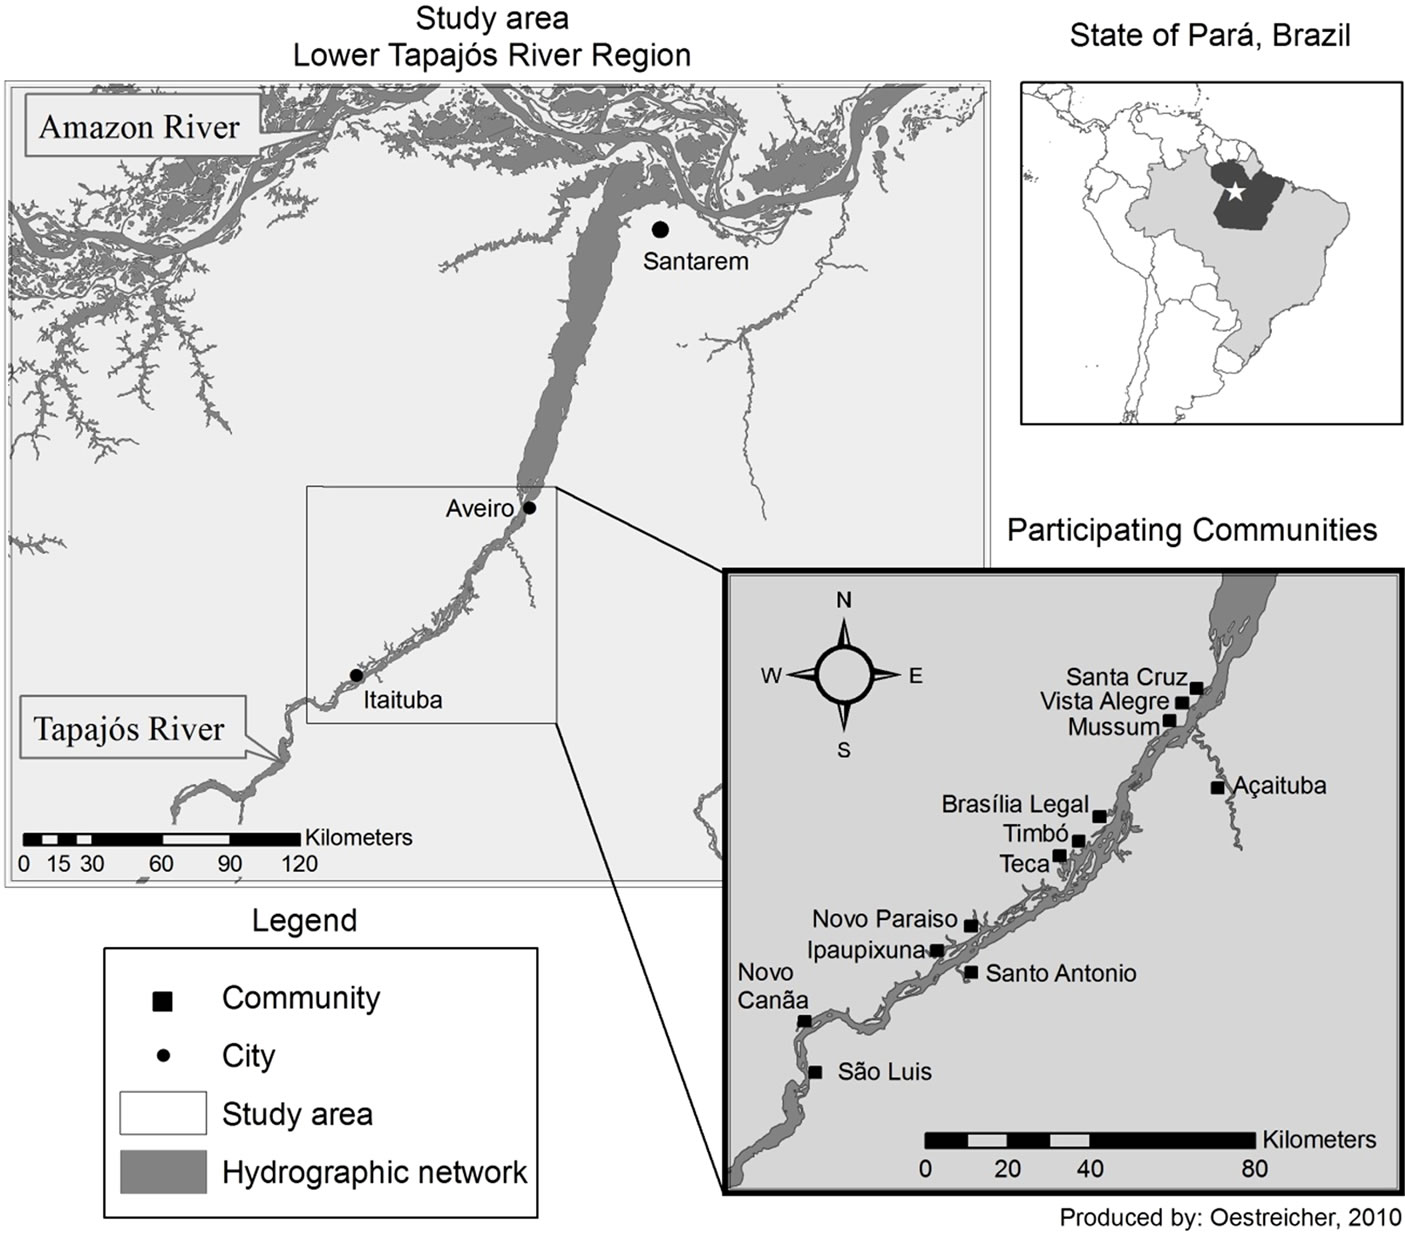
Figure 1. Map of the study area with the 12 riverside communities along the Tapajós River (State of Pará, Brazilian Amazon).
blood samples were taken from 448 persons and 348 were analyzed for plasma total phospholipid FA. From these, ten (10) pregnant or lactating women were excluded from the present analyses since omega-3 FAs are preferentially released to the fetus or breast milk. A further five (5) persons who reported diabetes were likewise excluded from the analyses to avoid extreme values of omega-3 FAs. The present analyses are based on a total of 333 persons from nine (9) villages.
The study was approved by the Ethics Review Boards of the University of Quebec at Montreal, of the Federal University of Rio de Janeiro and of the Faculty of Pharmaceutical Sciences of the University of São PauloRibeirão Preto. All participants signed an informed consent form, which was read to them. There was no remuneration for study participation.
2.2. General Characteristics of the Study Population
A questionnaire, including socio-demographic characteristics (sex, age, education, etc.), lifestyle habits (alcohol and cigarette intake) and a series of questions on the history of diagnosed illness, was administered by trained Brazilian interviewers. Anthropometric measures, taken by a nurse, included height and body weight with light clothing. Body mass index (BMI) was calculated in kg·m−2. Current medication was noted by research assistants when visiting the participants at their home before travelling to the city of Itaituba; it was later classified by medication family.
2.3. Fish Consumption
An interview-administered 7-day food frequency questionnaire was used to survey frequency of fish intake (Passos et al. [31]). For each meal of the previous week, participants were asked whether they had eaten fish and if so, to name the fish. It should be noted that persons living in this area have an extensive knowledge of fish and no one was unable to identify the different fish by their common name. Since quantities of FA vary among fish species, for the present analyses fish were classified into piscivorous or non-piscivorous fish according to their feeding habits and trophic classification [32]. Total fish consumption was calculated as the sum of piscivorous and non-piscivorous fish.
2.4. Blood Sampling
On the day of the interview, a trained Brazilian nurse collected a 6-ml blood in “trace metal free” evacuated tubes (BD Vacutainer®) containing heparin as anticoagulant. For plasma separation, blood samples were centrifuged (800 × g for 6 min). Plasma fractions were then pipetted into Eppendorf tubes (2 ml), previously cleaned in a class 100 clean room, and immediately frozen at −20˚C. They were stored at −80˚C until analysis at McGill University (Canada).
2.5. Plasma Phospholipid FA Analysis
Total plasma phospholipid FA were measured using a modified method of Bondia-Pons et al. [33] Briefly, FA were extracted from 200 mL of plasma using the method of Folch et al. [34] followed by addition of internal standard 1,2-diheptadecanoyl-sn-glycero-3-phosphoethanolamine (C17PE) (Avanti Polar Lipids, Alabama, USA). Phospholipids were separated using solid phase extraction with 100 mg aminopropyl BondElut cartridges (Varian Inc., CA, USA) under vacuum. Elution was according to Bondia-Pons et al. [33] with addition of a final wash step using 3 × 0.5 mL chloroform/methanol/0.8 M sodium acetate (60:30:4.5 v/v/v). Eluant was then evaporated under nitrogen and reconstituted in 1.5 mL of methanol. Phospholipids were methylated using trifluoridemethanol for 90 min at 100˚C, evaporated and dissolved in hexane [33]. Samples (1 mL) were injected in splitless mode into a gas chromatograph system (Varian CP-3800, Varian Inc., CA, USA) equipped with a flame ionization detector, a Varian 8400 autosampler and a capillary column (60 m × 250 mm I.D., 0.25 mm film thickness, CP-8824, Varian Inc., CA, USA). The injector and detector temperature were maintained at 260˚C with hydrogen as the carrier gas (16.6 mmHg) while the oven temperature increased from 60˚C to 230˚C with run time of 75 min. The methyl ester peaks were determined by comparison of their relative retention times with those of a mixture of FAMEs (FA methyl ester) standards (NuChek Prep, MN, USA). Quantification of the FAMEs was calculated relative to the amount of the internal standard C17PE recovered using Galaxie software version 1.9.3.2 (Varian Inc., CA, USA)
Omega-3 FA (alpha-linolenic acid-ALA, eicosapentaenoic acid-EPA, docosahexaenoic acid-DPA, docosapentaenoic acid-DHA), omega-6 FA (linoleic acid-LA, arachidonic acid-AA), sum of polyunsaturated FA omega-3 and omega-6 (PUFA), sum of saturated FA (SFA) and sum of monounsaturated FA (MUFA), as well as their percentage of total plasma phospholipid FA, were considered in the present study. The concentration of each plasma phospholipid FA was expressed as absolute concentration (mg/L) and as percentage of total plasma phospholipids FA, allowing for comparisons with other studies.
2.6. Statistical Analysis
Baseline characteristics were calculated as mean, minimum-maximum, and percentiles (25th, 50th and 75th) for continuous variables, and as total number and percentage for categorical variables. Since most variables were not normally distributed, non-parametric ANOVA analyses were preferentially performed when comparing categories (Wilcoxon/Kruskall-Wallis Rank Sums test, Chi square αerror = 0.05). The correlations between plasma phospholipid FAs were assessed with non-parametric correlation analysis (Spearman’s Rho test, p ≤ 0.05). To compare two categorical variables (i.e. sex), contingency analysis with Pearson’s Chi square test was carried out (p ≤ 0.05).
The relation between FA concentration in plasma phospholipids as the response variable, and frequency of fish intake as the predictive variable, was assessed by multiple linear regression, controlling for age (years), sex, body mass index (BMI) in kg·m−2, alcohol consumption (Yes or No), current smoking status (Yes or No), and cardiac medication intake (Yes or No). Two main regression models were performed with frequency of fish consumption. The first regression model included simultaneously piscivorous and non-piscivorous fish consumption, while the second model included total fish.
The box plot technique, with analytical procedure for detecting extreme outliers (Grubbs’ Test) from the distribution of residuals in models, was used. The limit of significance of Grubbs’ Test was set at ≤ 0.05.
Analyses were performed using SPSS version 19 (SPSS Inc., Chicago, IL) and JMP software package version 9 (SAS institute INC, Cary, NC, USA).
3. Results
3.1. General Characteristics of the Study Population
The general characteristics of the 333 persons (174 men and 159 women) included in the present analyses are summarized in Table 1. Their age ranged from 15 to 86 yrs; mean age was 42 yrs (39 and 43 yrs for women and men, respectively). BMI averaged 24.6 kg·m−2 and was similar in men and women (Wilcoxon/Kruskall-Wallis Rank Sums test, p = 0.339). BMI was significantly higher in women of 45 years old and more, compared to younger women (Wilcoxon/Kruskall-Wallis Rank Sums test, p = 0.003). No relation with age was observed for BMI in men. More than half of the participants (54.8%) reported drinking alcohol (110 men and 72 women), but most were occasional drinkers (37.53%) or regular drinkers (45.34%). A quarter of the participants (25%) were current smokers (58 men and 24 women), but the number of cigarettes/day was low (mean = 8; median = 6). Although smoking status was not related to age, young people (less than 45 yrs) drank significantly more than older ones (Pearson’s Chi square test, p = 0.63 and

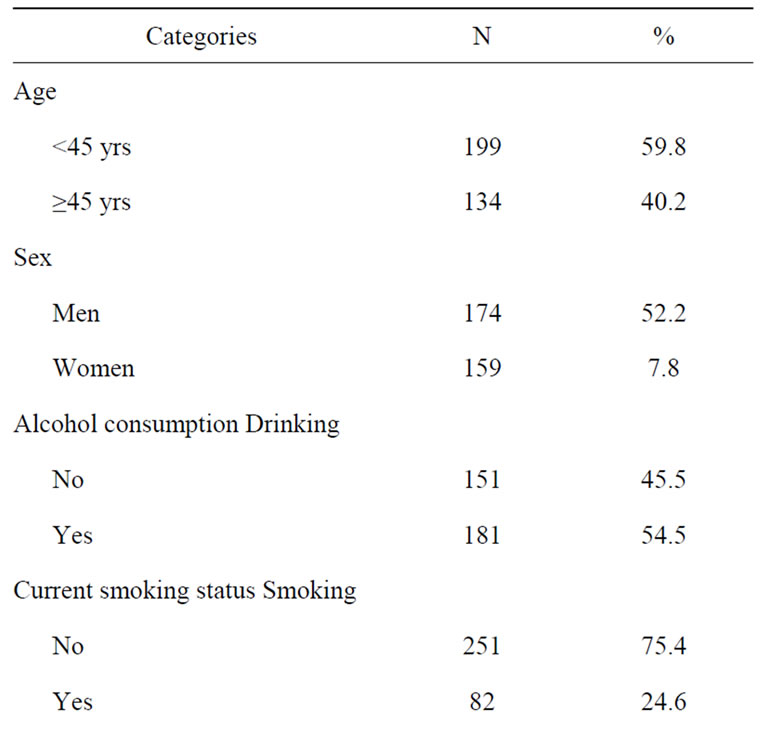
Table 1. General characteristics of the study group.
<0.0001, respectively). Cardiac medication was taken by 11% of the participants (15 men and 23 women).
3.2. Fish Consumption Frequency
Overall, the mean frequency of non-piscivorous fish consumption was twice as high as piscivorous fish (mean (median): 4.4 (2) fish/week vs 2.2 (2) fish/week, respectively) (Wilcoxon/Kruskall-Wallis Rank Sums test, p = 0.001). The mean frequency of total fish consumption was 5.6 fish/week (median = 5 fish/week). Aracu (Shizodon sp.), pescada (Plagioscion sp.), pacu (Mylossoma sp.), jaraqui (Semaprochiloidus sp.) and caratinga (Geophagus sp.) were the most commonly consumed species. The consumption frequency for total, piscivorous and non-piscivorous fish was similar between men and women and between age groups (Wilcoxon/ Kruskall-Wallis Rank Sums test, p > 0.10). Comparable results were observed on the species level, with the exception of caratinga and pacu, which were preferentially consumed by women and older persons (≥45 yrs and more), respectively. For both men and women, the frequency of fish consumption was not related to BMI, alcohol consumption or current smoking status, (Wilcoxon/
Kruskall-Wallis Rank Sums test, p > 0.10). Persons taking cardiac medication consumed fish at the same frequency as the rest of the participants.
3.3. Concentrations of Plasma Phospholipids FA
The general characteristics of concentrations of plasma phospholipid FA in the study group are presented in Table 2. DHA presented the highest concentrations, while ALA showed the lowest. DHA concentrations were on

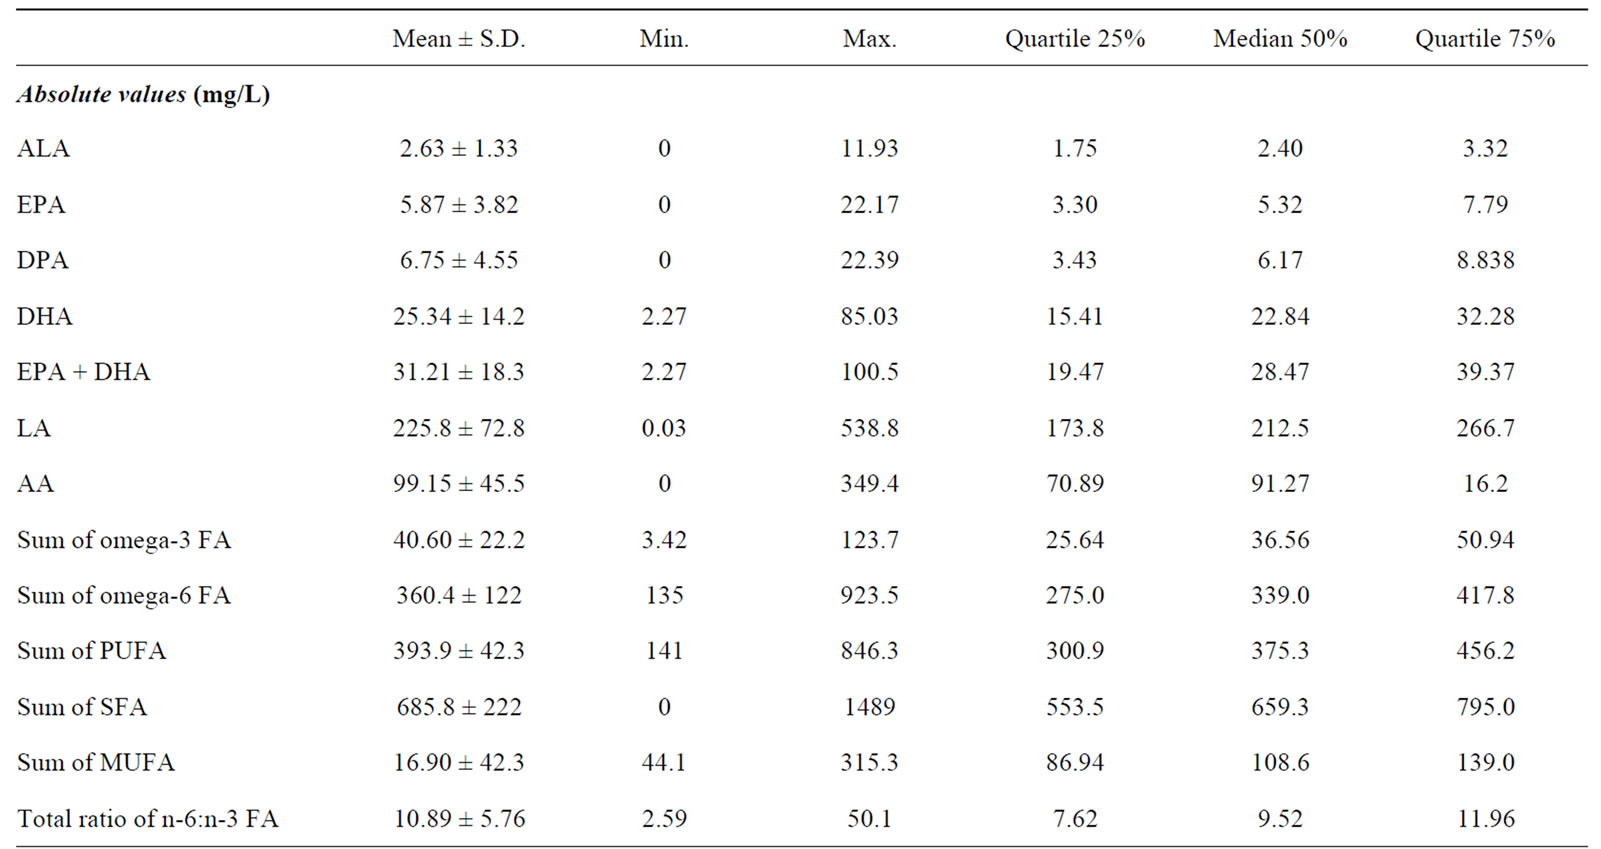
Table 2. Fatty acid profiles in plasma phospholipids in the study group.
average 4.5 times higher than those of EPA. The concentrations of EPA, DPA, and DHA in plasma phospholipids were highly correlated (0.55 < Rho < 0.88) in both men and women, and in the two age groups. Similar results were found for percent values but with slightly lower rho coefficients (from 0.57 to 0.74).
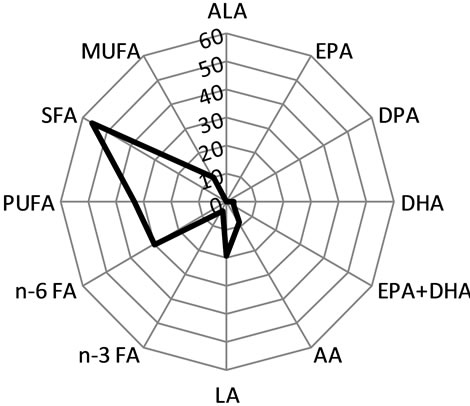
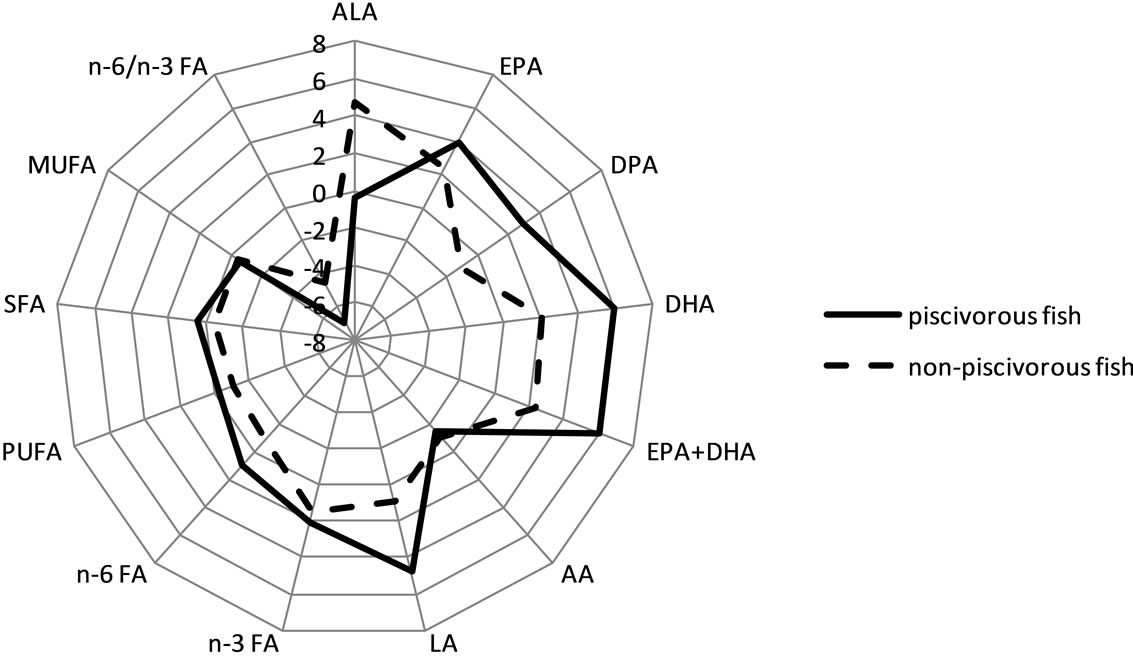
DHA and %DHA were significantly higher in women than in men (Wilcoxon/Kruskall-Wallis Rank Sums test, p = 0.0005 and p = 0.05, respectively). After adjusting for age, BMI, alcohol consumption, current smoking status and cardiac medication, the difference of DHA and %DHA levels between women and men gained in significance (Wilcoxon/Kruskall-Wallis Rank Sums test, p ≤ 0.0001 and p = 0.007, respectively). ALA, sum of EPA and DHA (EPA + DHA) and its percentage (%EPA + DHA), and omega-3 FA were also greater in women than in men (Wilcoxon/Kruskall-Wallis Rank Sums test, p = 0.015, 0.001, 0.046, and 0.002 respectively), while no sex difference was observed for %ALA, DPA, %DPA, EPA, %EPA, %omega-3 FA and the total n-6:n-3 FA ratio. Women showed higher concentrations in LA and AA, sum of omega-6 FA, SFA and MUFA, compared to men (Wilcoxon/Kruskall-Wallis Rank Sums test, p ≤ 0.05). Although some FA showed differences between women and men when taken individually, the general profile of FA was similar in women and men (Figure 2).
Figure 3 shows the age-related increase in DHA and in EPA, which were similar in men and women (interaction term sex * age, p > 0.05).
Comparable associations were generated for both absolute and percentage values of any omega-3 FAs, except for %ALA, which was not related with age. AA, sum of omega-6 FA, SFA, MUFA and PUFA increased with age too, except for the total n-6:n-3 FA ratio, which decreased in older persons. In percentage values, there was an increase in %AA and %MUFA with age and a decrease in %omega-6 FA and %PUFA.
A positive relation between all individual omega-3 FA measures, PUFA, SFA, MUFA and BMI was present in women after controlling for age, while this was not the case for men.
Men consuming alcohol presented lower concentrations of EPA, %EPA, %DPA, and %MUFA (Wilcoxon/ Kruskall-Wallis Rank Sums test, p ≤ 0.05) than men who did not. The total n-6:n-3 FA ratio was greater among drinkers (Wilcoxon/Kruskall-Wallis Rank Sums test, p = 0.03). No relation between DHA, SFA and alcohol consumption was found in men. Fewer women than men reported drinking alcoholic beverages, but there was no difference in any FA between women drinkers and nondrinkers (Wilcoxon/Kruskall-Wallis Rank Sums test, p > 0.05).
No significant relation was found between smoking status and any plasma phospholipid FA in men and in
 women
women  men
men
Figure 2. Profile of mean percentage of plasma phospholipid FA in women and in men. Abbreviations: FA, fatty acid; ALA, alpha-linolenic acid (C18:3 n-3); EPA, eicosapentaenoic acid (C20:5 n-3); DPA: docosapentaenoic acid (C22:5 n-3); DHA, docosahexaenoic acid (C22:6 n-3); LA: linoleic acid (C18:2 n-6); AA: arachidonic acid (C20:4 n-6); n-3 FA, sum of omega-3 FA = C18:3 (n-3) + C20:5 + C22:5 + C22:6; sum of omega-6 FA = C18:2 + C18:3 (n-6) + C20:2 + C20:3 + C20:4 + C22:4; SFA, saturated FA; MUFA, monounsaturated FA; PUFA, polyunsaturated FA.
women (Wilcoxon/Kruskall-Wallis Rank Sums test, p > 0.05).
With the exception of ALA, persons taking cardiac medication presented higher values of EPA, DPA, DHA, EPA + DHA, LA, AA, sum of omega-3 FA, omega-6 FA, PUFA, SFA, and MUFA (Wilcoxon/Kruskall-Wallis Rank Sums test, p ≤ 0.05).
3.4. Plasma Phospholipid FA and Frequency of Fish Consumption
Table 3 shows the results of the multiple linear regression models with plasma phospholipid FAs as response variables and fish consumption frequency as predictive factors, when controlled for age, sex, BMI, alcohol consumption, current smoking status, cardiac medication intake and villages. EPA, DHA, EPA + DHA and omega-3 FA significantly increased with fish consumption frequency in the model with both piscivorous and non-piscivorous fish consumption and in total fish consumption model (for both absolute and percent values).
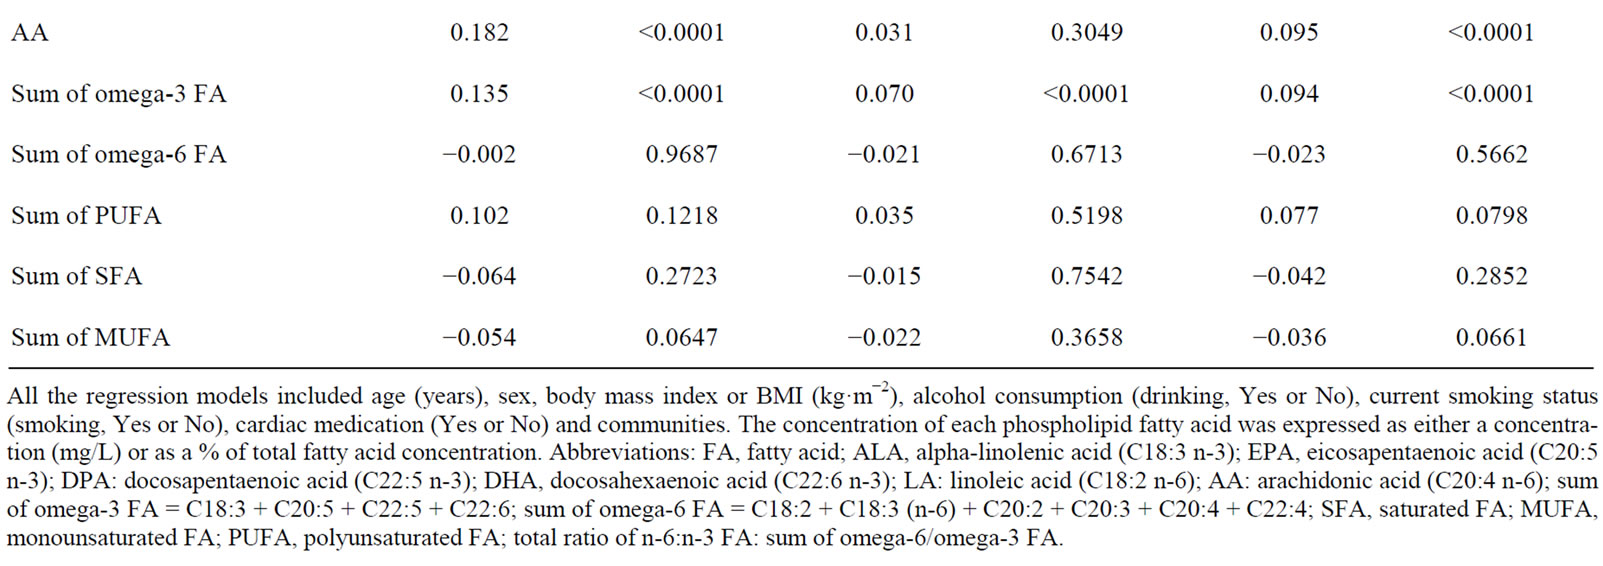

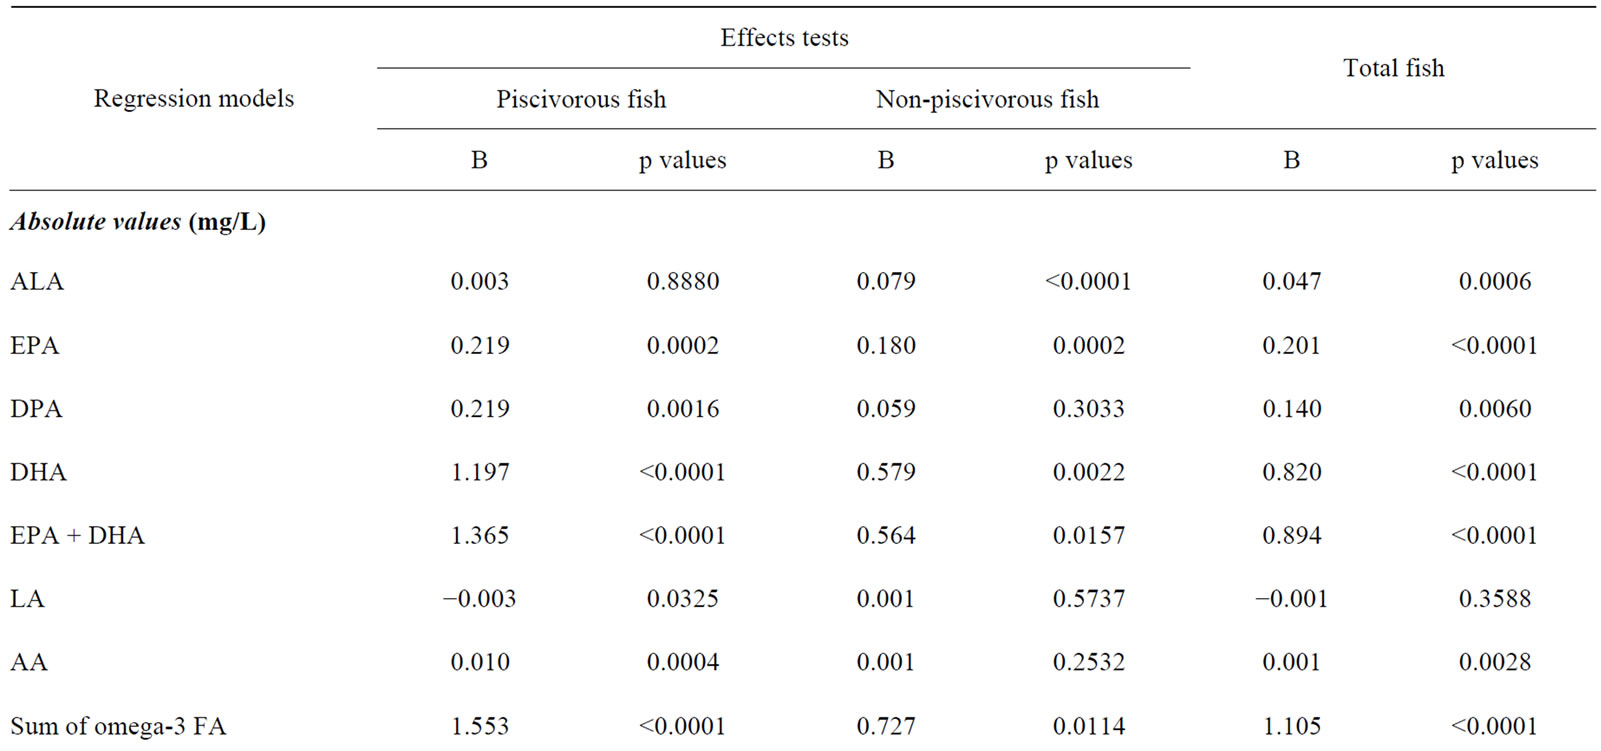
Table 3. Results of multivariate linear regression models with FA in plasma phospholipids as response variable and frequency of fish intake as predictive variable.
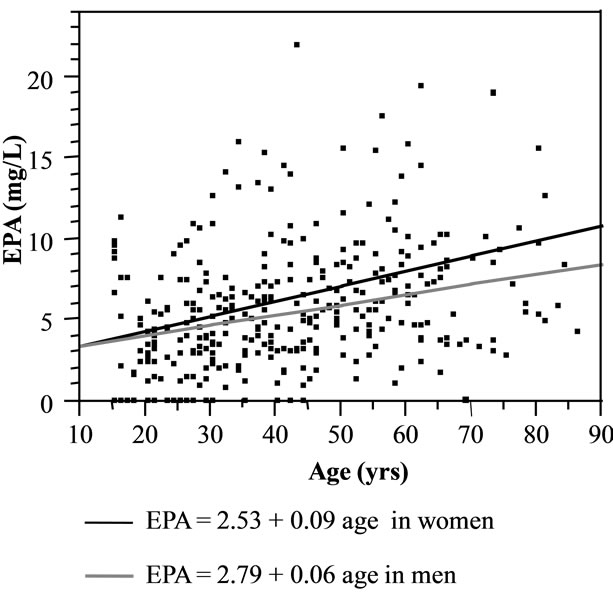
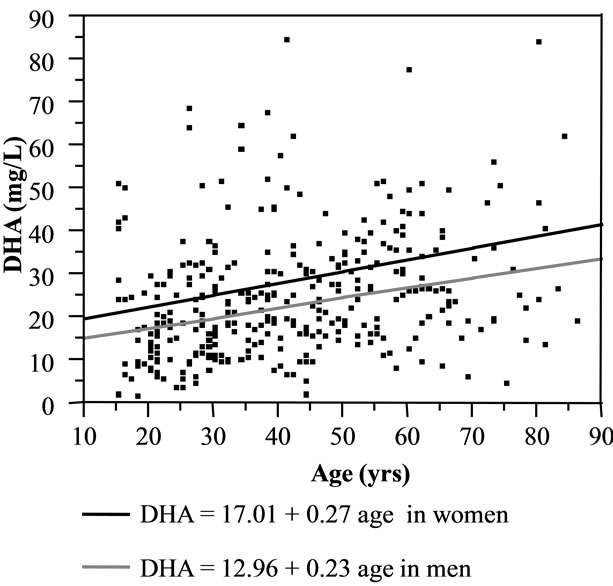
Figure 3. Scatterplots of association between concentrations of EPA and DHA in plasma phospholipids and age for men and women. Abbreviations: EPA, eicosapentaeonic acid (20:5 n-3); DHA, docosahexaenoic (22:6 n-6).
These relations were stronger for piscivorous fish consumption than for non-piscivorous fish. Figure 4 shows the relation between EPA, DHA and the frequency of piscivorous and non-piscivorous fish intake.
The scatterplots did not suggest any plateau effect of fish consumption frequency upon the concentrations of any omega-3 FA. In both men and women, the frequency of fish consumption in both models contributed a similar proportion (R2) to DHA and to EPA (46.06 vs 44.96 in piscivorous and non-piscivorous fish model; 45.43 vs 45.27 in total fish model). Similar results were observed for %DHA, %EPA, EPA + DHA, and %EPA + DHA based models. ALA and %ALA showed a positive relation with the frequency of non-piscivorous and total fish consumption, while there was no significant relation with piscivorous fish consumption. No association was found between DPA, %DPA and non-piscivorous fish. The n-6:n-3 ratio decreased with increasing piscivorous fish or total fish consumption. No relation was found between other FA and the fish consumption frequency, except for individual omega-6 FA (LA, %LA, %AA, and AA), which significantly increased with piscivorous fish and/or total fish consumption.
Figure 5 shows the results of the multiple linear regression analyses between FA and frequency of fish consumption (piscivorous and non-piscivorous fish model). In general, the relations between omega-3 FA and frequency of fish consumption were stronger when omega-3 FAs were expressed as a percent value than as an absolute value.
4. Discussion
Although this Amazonian population consumed, on average, 5 to 6 of fish meals per week, omega-3 FA concentrations were low compared to other studies that have used similar analytical techniques [2-5,10,11,35]. This is reflected in the relative proportion of omega-3 FA to total FA, which can be compared from one study to the next. In this population, the relative proportion of omega-3 FA is lower than those reported for moderate to high freshwater fish consumers [3,4,9,11,12] and for marine fish consumers [1,2,5,8,10,13,15]. It is however comparable to or slightly higher than those reported for low to moderate freshwater fish eating communities [6,7, 15,18].
In the present study, fish diet consisted exclusively of freshwater fish. For the most part, freshwater fish are leaner than marine fish and thus contribute to lower intake in omega-3 FA [36-40]. Here, the contribution of freshwater fish to omega-3 FA intake may be reduced, since the most commonly consumed fish were non-piscivorous, which are known to be low in omega-3 FA. Indeed, due to their low position in the aquatic food chain, non-piscivorous fish accumulate much less omega-3 FA than do piscivorous fish [38]. Because fish cooking method was not recorded in the questionnaire, its influence on the low omega-3 FA levels in phospholipids could not be evaluated.
This Amazonian population presents a high ratio of n-6:n-3 FA (~11:1) relative to Inuit, Indian and Japan communities (from 4 to 6.5 [41-43]) but comparable to those observed in low to moderate fish eaters in Quebec (from 9.7 to 1 [6,7]). This n-6:n-3 FA ratio is however lower than those reported for western diets, which regularly exceed 15:1 in Europe and North America [42,44]. It would be useful for future studies to identify the sources of omega-6 FA in these communities.
The sex-related differences observed for DHA corroborate other population-based studies [5,6,11,35] that show greater DHA concentrations in women compared to men. The difference cannot be explained by fish diet because fish consumption was similar in men and women
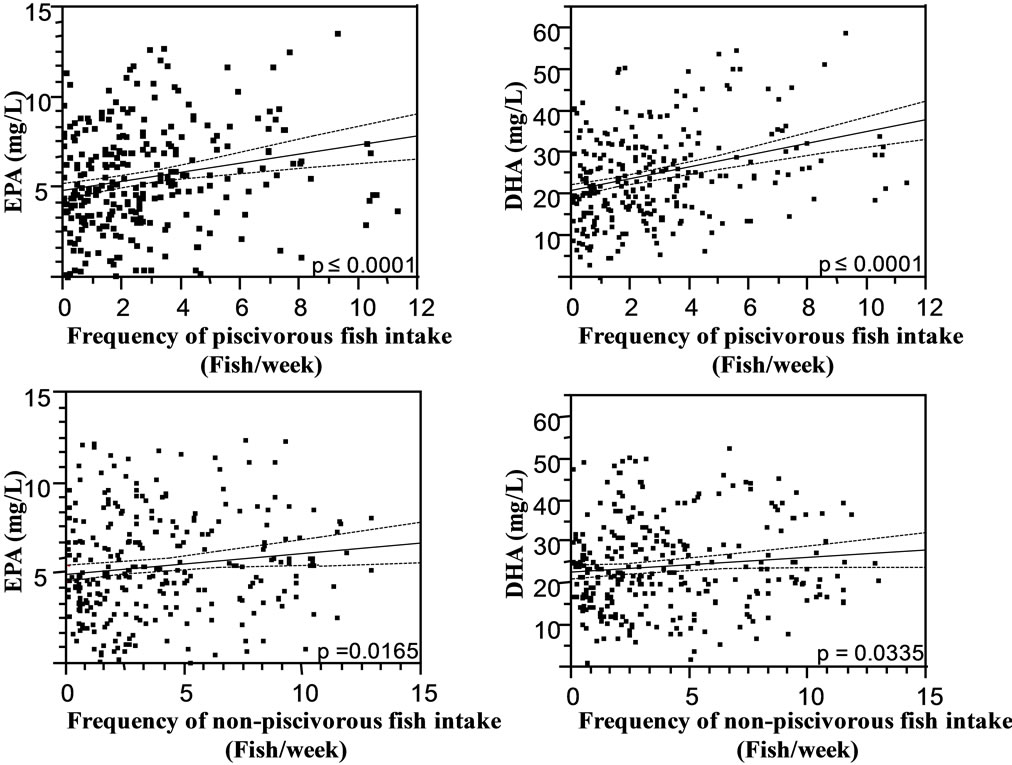
Figure 4. Leverage plots of EPA and DHA (mg/L) versus the frequency of piscivorous and non-piscivorous fish intake during the 7 days preceding the interview. All multivariate linear regression models were controlled for age (years), sex, body mass index or BMI (kg·m−2), alcohol consumption (drinking, Yes or No), current smoking status (smoking, Yes or No), cardiac medication (Yes or No) and communities. Abbreviations: EPA, eicosapentaenoic acid (20:5 n-3); DHA, docosahexaenoic (22:6 n-6).
regardless of age. The age-related increase in DHA and %DHA in the present study were similar in men and women. There is indeed some evidence that men and women differ in their ability to synthesize DHA. Some studies have shown that women have a better capacity to synthesise DHA from ALA [45-49] and/or a lower facility to retro-convert DHA into EPA than men [48,50,51]. Alternatively, reproductive hormones can modify DHA concentrations by altering the expression of desaturase and elongase enzymes [45,51,52].
The observation of an association between alcohol intake and EPA in men, but not with DHA, suggests that alcohol facilitates DHA peroxidation or its retroconversion to EPA [46,49] as suggested by Saadatian-Elahi et al. [12].
The present study showed that the frequency of freshwater fish intake was reflected in the concentration of plasma phospholipid omega-3 FA, even after controlling for age, sex, BMI, alcohol consumption, current smoking status, cardiac medication intake and communities. The relation between plasma phospholipid omega-3 FA and piscivorous fish was much stronger than for non-piscivorous fish, even though non-piscivorous fish were consumed more than twice as much than piscivores. It is noteworthy that at comparable low plasma omega-3 FA levels, in [7] and [18] the authors did not observe a positive relation between freshwater fish intake and omega-3 FA, whereas in the present study of persons who eat fish almost daily, there was a strong relation. The strongest association was found between piscivorous fish, total fish and DHA, whereas weaker associations were found with EPA, similarly to previous reports [11,12].
Several studies have shown a plateau effect of intake frequency of marine fish to omega-3 FA levels after about two meals of fish per week [10]. We did not observe a plateau, although the present mean intake frequency of fish was considerably greater than 2/week. This could be explained by the lower omega-3 FA content in freshwater fish compared with that in marine fish.
5. Conclusion
Although the participants in the study consumed freshwater fish daily or several times per week, the concentrations of omega-3 FA in plasma phospholipids were relatively low and comparable to fish-eater communities for whom fish is not a dietary mainstay. This may support the hypothesis that nutrients in marine fish, but not in certain freshwater fish, facilitate omega-3 absorption. The low contribution of freshwater fish to omega-3 FA could explain the absence of a plateau effect of fish intake to omega-3 FA levels, which is generally observed for marine fish. Nonetheless, the frequency of freshwater fish intake (especially piscivorous fish) was reflected in the concentration of plasma phospholipid omega-3 FA. Significant differences in omega-3 FA levels were observed for sex, age, alcohol consumption, medication and communities, and these factors should be considered as
 (a)
(a) (b)
(b)
Figure 5. Distribution of t values from the multivariate linear regression analyses between FA in phospholipids (absolute (a) and relative values (b)) and frequency of fish intake. Abbreviations: FA, fatty acid; ALA, alpha-linolenic acid (C18:3 n-3); EPA, eicosapentaenoic acid (C20:5 n-3); DPA: docosapentaenoic acid (C22:5 n-3); DHA, docosahexaenoic acid (C22:6 n-3); LA: linoleic acid (C18:2 n-6); AA: arachidonic acid (C20:4 n-6); n-3 FA, sum of omega-3 FA = C18:3 + C20:5 + C22:5 + C22:6; n-3 FA, sum of omega-6 FA = C18:2 + C18:3 (n-6) + C20:2 + C20:3 + C20:4 + C22:4; SFA, saturated FA; MUFA, monounsaturated FA; PUFA, polyunsaturated FA. These relations were similar for men and women and among age groups, except for DPA and %DPA in women and EPA and DPA in older men (>45 y), which did not show any relation with fish consumption.
co-variates in the omega-3 FA based models.
6. Acknowledgements
We would like to express our gratitude the study participants for their time and interest in our research. We would like to sincerely thank Evangelie Mosconas the summer NSERC student (University McGill, Montreal) for the analyses of fatty acids, as well as the members of the CARUSO Health Team for their collaboration and support.
7. Author’s Contribution
Aline Philibert is the first author, she designed the fatty acid collection and organized its analysis. She merged all the fatty acid data with the original database. She carried out an exhaustive review of the literature, performed all statistical analyses and interpretation and was responsible for writing the article.
Myriam Fillion coordinated the fieldwork, collected all data and set up a general database. She participated in the writing of the article, particularly for the aspects of study design, results and discussion.
Hope Alberta Weiler designed, coordinated and supervised fatty acid data analysis in laboratory. She participated in the writing of the article, particularly for the aspects of methods and results Jason Robert DeGuire operated fatty acid data analysis in laboratory.
Carlos José Sousa Passos and Melanie Lemire participated to the collection of data in the field. They both participated in the writing of the article, particularly for the aspects of study design, results and discussion.
Donna Mergler is the principal investigator of the overall study. She was involved in all aspects of the study and the present manuscript.
The authors declare they have no competing financial interests.
REFERENCES
- M. Anttolainen, L. M. Valsta, G. Alfthan, P. Kleemola, I. Salminen and M. Tamminen, “Effect of Extreme Fish Consumption on Dietary and Plasma Antioxidant Levels and Fatty Acid Composition,” European Journal of Clinical Nutrition, Vol. 50, No. 11, 1996, pp. 741-746.
- A. Hjartaker, E. Lund and K. S. Bjerve, “Serum Phospholipid Fatty Acid Composition and Habitual Intake of Marine Foods Registered by a Semi-Quantitative Food Frequency Questionnaire,” European Journal of Clinical Nutrition, Vol. 51, No. 11, 1997, pp. 736-742. doi:10.1038/sj.ejcn.1600475
- P. Amiano, M. Dorronsoro, M. de Renobales, J. C. Ruiz de Gordoa and I. Irigoien, “Very-Long-Chain Omega-3 Fatty Acids as Markers for Habitual Fish Intake in a Population Consuming Mainly Lean Fish: The EPIC Cohort of Gipuzkoa. European Prospective Investigation into Cancer and Nutrition,” European Journal of Clinical Nutrition, Vol. 55, No. 10, 2001, pp. 827-832. doi:10.1038/sj.ejcn.1601242
- E. Dewailly, C. Blanchet, S. Gingras, S. Lemieux and B. J. Holub, “Cardiovascular Disease Risk Factors and n-3 Fatty Acid Status in the Adult Population of James Bay Cree,” The American Journal of Clinical Nutrition, Vol. 76, No. 1, 2002, pp. 85-92.
- E. Dewailly, C. Blanchet, S. Lemieux, L. Sauve, S. Gingras, P. Ayotte and B. J. Holub, “n-3 Fatty Acids and Cardiovascular Disease Risk Factors among the Inuit of Nunavik,” The American Journal of Clinical Nutrition, Vol. 74, No. 4, 2001, pp. 464-473.
- E. E. Dewailly, C. Blanchet, S. Gingras, S. Lemieux, L. Sauve, J. Bergeron and B. J. Holub, “Relations between n-3 Fatty Acid Status and Cardiovascular Disease Risk Factors among Quebecers,” The American Journal of Clinical Nutrition, Vol. 74, No. 5, 2001, pp. 603-611.
- A. Philibert, C. Vanier, N. Abdelouahab, H. M. Chan and D. Mergler, “Fish Intake and Serum Fatty Acid Profiles from Freshwater Fish,” The American Journal of Clinical Nutrition, Vol. 84, No. 6, 2006, pp. 1299-1307.
- K. Wakai, Y. Ito, M. Kojima, S. Tokudome, K. Ozasa, Y. Inaba, K. Yagyu and A. Tamakoshi, “Intake Frequency of Fish and Serum Levels of Long-Chain n-3 Fatty Acids: A Cross-Sectional Study within the Japan Collaborative Cohort Study,” Journal of Epidemiology, Vol. 15, No. 6, 2005, pp. 211-218. doi:10.2188/jea.15.211
- D. C. Cole, J. Sheeshka, E. J. Murkin, J. Kearney, F. Scott, L. A. Ferron and J. P. Weber, “Dietary Intakes and Plasma Organochlorine Contaminant Levels among Great Lakes Fish Eaters,” Archives of Environmental Health, Vol. 57, No. 5, 2002, pp. 496-509. doi:10.1080/00039890209601443
- H. Chung, J. A. Nettleton, R. N. Lemaitre, R. G. Barr, M. Y. Tsai, R. P. Tracy and D. S. Siscovick, “Frequency and Type of Seafood Consumed Influence Plasma (n-3) Fatty Acid Concentrations,” Journal of Nutrition, Vol. 138, No. 12, 2008, pp. 2422-2427. doi:10.3945/jn.108.089631
- A. A. Welch, S. A. Bingham, J. Ive, M. D. Friesen, N. J. Wareham, E. Riboli and K. T. Khaw, “Dietary Fish Intake and Plasma Phospholipid n-3 Polyunsaturated Fatty Acid Concentrations in Men and Women in the European Prospective Investigation into Cancer-Norfolk United Kingdom Cohort,” The American Journal of Clinical Nutrition, Vol. 84, No. 6, 2006, pp. 1330-1339.
- M. Saadatian-Elahi, N. Slimani, V. Chajes, M. Jenab, J. Goudable, C. Biessy, P. Ferrari, G. Byrnes, P. Autier, P. H. Peeters, M. Ocke, B. Bueno de Mesquita, I. Johansson, G. Hallmans, J. Manjer, E. Wirfalt, C. A. Gonzalez, C. Navarro, C. Martinez, P. Amiano, L. R. Suarez, E. Ardanaz, A. Tjonneland, J. Halkjaer, K. Overvad, M. U. Jakobsen, F. Berrino, V. Pala, D. Palli, R. Tumino, P. Vineis, M. Santucci de Magistris, E. A. Spencer, F. L. Crowe, S. Bingham, K. T. Khaw, J. Linseisen, S. Rohrmann, H. Boeing, U. Noethlings, K. S. Olsen, G. Skeie, E. Lund, A. Trichopoulou, E. Oustoglou, F. ClavelChapelon and E. Riboli, “Plasma Phospholipid Fatty Acid Profiles and Their Association with Food Intakes: Results from a Cross-Sectional Study within the European Prospective Investigation into Cancer and Nutrition,” The American Journal of Clinical Nutrition, Vol. 89, No. 1, 2009, pp. 331-346. doi:10.3945/ajcn.2008.26834
- A. W. Turunen, S. Mannisto, H. Kiviranta, J. Marniemi, A. Jula, P. Tiittanen, L. Suominen-Taipale, T. Vartiainen and P. K. Verkasalo, “Dioxins, Polychlorinated Biphenyls, Methyl Mercury and Omega-3 Polyunsaturated Fatty Acids as Biomarkers of Fish Consumption,” European Journal of Clinical Nutrition, Vol. 64, No. 3, 2010, pp. 313- 323. doi:10.1038/ejcn.2009.147
- K. Mina, L. Fritschi and M. Knuiman, “A Valid Semiquantitative Food Frequency Questionnaire to Measure Fish Consumption,” European Journal of Clinical Nutrition, Vol. 61, No. 8, 2007, pp. 1023-1031. doi:10.1038/sj.ejcn.1602617
- A. J. Parkinson, A. L. Cruz, W. L. Heyward, L. R. Bulkow, D. Hall, L. Barstaed and W. E. Connor, “Elevated Concentrations of Plasma Omega-3 Polyunsaturated Fatty Acids among Alaskan Eskimos,” The American Journal of Clinical Nutrition, Vol. 59, No. 2, 1994, pp. 384-388.
- L. Dahl, C. A. Maeland and T. Bjorkkjaer, “A Short Food Frequency Questionnaire to Assess Intake of Seafood and n-3 Supplements: Validation with Biomarkers,” Nutrition Journal, Vol. 10, 2011, p. 127.
- A. L. Brantsaeter, M. Haugen, Y. Thomassen, D. G. Ellingsen, T. A. Ydersbond, T. A. Hagve, J. Alexander and H. M. Meltzer, “Exploration of Biomarkers for Total Fish Intake in Pregnant Norwegian Women,” Public Health Nutrition, Vol. 13, No. 1, 2010, pp. 54-62. doi:10.1017/S1368980009005904
- C. Godin, B. Shatenstein, G. Paradis and T. Kosatsky, “Absence of Cardiovascular Benefits and Sportfish Consumption among St. Lawrence River Anglers,” Environmental Research, Vol. 93, No. 3, 2003, pp. 241-247. doi:10.1016/j.envres.2003.07.006
- G. Li, A. J. Sinclair and D. Li, “Comparison of Lipid Content and Fatty Acid Composition in the Edible Meat of Wild and Cultured Freshwater and Marine Fish and Shrimps from China,” Journal of Agricultural and Food Chemistry, Vol. 59, No. 5, 2011, pp. 1871-1881. doi:10.1021/jf104154q
- M. E. Turyk, S. P. Bhavsar, W. Bowerman, E. Boysen, M. Clark, M. Diamond, D. Mergler, P. Pantazopoulos, S. Schantz and D. O. Carpenter, “Risks and Benefits of Consumption of Great Lakes Fish,” Environmental Health Perspectives, Vol. 120, No. 1, 2012, pp. 11-18. doi:10.1289/ehp.1003396
- M. C. Belanger, M. E. Mirault, E. Dewailly, M. Plante, L. Berthiaume, M. Noel and P. Julien, “Seasonal Mercury Exposure and Oxidant-Antioxidant Status of James Bay Sport Fishermen,” Metabolism: Clinical and Experimental, Vol. 57, No. 5, 2008, pp. 630-636. doi:10.1016/j.metabol.2007.12.006
- E. da Silva Brabo, E. de Oliveira Santos, I. M. de Jesus, A. F. Mascarenhas and K. de Freitas Faial, “Mercury Contamination of Fish and Exposures of an Indigenous Community in Para State, Brazil,” Environmental Research, Vol. 84, No. 3, 2000, pp. 197-203. doi:10.1006/enrs.2000.4114
- J. Dolbec, D. Mergler, F. Larribe, M. Roulet, J. Lebel and M. Lucotte, “Sequential Analysis of Hair Mercury Levels in Relation to Fish Diet of an Amazonian Population, Brazil,” The Science of the Total Environment, Vol. 271, No. 1-3, 2001, pp. 87-97. doi:10.1016/S0048-9697(00)00835-4
- J. G. Dorea, “Fish Are Central in the Diet of Amazonian Riparians: Should We Worry about Their Mercury Concentrations?” Environmental Research, Vol. 92, No. 3, 2003, pp. 232-244. doi:10.1016/S0013-9351(02)00092-0
- C. J. Passos, D. S. Da Silva, M. Lemire, M. Fillion, J. R. Guimaraes, M. Lucotte and D. Mergler, “Daily Mercury Intake in Fish-Eating Populations in the Brazilian Amazon,” Journal of Exposure Science & Environmental Epidemiology, Vol. 18, No. 1, 2008, pp. 76-87. doi:10.1038/sj.jes.7500599
- C. J. Passos, D. Mergler, M. Lemire, M. Fillion and J. R. Guimaraes, “Fish Consumption and Bioindicators of Inorganic Mercury Exposure,” The Science of the Total Environment, Vol. 373, No. 1, 2007, pp. 68-76. doi:10.1016/j.scitotenv.2006.11.015
- C. J. Passos and D. Mergler, “Human Mercury Exposure and Adverse Health Effects in the Amazon: A Review,” Cad Saude Publica, Vol. 24 Suppl. 4, 2008, pp. s503- s520. doi:10.1177/1090198108320357
- F. Mertens, J. Saint-Charles, M. Lucotte and D. Mergler, “Emergence and Robustness of a Community Discussion Network on Mercury Contamination and Health in the Brazilian Amazon,” Health Education and Behavior, Vol. 35, No. 4, 2008, pp. 509-521.
- M. Lucotte, R. Davidson, D. Mergler, J. St-Charles and J. R. D. Guimarães, “Human Exposure to Mercury as a Consequence of Landscape Management and Socio-Economic Behaviors,” Seventh International Conference on Mercury as a Global Pollutant, Ljubljana, 28 June-2 July 2004, pp. 668-672.
- M. Lemire, D. Mergler, G. Huel, C. J. Passos, M. Fillion, A. Philibert, J. R. Guimaraes, I. Rheault, J. Borduas and G. Normand, “Biomarkers of Selenium Status in the Amazonian Context: Blood, Urine and Sequential Hair Segments,” Journal of Exposure Science & Environmental Epidemiology, Vol. 19, No. 2, 2009, pp. 213-222. doi:10.1038/jes.2008.14
- C. J. Passos, D. Mergler, E. Gaspar, S. Morais, M. Lucotte, F. Larribe, R. Davidson and S. de Grosbois, “Eating tropical Fruit Reduces Mercury Exposure from Fish Consumption in the Brazilian Amazon,” Environmental Research, Vol. 93, No. 2, 2003, pp. 123-130. doi:10.1016/S0013-9351(03)00019-7
- E. Ferreira, J. Zuanon and G. Santos, “Peixes Comerciais do Médio Amazonas,” Região de Santarém (PA), Brasília, 1998.
- I. Bondia-Pons, S. Morera-Pons, A. I. Castellote and M. C. Lopez-Sabater, “Determination of Phospholipid Fatty Acids in Biological Samples by Solid-Phase Extraction and Fast Gas Chromatography,” Journal of Chromatography A, Vol. 1116, No. 1-2, 2006, pp. 204-208. doi:10.1016/j.chroma.2006.03.023
- J. Folch, M. Lees and G. H. Sloane Stanley, “A Simple Method for the Isolation and Purification of Total Lipides from Animal Tissues,” The Journal of Biological Chemistry, Vol. 226, No. 1, 1957, pp. 497-509.
- F. L. Crowe, C. M. Skeaff, T. J. Green and A. R. Gray, “Serum n-3 Long-Chain PUFA Differ by Sex and Age in a Population-Based Survey of New ZEALAND Adolescents and Adults,” British Journal of Nutrition, Vol. 99, No. 1, 2008, pp. 168-174. doi:10.1017/S000711450779387X
- A. J. Inhamuns and M. R. Bueno Franco, “Composition of Total, Neutral, and Phospholipids in Mapara (Hypophthalmus sp.) from the Brazilian Amazonian Area,” Journal of Agricultural and Food Chemistry, Vol. 49, No. 10, 2001, pp. 4859-4863. doi:10.1021/jf0100393
- M. Kainz, M. T. Arts and A. Mazumder, “Essential Versus Potentially Toxic Dietary Substances: A Seasonal Comparison of Essential Fatty Acids and Methyl Mercury Concentrations in the Planktonic Food Web,” Environmental Pollution, Vol. 155, No. 2, 2008, pp. 262-270. doi:10.1016/j.envpol.2007.11.021
- M. Kainz, K. Telmer and A. Mazumder, “Bioaccumulation Patterns of Methyl Mercury and Essential Fatty Acids in Lacustrine Planktonic Food Webs and Fish,” The Science of the Total Environment, Vol. 368, No. 1, 2006, pp. 271-282. doi:10.1016/j.scitotenv.2005.09.035
- K. R. Mahaffey, “Fish and Shellfish as Dietary Sources of Methylmercury and the Omega-3 Fatty Acids, Eicosahexaenoic Acid and Docosahexaenoic Acid: Risks and Benefits,” Environmental Research, Vol. 95, No. 3, 2004, pp. 414-428. doi:10.1016/j.envres.2004.02.006
- K. R. Mahaffey, R. P. Clickner and R. A. Jeffries, “Methylmercury and Omega-3 Fatty Acids: Co-Occurrence of Dietary Sources with Emphasis on Fish and Shellfish,” Environmental Research, Vol. 107, No. 1, 2008, pp. 20- 29. doi:10.1016/j.envres.2007.09.011
- D. Pella, G. Dubnov, R. B. Singh, R. Sharma, E. M. Berry and O. Manor, “Effects of an Indo-Mediterranean Diet on the Omega-6/Omega-3 Ratio in Patients at High Risk of Coronary Artery Disease: The Indian Paradox,” World Review of Nutrition and Dietetics, Vol. 92, No. 2003, pp. 74-80.
- T. A. Sanders, “Polyunsaturated Fatty Acids in the Food Chain in Europe,” The American Journal of Clinical Nutrition, Vol. 71, Suppl. 1, 2000, pp. 176S-178S.
- M. Sugano and F. Hirahara, “Polyunsaturated Fatty Acids in the Food Chain in Japan,” The American Journal of Clinical Nutrition, Vol. 71, Suppl. 1, 2000, pp. 189S- 196S.
- A. P. Simopoulos, “Evolutionary Aspects of Diet, the Omega-6/Omega-3 Ratio and Genetic Variation: Nutritional Implications for Chronic Diseases,” Biomedicine & Pharmacotherapy, Vol. 60, No. 9, 2006, pp. 502-507. doi:10.1016/j.biopha.2006.07.080
- G. C. Burdge and P. C. Calder, “Conversion of AlphaLinolenic Acid to Longer-Chain Polyunsaturated Fatty Acids in Human Adults,” Reproduction Nutrition Development, Vol. 45, No. 5, 2005, pp. 581-597. doi:10.1051/rnd:2005047
- G. C. Burdge, A. E. Jones and S. A. Wootton, “Eicosapentaenoic and Docosapentaenoic Acids Are the Principal Products of Alpha-Linolenic Acid Metabolism in Young Men,” British Journal of Nutrition, Vol. 88, No. 4, 2002, pp. 355-363. doi:10.1079/BJN2002662
- G. C. Burdge and S. A. Wootton, “Conversion of AlphaLinolenic Acid to Eicosapentaenoic, Docosapentaenoic and Docosahexaenoic Acids in Young Women,” British Journal of Nutrition, Vol. 88, No. 4, 2002, pp. 411-420. doi:10.1079/BJN2002689
- H. Gerster, “Can Adults Adequately Convert Alpha-Linolenic Acid (18:3n-3) to Eicosapentaenoic Acid (20:5n-3) and Docosahexaenoic Acid (22:6n-3)?” International Journal for Vitamin and Nutrition Research, Vol. 68, No. 3, 1998, pp. 159-173.
- R. J. Pawlosky, J. R. Hibbeln, Y. Lin, S. Goodson, P. Riggs, N. Sebring, G. L. Brown and N. Salem Jr., “Effects of Beefand Fish-Based Diets on the Kinetics of n-3 Fatty Acid Metabolism in Human Subjects,” The American Journal of Clinical Nutrition, Vol. 77, No. 3, 2003, pp. 565-572.
- J. A. Conquer and B. J. Holub, “Dietary Docosahexaenoic Acid as a Source of Eicosapentaenoic Acid in Vegetarians and Omnivores,” Lipids, Vol. 32, No. 3, 1997, pp. 341- 345. doi:10.1007/s11745-997-0043-y
- K. D. Stark and B. J. Holub, “Differential Eicosapentaenoic Acid Elevations and Altered Cardiovascular Disease Risk Factor Responses after Supplementation with Docosahexaenoic Acid in Postmenopausal Women Receiving and Not Receiving Hormone Replacement Therapy,” The American Journal of Clinical Nutrition, Vol. 79, No. 5, 2004, pp. 765-773.
- E. J. Giltay, L. J. Gooren, A. W. Toorians, M. B. Katan and P. L. Zock, “Docosahexaenoic Acid Concentrations Are Higher in Women than in Men Because of Estrogenic Effects,” The American Journal of Clinical Nutrition, Vol. 80, No. 5, 2004, pp. 1167-1174.
NOTES
*GRANTS: We received funding from CIHR for our studies in the Brazilian Amazon (MOP 74462) and from the Canadian Foundation for Innovation for infrastructure and a salary grant for H. Weiler from the Canada Research Chairs Program.
#Corresponding author.