Theoretical Economics Letters
Vol.2 No.2(2012), Article ID:19329,5 pages DOI:10.4236/tel.2012.22040
Note on a Continuum Multi-Country and International Trade
Graduate School of Economics, Kyoto University, Kyoto, Japan
Email: Keita.Kamei@gmail.com
Received February 21, 2012; revised March 27, 2012; accepted April 3, 2012
Keywords: Multi-Country Trade; Ricardian Model
ABSTRACT
We provide an analytical solution for the continuum multi-country two-sector Ricardian model of Yanagawa (1996) [1], and obtain additional results that are not observed in the standard two-country two-good Ricardian model. Increases in productivity in each sector results in an increase in the number of countries producing high technology goods and a decrease in the number of countries producing low technology goods.
1. Introduction
At present, economists primarily use the two-country model to analyze international trade. However, in the real world multiple countries simultaneously trade goods and services among themselves. Hence, the use of a multicountry model is more realistic for economic analysis.
Nevertheless, the multi-country model is not used as frequently as the two-country model, primarily because multi-country analysis is very complicated and, therefore, difficult to apply1. One of the simplest multi-country models is by Yanagawa (1996) [1].
The model by Yanagawa (1996) [1] is based on the model by Dornbusch, Fischer and Samuelson (1977) [3] (the DFS model). Yanagawa (1996) [1] extended the DFS model, a two-country model with a continuum of goods, to a continuum multi-country two-good model, while retaining the simplicity of the DFS model. Therefore, the Yanagawa (1996) [1] model provides for a relatively simple approach to continuum multi-country analysis of international trade.
Regardless of its simplicity, the model by Yanagawa (1996) [1] has not attracted significant use in trade theory and application because it does not provide an analytical solution.
Our study rebuilds on the model of Yanagawa (1996) [1] and provides an analytical solution using a simple specification. We also reveal an interesting aspect of the model that is not observed in the standard two-country two-good Ricardian model: An increase in productivity in each sector results in an increase in the number of countries producing high technology goods and a decrease in the number of countries producing low technology goods.
2. The Model
This section explains the basic framework of our model. We suppose that an economy is composed of two sectors: low technology sector  and high technology sector
 . Countries in the world continuously exist
 . In this economy, all goods are produced using only labor
  with constant returns to scale technology. The labor employed in sector
  of country
  is denoted by
 . The labor productivity in sector
  of country
  is
is , and the output of good
  in country
  is
is . Both the goods markets are competitive. Further, production function are
 ,
,  , and
, and ,
, .
.
Now, we assume that the countries of the world are organized in order of economic development from . We specify production technology as follows:
 (1)
(1)
 (2)
(2)
where  and
and  are the technological levels in each sector. The production function in each sector is an increasing function of
 . Hence, low index countries have absolute disadvantage in each sector as compared to high index countries.2
Figure 1 (Figure 2) show the x sector (y sector) productiveity of country , and it is an increasing function of
 . The productivity in each sector in country
  is one and the productivity in each sector in country
  is zero. Hence, the productivity in each country
  and
and  represents the level of development based on the productivity of
  and
and . If the levels of technology a or b decrease (productivity increases), then the productivity of the countries
  and
and  comes close to the productivity of country
  3.
3.
We assume that labor is full employment. Suppose that the total labor endowment is given by  and is identical across countries. Then, in each country, the labor market clearing condition leads to
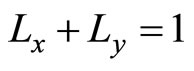 . Suppose that the labor is perfectly mobile between the two sectors, but is immobile across countries. Accordingly, wage
  is identical in the two sectors. From the
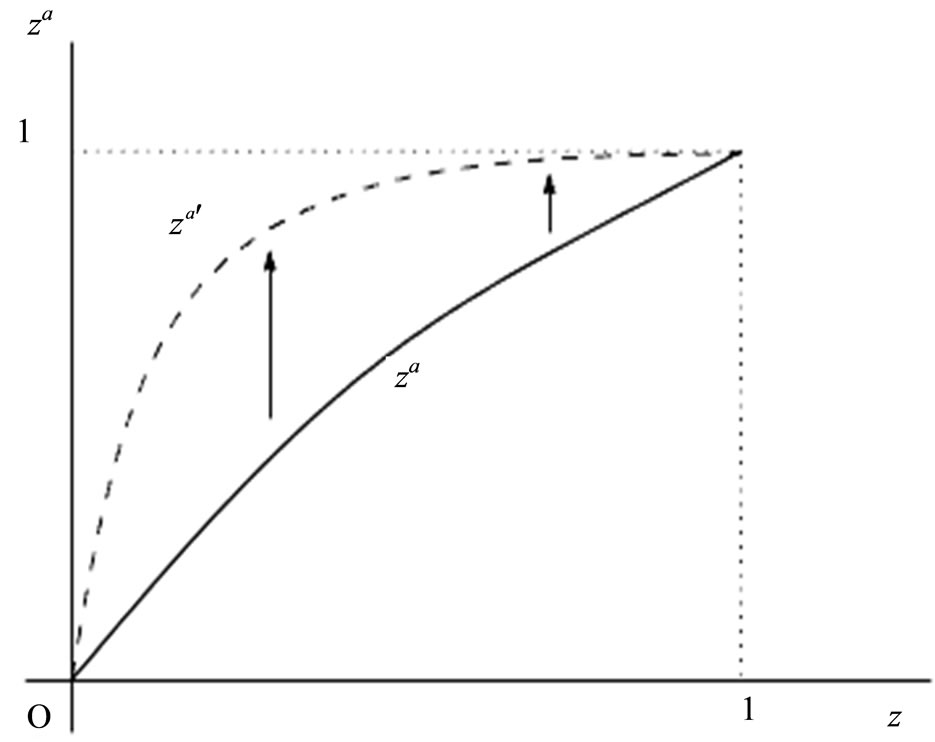
Figure 1. Productivity in low technology sector (a > a').
Figure 2. Productivity in high technology sector (b > b').
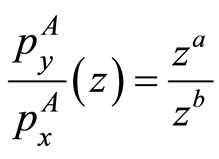
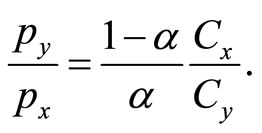
profit functions and the zero-profit conditions, we obtain the following condition:
 (3)
(3)
where  denotes the price in sector
  under autarky. Equation (3) indicates that relative price is equal to relative productivity in country
  under autarky.
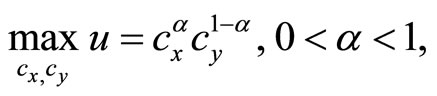
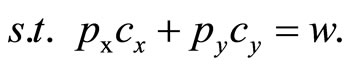
Next, let us formulate a consumer behavior. Suppose that the consumers obtain utility from x and y, and that all consumers in this economy share identical preferences. The utility maximization problem is given by
 (4)
(4)
 (5)
(5)
where  denotes the consumption of good
  and
and  represents the degree of consumer preference for the low technology good. The condition for the utility maximiztion is given by
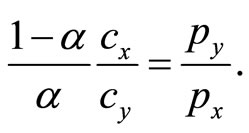 (6)
(6)
Suppose that the relative productivity between x sector and y sector satisfies the following condition:
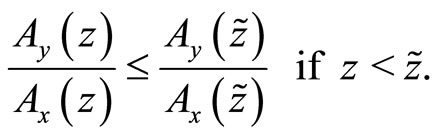 (7)
(7)
The larger the value of z, the higher the relative productivity between the two sectors. Therefore, this assumption implies that the order of comparative advantage in y is increasing in z. The production functions (1) and (2) satisfy the condition (7).
Analogous to the two-country Ricardian model, countries with relative productivity lower than the world relative price,  , will specialize in the low technology sector. Countries with relative productivity higher than
  will specialize in the high technology sector.
Let us define  as the country with the relative productivity equal to the world relative price. We call the country
  boundary country. Countries within the range
  specialize in the low technology sector, countries within the range
  specialize in the high technology sector.
All countries except the boundary country must specialize in the low technology goods (x) or the high technology goods (y). If the countries specialize in x sector, then , and if the countries specialize in y sector, then
 . Hence, the production functions x and y under free trade lead to
 ,
,  , and to
 ,
, .
.
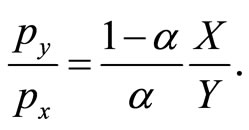
The relative productivity between x sector and y sector is as follows:
 (8)
(8)
where we assume that .
.
Then, we obtain the following equation.
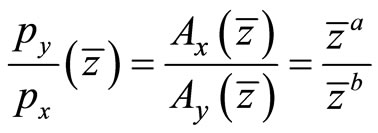 (9)
(9)
Equation (9) implies that the relative productivity of the boundary country equals the world relative price under free trade.
From the aggregate supply functions under free trade, we obtain each sector’s total output in the world:
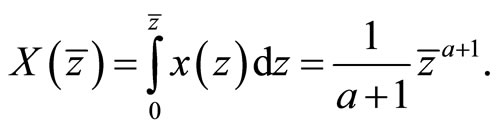 (10)
(10)
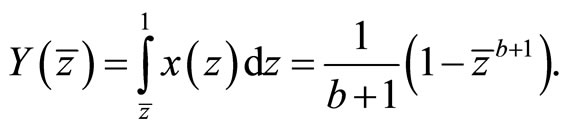 (11)
(11)
We derive the world demand for good i. All countries are distributed within the range , and we aggregate the demand in each country to derive total output thoughout the world. Aggregate demands
  and
and 
are given by 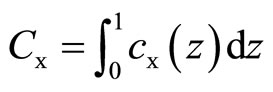 and
and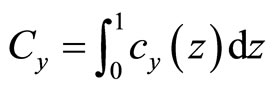 .
.
Using Equation (6), the utility maximization condition as follows:
 (12)
(12)
3. Equilibrium
The market clearing conditions lead to  and
and . Substituting the market cleaning conditions into Equation (12), we obtain the following equation:
 (13)
(13)
If Equation (9) equals Equation (13), then the boundary country in equilibrium  and the equilibrium world relative price
  are determined. The resultant expression is as follows:
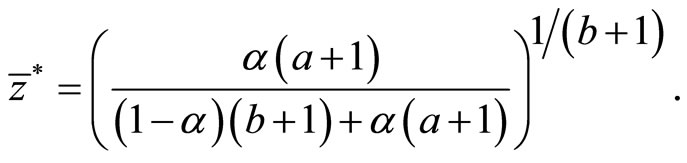 (14)
(14)
From ,
,  is
is  4.
4.
Figure 3 represents Equations (9) and (13), the boundary country in equilibrium , and the world relative price in equilibrium
 .
.
4. Discussion
This section analyzes how exogeneous technological progress in each sector (a decrease in  or
or ) changes the number of countries specializing in the low (or high) technology sector. The change in the boundary country
  is examined analytically.
Proposition 1. An increase in productivity in the low technology sector (a decrease in  of sector x) increases the number of countries specializing in the high technology sector y.
Proof. See Appendix A.□
Proposition 2. An increase in productivity in the high technology sector (a decrease in  of sector y) increases the number of countries specializing in the high technology sector y.
Proof. See Appendix B.□
Figure 4 graphically represents Proposition 1. If  decreases, then the
  and
and  curves rise. Hence, the equilibrium point moves from E to E’ and the number of countries that produce the high technology goods increases
  Furthermore, Figure 5 represents Proposition 2 graphically. If b decreases, then the
  and
and  curves fall. The equilibrium point moves from E to E" and the number of countries that produce high technology production increases
 .
.
Let us confirm the above propositions using numerical calculations. We set the criteria parameters as  and
and  and examine a shift in the boundary country through technological progress (a decrease in a or b) and a change in the total production quantity in each sector. Table 1 summarizes the results of the numerical analysis.
An increase in productivity in each sector results in an
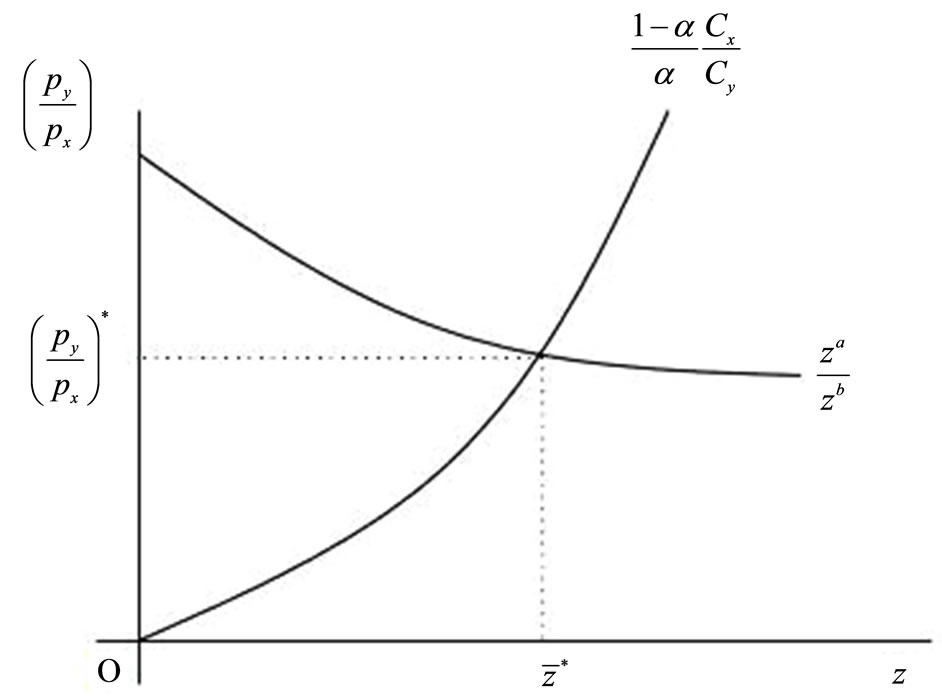
Figure 3. Relative labor productivity in each sector, relative optimal consumption rate, boundary country, and equilibrium relative price.
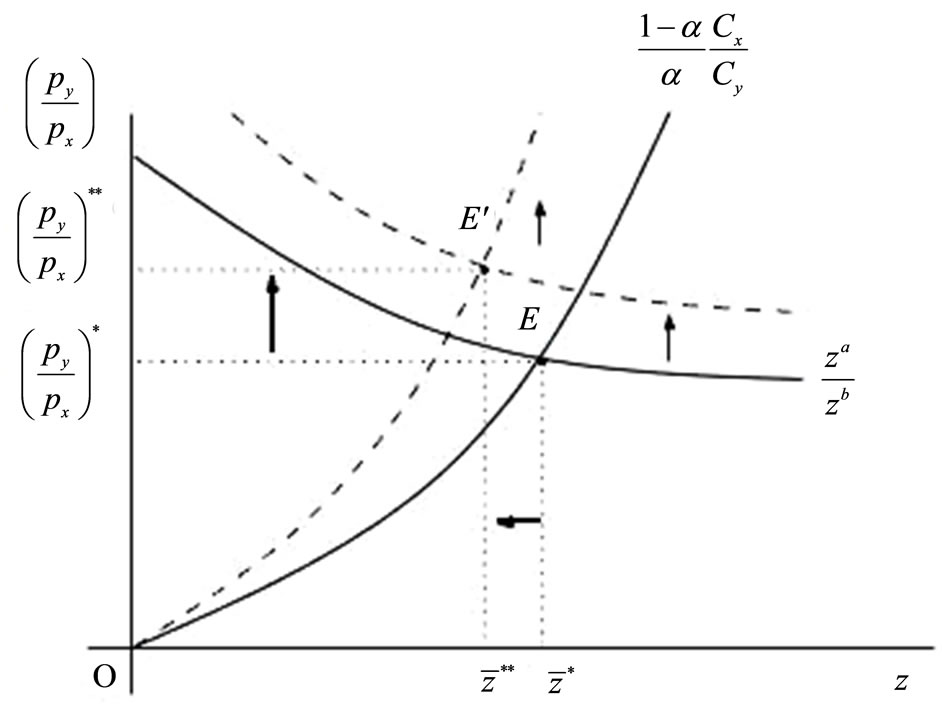
Figure 4. The case of an increase in productivity in the low technology sector (α decrease in a).
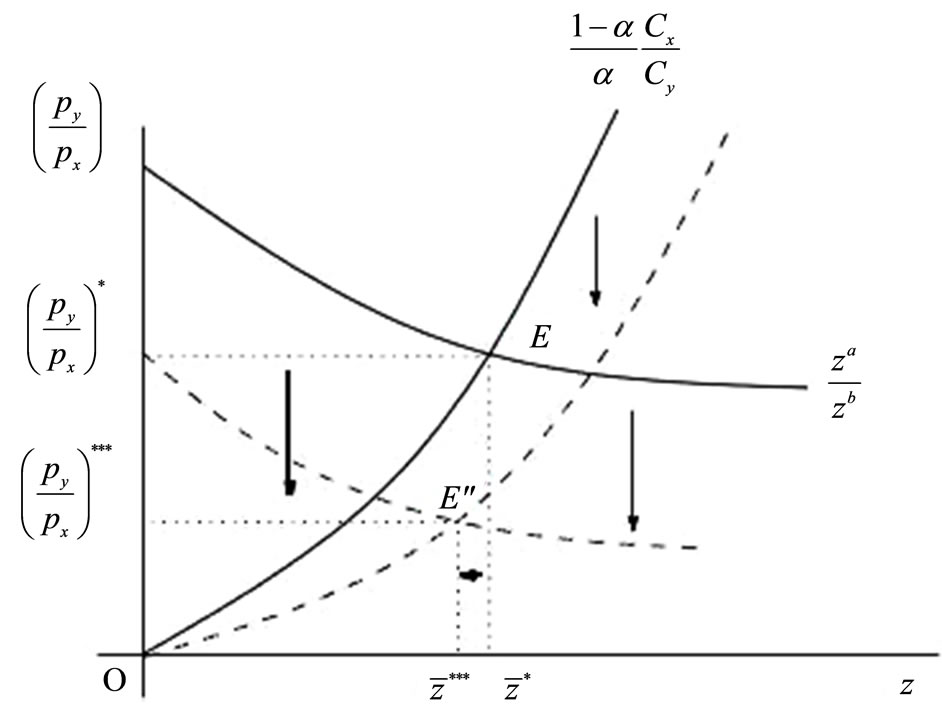
Figure 5. The case of an increase in productivity in the high technology sector (α decrease in b).
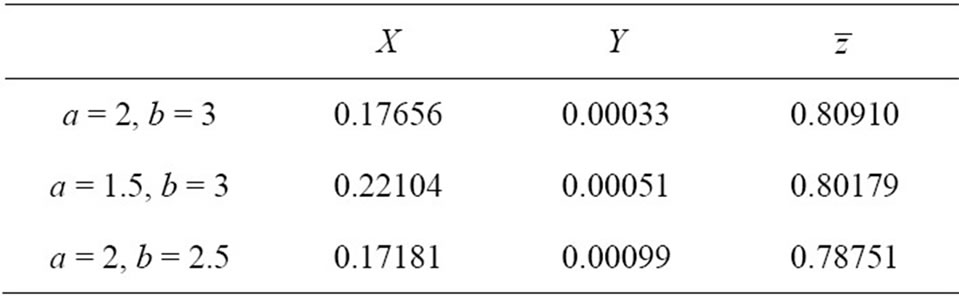
Table 1. Total quantity of low technology production and high technology production, and the boundary country index.
increase in the number of countries specializing in the high technology goods. First, we explain the case of an increase in productivity in the low technology sector. Such an increase results in higher real income of consumers and greater demand for high technology goods. Hence, a greater number of countries specialize in the high technology production. Second, we explain the case of an increase in productivity in the high technology sector. Countries specializing in the low technology sector are low index countries. Under the production function, productivity in countries specializing in the low technology sector is low compared with countries specializing in the high technology sector. Hence, following an increase in the productivity of the high technology sector, production efficiency in countries specializing in the low technology sector decreases, resulting in these countries stopping their low technology production and specializing in the high technology goods.
We compare the result of our model with that of the standard two-country two-good Ricardian model. Under the standard Ricardian model, a country that specializes in the low technology production can never specialize in the high technology production when productivity in the low technology sector is increasing. However, our result shows that an increase in productivity in the low technology sector increases the number of countries specializing in the high technology production.
5. Conclusion
We derived an analytical solution by rebuilding the Yanagawa (1996) [1] model. Our results show that an increase in productivity in each sector increases the number of countries that produce the high technology goods and decreases the number of countries producing the low technology goods. These results are not observed in the standard Ricardian model.
REFERENCES
- N. Yanagawa, “Economic Development in a World with Many Countries,” Journal of Development Economics, Vol. 49, No. 2, 1996, pp. 271-288. doi:10.1016/0304-3878(95)00062-3
- G. Becker, “A Note on Multi-Country Trade,” American Economic Review, Vol. 42, No. 4, 1952, pp. 558-568.
- R. Dornbusch, S. Fischer and P. Samuelson, “Comparative Advantage, Trade, and Payments in a Ricardian Model with a Continuum of Goods,” American Economic Review, Vol. 67, No. 5, 1977, pp. 823-839.
- H. Fadinger and P. Fleiss, “Trade and Sectoral Productivity,” Economic Journal, Vol. 121, No. 6, 2011, pp. 958- 989.
Appendix A
Proof of Proposition 1
Proof. We differentiate Equation (14) with respect to , resulting in the following expression:
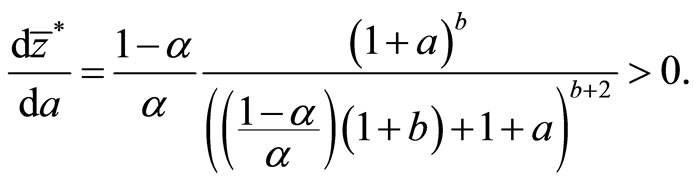 (15)
(15)
Appendix B
Proof of Proposition 2
Proof. We differentiate Equation (14) with respect to , resulting in the following expression:
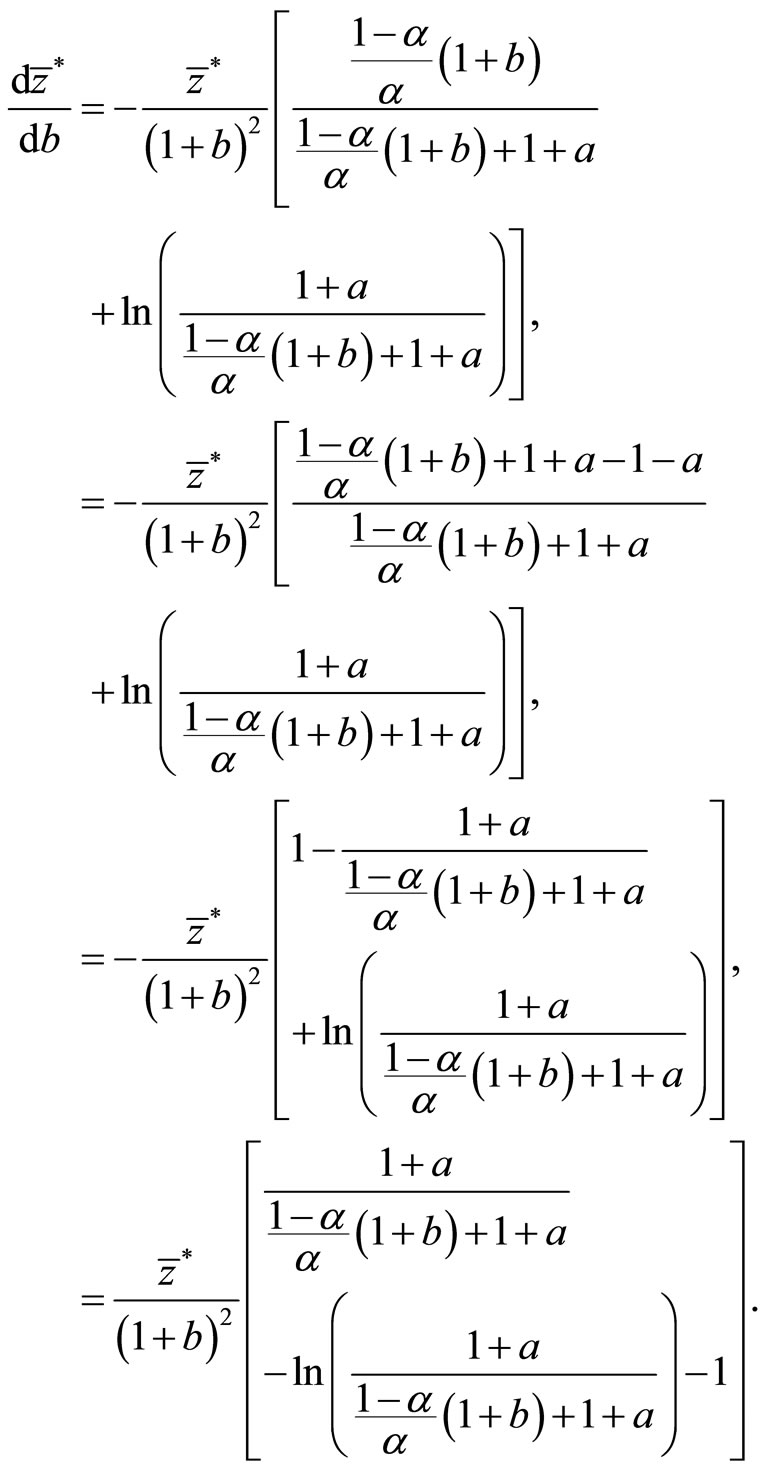
Here, we define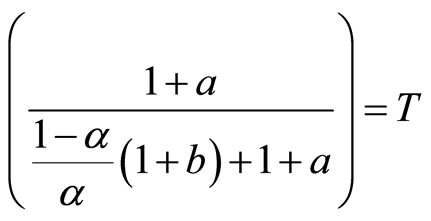 . Hence, if
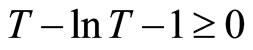 , then
 . We differentiate this with respect to
 , resulting in the following:
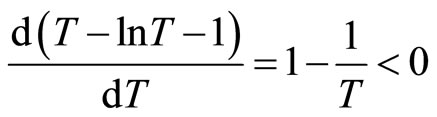

Therefore,  is a monotonically decreasing function with respect to
 . Moreover,
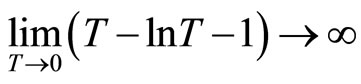
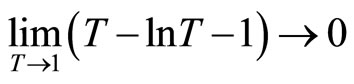
Consequently, .
.
NOTES
1For example, see Becker (1952) [2].
2This assumption is based on the stylized fact that productivity in each sector in developed countries is higher than that in each sector in developing countries, as discussed in Fadinger and Fleiss (2011) [4]. Therefore, the specifications of Equations (1) and (2) are realistic.
3Note that if 0 < z < 1 and a > a', then . Hence, a decrease in a implies an increasein productivity in the low technology sector. The case of b is similar.
4Using Equation (14), we can derive welfare in each country and world output in each sector.