Journal of Water Resource and Protection
Vol.07 No.01(2015), Article ID:53170,26 pages
10.4236/jwarp.2015.71002
Spatial-Temporal Dynamics of Runoff Generation Areas in a Small Agricultural Watershed in Southern Ontario
Kamran Chapi1, Ramesh P. Rudra1, Syed I. Ahmed1*, Alamgir A. Khan1, Bahram Gharabaghi1, William T. Dickinson1, Pradeep K. Goel2
1School of Engineering, University of Guelph, Guelph, Canada
2Environmental Monitoring and Reporting Branch, Ministry of the Environment, Toronto, Canada
Email: kamranchapi@gmail.com, rrudra@uoguelph.ca, *sahmed@uoguelph.ca, alamgir@uoguelph.ca, bgharaba@uoguelph.ca, wdickins@uoguelph.ca, Pradeep.Goel@ontario.ca
Copyright © 2015 by authors and Scientific Research Publishing Inc.
This work is licensed under the Creative Commons Attribution International License (CC BY).
http://creativecommons.org/licenses/by/4.0/


Received 19 December 2014; accepted 1 January 2015; published 14 January 2015
ABSTRACT
The identification of runoff generating areas (RGAs) within a watershed is a difficult task because of their temporal and spatial behavior. A watershed was selected to investigate the RGAs to determine the factors affecting spatio-temporally in southern Ontario. The watershed was divided into 8 fields having a Wireless System Network (WSN) and a V-notch weir for flow and soil moisture measurements. The results show that surface runoff is generated by the infiltration excess mechanism in summer and fall, and the saturation excess mechanism in spring. The statistical analysis suggested that the amount of rainfall and rainfall intensity for summer (R2 = 0.63, 0.82) and fall (R2 = 0.74, 0.80), respectively, affected the RGAs. The analysis showed that 15% area generated 85% of surface runoff in summer, 100% of runoff in fall, and 40% of runoff in spring. The methodology developed has potential for identifying RGAs for protecting Ontario’s water resources.
Keywords:
Variable Source Area, Runoff, Spatial-Temporal Variability, Seasonal Effect

1. Introduction
Variable source areas (VSA) are hydrologically active, dynamic, sensitive, and have higher potential of generating runoff within a watershed in the event of a storm [1] . Therefore, neither stormflow nor baseflow are uniformly produced from the entire surface or subsurface areas of a watershed. Instead they are affected by a dynamic, expanding or shrinking source area which consists of a few percent of the total watershed area [2] [3] . The size of VSA varies significantly within a storm in space and time. Their spatial-temporal variabilities are different in magnitude depending upon the nature of the storm, soil properties, geology, topography, vegetation and geographical location [4] . As an extension of saturation-excess process, VSA varies over a temporal range of storms in terms of intervals such as hours, days, and seasons [1] . The dynamic nature of VSAs have been reported by many hydrologists to be different over a broad range from 0% to 100% depending upon climate, soil, land use, geology and topography [5] - [10] .
The theory of VSA hydrology expresses that runoff is generated when a thin layer of surface soil is saturated during rainfall over small parts of a watershed [3] [5] [11] - [13] . In contrast to this theory, Hortonian runoff generation theory states that a uniformly distributed sheet of overland flow develops over the entire watershed once rainfall intensity exceeds the infiltration capacity of soil [14] .
Non-point source pollution (NPS) is responsible for more than 50% of the total water quality impairment [15] . NPS contributes over 4 billion tons of suspended sediment delivered annually into rivers in the United States and also contribute approximately 80% of the total Nitrogen load and more than 50% of the phosphorus load to water bodies [16] . Runoff from agricultural areas, construction sites and urban storm water has received more attention than other NPS owing to its major contribution to water quality problems [17] - [20] . It was indicated that agricultural runoff is responsible for 70% of the phosphorus received by Lake Erie from tributaries in Ontario [21] .
Best Management Practices (BMPs) can reduce the impacts of NPS on agricultural watersheds and water resources [22] ; therefore, an integrated watershed management plan must include the identification of water quality parameters, the identification of the spatial locations of contaminant sources in the watershed, and the identification of pathways. To more effectively target NPS, it has been strongly recommended that areas within a watershed with higher potential of delivering contaminants be identified and the implementation of BMPs be given priority in these areas pollution from land use activities reference group [10] [23] - [25] . Without assigning BMPs to critical areas which are more hydrologically sensitive than the other areas within a watershed, the control of NPS pollutants would be slow, expensive and less effective [26] .
The identification of hydrologically sensitive areas within a watershed is a difficult task because of their spatial and temporal variabilities depending on differences in soils, topography, land use, storm size and intensity [27] . The size of these areas varies from 0% to 100% of the basin area and they are mainly located at valley bottoms [25] . These areas have been termed as variable source areas (VSAs) [3] .
A study was conducted to examine the spatial patterns of storm runoff generation from eight small catchments as a function of antecedent moisture conditions in the Mont Saint-Hilaire, Quebec, Canada. They found that hydrologic response showed a strong nonlinear change with antecedent moisture conditions [28] .
The experiments were carried out to identify the patterns of hydrologic connectivity with shallow groundwater fluctuations, and found that hydrologic connectivity between riparian and hill slope areas vary with season [29] . Another study was conducted on a hill slope pasture in Alabama, USA, under natural rainfall conditions, and reported that hydrologic connectivity is important for generating hill slope response when infiltration-excess (IE) runoff mechanism dominates. Results also indicated that the maximum runoff generation area, varied between 67% to 100% [30] .
The researchers also used the variable source loading function (VSLF) watershed model to identify the fields at risk of generating runoff [31] . They demonstrated that the application of VSA-based hydrology to nutrient management planning, using modeled probability of runoff as a new transport factor in the P Index. One of the studies [32] also introduced a hydrologic model to simulate VSA and runoff-routing, and found acceptable results in prediction of channel flow velocities and sub basin event discharges. In addition, [33] emphasized that pollution control strategies for nutrient and sediment transport to streams also necessitates identification of variable source areas for better water quality at watershed scale.
Since agricultural runoff is the main factor for transporting NPS, it is suggested that BMPs be targeted to the areas within a watershed that are most prone to generate surface runoff. To explore the importance of VSA in terms of managing water quantity and water quality, this study was conducted 1) to evaluate the dominance of runoff generation mechanisms in different seasons of the year in order to identify the hydrologically sensitive areas of the watershed, and 2) to determine the factors affecting spatio-temporally runoff generating areas (RGAs) in a small agricultural watershed in southern Ontario.
2. Materials and Methods
2.1. Study Area
A 4.45 ha agricultural watershed, located on the Guelph Turfgrass Institute (GTI) of the University of Guelph, Guelph, between latitudes of 43˚32'42''N and 43˚32'50''N, and longitudes of 80˚12'17''W and 80˚12'30''W, was selected to study the seasonal dynamics of VSAs in southern Ontario (Figure 1). The mean elevation and slope of the watershed are 303 m and 4.5%, respectively. The mean annual precipitation is 810 mm. The long-term average annual temperatures for spring, summer, fall, and winter seasons are 9.2˚C, 18.5˚C, 5.2˚C, and −5.2˚C, respectively. The soil is uniform over the entire watershed and belongs to the Guelph series. The texture of the soil is sandy loam and falls in Group A in term of soil hydrological groups. The watershed was under the cultivation of corn in when the experiment was conducted in 2008.
2.2. Data Acquisition
In order to study the dynamics of VSAs, the GTI watershed was discretized into 8 homogenous fields based on soil, land use, and topography (Figure 2). The characteristics of these 8 fields are shown in Table 1. A Wireless System Network (WSN) was designed to measure the flow and soil moisture. This system includes a pressure sensor, a soil moisture sensor (both sensors were attached to the same board), a base station, and a laptop computer. A pressure sensor along with a soil moisture sensor was placed at the outlet of each field. The pressure sensors measured the depth of overland flow over a V-notch weir by means of the changes in output voltages. The soil moisture sensors registered the volumetric soil water content using another series of output voltages designed for them. The green dots in Figure 2 show the locations of the 8 sensors.
A V-notch weir was installed at the outlet of each field and the pressure sensor pipe was attached to the angle of the V-notch. A soil moisture sensor was placed into the ground beside the V-notch and were fed by a power source. Figure 3 shows the schematic installation of equipment. The sensors recorded the data in time intervals of 10 minutes and stored them in a small flash memory located on the sensor board. The data were then transferred to the base station and stored in a laptop computer. The pressure and soil moisture sensors were tested and calibrated in the lab, and in the field repeatedly to ensure that they functioned effectively in the field and provided as accurate data as possible.
The rainfall data were collected from the GTI tipping bucket raingauge in time interval of 5 minutes. A total
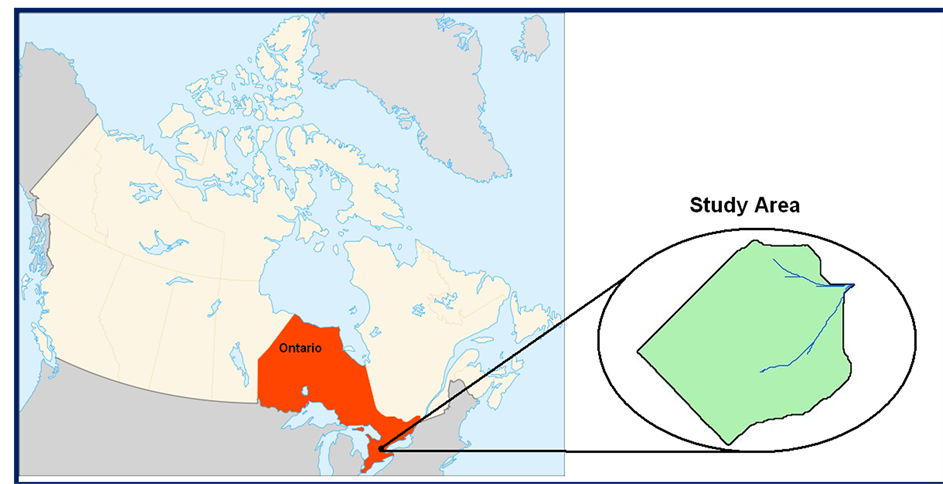
Figure 1. Geographical position of the study area.

Figure 2. Map of fields and sensors’ locations.

Table 1. Characteristics of 8 fields of the GTI watershed.

Figure 3. Installation of the equipments at the outlet of each field.
of 18 storms (10 in summer, 5 in fall, and 3 in spring) were recorded from July 2008 to April 2009 to investigate the seasonal variability of contributing areas of the watershed (Table 2). The total soil porosity for summer and fall was obtained from the work done by [28] . The total soil porosity values for summer, fall, and spring were 41%, 46%, and 48%, respectively.
The maximum amount of rainfall (37.4 mm) occurred on August 5, 2008, with an average intensity of 0.16 mm−1・min−1 and return period of 19 years. The minimum amount of rainfall (1.4 mm) happened on August 2, 2008 with an intensity of 0.02 and return period of 1.1 years. The highest intensity was 0.2 mm/min, and it occurred on August 10, 2008, with 25.6 mm of rain and duration of 130 minutes. Overall, summer storms have higher intensities because of shorter rainfall durations, and spring storms have lower intensities because of longer rainfall durations.
2.3. Analysis
To examine the effects of area and slope of the fields in addition to the way different fields respond to the storms in the watershed study, a Slope/Area Index was developed as follows:
 (1)
(1)
where:
SAI = Slope/Area Index;
S = average slope of field (%);
A = area of field (ha).
The sensitivity of the fields was analyzed using the probability of each field responding to the recorded rainfall events. This probability (Pr) was calculated using the Equation (2) below:
 (2)
(2)
Table 2. Storm characteristics for the GTI watershed.
Each field of the watershed had eighteen possible numbers of responses (n) to the rainfall events, out of which the field has responded to some of the events (r).
The literature review for runoff generation has stated the importance of runoff coefficient in the evaluation of contributing areas [6] [13] . Also, rainfall return period can be used for the delineation of contributing areas; therefore, some of the factors were considered for further analysis for this study. In this study the observed data at the outlets of the eight selected fields and at the outlet of the watershed were statistically analyzed to determine any spatio-temporal effect of peakflow, total flow, runoff coefficient, rainfall and runoff return period on RGAs at filed scale and watershed scale.
3. Results and Discussions
3.1. Runoff Generation Mechanism
Table 3 summarizes the soil moisture of each field in the watershed study before the beginning of rainfall storms and the time at which runoff was generated for the eighteen recorded rainfall storms. The analysis indicates that all fields in summer and fall generated runoff by infiltration-excess mechanism while spring was dominated by saturation-excess runoff for all of the fields (Table 3). In summer, the minimum soil moisture recorded among all the fields was 7% before the initiation of rainfall (7/30/08), and the maximum value was 38% at the time runoff was generated (8/13/08). The corresponding values of soil moisture for the fall were 6% and 25%, and the moisture content values for the spring were 30% and 56%.
In summer and fall, the average amount of soil moisture in the entire watershed was found to be lower than that of soil moisture in spring. Storms with different precipitation amounts increased the soil moisture in the field during the event. However, due to high soil-water storage capacity in summer and fall, the soil moisture never reached the saturation status. On the other hand, the soil was saturated or close to saturation in the entire watershed during spring. Therefore, even a small amount of rainfall generated runoff from all the fields.
Table 3. Soil moisture measurement before the initiation of storm and immediately upon surface runoff generation for investigation of runoff generation mechanisms for all the fields in the study watershed.
†Before the beginning of rainfall; ‡When runoff starts; ±No runoff ; αRunoff generation mechanism; βInfiltration excess; γSaturation excess.
The eight fields of the study watershed had different soil moisture status before the beginning of rainfall storms, even though the soil and land use are uniform over the entire watershed (Table 3). Furthermore, runoff has been generated on a random basis so that a field with low soil moisture generated runoff for a rainfall storm, while the same field with higher soil moisture did not contribute to runoff for other storms. For example, Field 4 with 7% soil moisture before the rainfall event of July 30, 2008 has generated runoff. However, the rainfall storm that occurred on August 14, 2008, this field did not contribute any runoff with 18% soil moisture (Table 3). This expresses that there is no specific threshold for soil moisture below which runoff is never generated and above which runoff is always generated. These results indicate that the soil moisture is not the only important factor for investigating the runoff generation mechanism, and other factors are also involved in the initiation of runoff in the field.
3.2. Spatial and Temporal Variability of Runoff Generating Areas (RGAs)
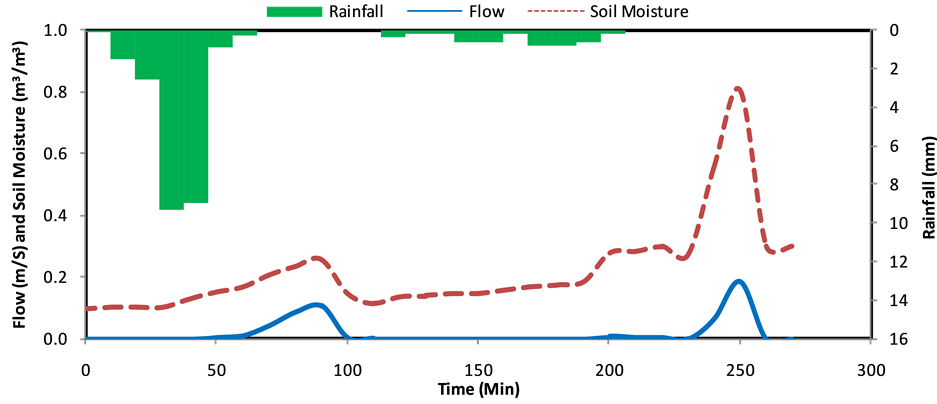
Three fields were randomly selected (Figure 4) to demonstrate the changes of soil moisture before the initiation of runoff and during runoff generation during summer, fall and spring seasons. Soil moisture fluctuates significantly in summer, since it is low before runoff generation, and increases sharply with rainfall to the point where it could pass the saturation threshold for high intensity rainfall events (Figure 4(a)).
 (a)
(a)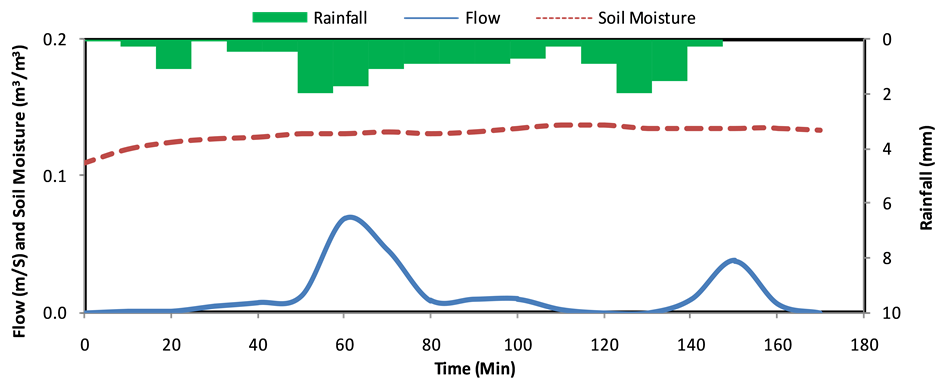 (b)
(b)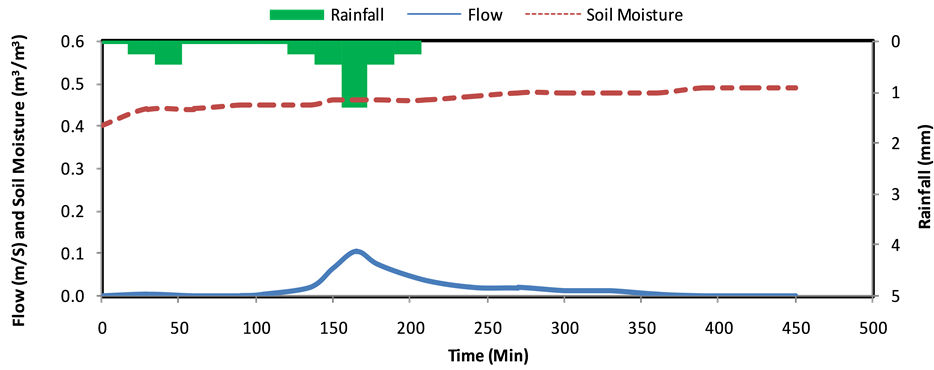 (c)
(c)
Figure 4. Temporal distribution of rainfall, soil moisture content, and surface runoff for the summer, July 22, 2008 (a); fall, October 16, 2008 (b); spring, April 1, 2009 (c).
The amount of soil moisture in fall was slightly lower than that of summer before starting rainfall; however it did not significantly change during runoff generation period due to light rain in the fall season (Figure 4(b)). The soil in the watershed was not near saturation status during summer and fall seasons. The fluctuation of soil moisture in spring was similar to fall; however, the value is significantly higher as the soil was saturated or near saturation (Figure 4(c)). The changes in soil moisture in summer are highly dependent upon the amount of precipitation while in fall and spring, other factors such as five-day antecedent rainfall should be considered since the trend of soil moisture did not follow the rainfall trend.
The time series output with depth of surface runoff were analyzed for eighteen recorded rainfall events. If the node at the field outlet registered any positive value except zero from the pressure sensor, the entire area of that field was considered to be RGA. The percentage of the contributing area was then computed for each rainfall storm to study its variability in time and space (Table 4). The timing of runoff generation and dissipation were found to be different for each storm event in different fields due to different soil moisture status. Also, the areal extent of RGAs at various times was different for each rainfall events and for all the diverse seasons.
Figures 5-7 demonstrate the spatial and temporal variability of RGAs for summer (August 10, 2008), fall (October 2, 2008) and spring (April 1, 2009). The percentage of RGAs in summer increased rapidly to the maximum value (100% for the rainfall of August 10, 2008) due to higher rainfall intensity; however, these areas started disappearing gradually with time (Figure 5). A similar trend was followed for fall storms with difference in the maximum percentage of RGAs due to lower rainfall intensity (Figure 6). This trend was totally different in spring so that the appearance and disappearance of RGAs followed a similar time scale (Figure 7). This was due to the fact that the soil was saturated and rainfall intensity did not affect the soil surface significantly.
Table 3 shows that the spatial distribution of soil moisture in the watershed for the storm of August 2, 2008, was the same as the soil moisture distribution for the storms of July 30, 2008, August 5, 2008, and both storm events generated runoff. Therefore, no runoff generation status of the storm of August 2, 2008 could be related
Table 4. Spatio-temporal dynamics of RGAs for 18 recorded rainfall events in the watershed study.
August 10, 2008 Storm August 10, 2008 Storm August 10, 2008 Storm


 August 10, 2008 Storm August 10, 2008 Storm August 10, 2008 Storm

 August 10, 2008 Storm August 10, 2008 Storm


Figure 5. Spatio-temporal mapping of the storm occurred on August 10, 2008 (summer) at the time of 0, 20, 40, 60, 90, 120, 150, and 180 minutes (from top left corner to bottom right corner).
to low amount of rainfall (1.4 mm) with very low average intensity (0.02 mm・min−1) as shown in Table 2. For the storm of September 13, 2008, spatial distribution of soil moisture was the same as the storm of September 14, 2008; however, the watershed did not generate any runoff for the storm of September 13, 2008, partly due to lower rainfall intensity, even though the amount of rainfall was higher than the amount of rainfall for the storm of September 14, 2008. The low average rainfall intensity could also be a reason for not generating runoff for the storm of October 8, 2008. This storm had lower intensity compared to the storm of October 2, 2008, with same spatial distribution of soil moisture that generated runoff.
Table 4 indicates that one rainfall storm in summer (August 2, 2008) and two rainfall storms in fall (September 13, 2008, and October 8, 2008) did not generate runoff in any field in the watershed. Whereas all the fields generated runoff (100%) for one summer storm (August 10, 2008), one fall storm (September 14, 2008) and three spring storms (March 29, 2009; April 1, 2009; and April 3, 2009). No runoff was generated for the August 2, 2008 rainfall event due to low soil moisture at the start of storm.
October 2, 2008 Storm October 2, 2008 Storm October 2, 2008 Storm


 October 2, 2008 Storm October 2, 2008 Storm


Figure 6. Spatio-temporal mapping of the storm occurred October 2, 2008 (fall) at the time of 0, 20, 40, 60, and 100 minutes (from top left corner to bottom right corner).
April 1, 2009 Storm April 1, 2009 Storm April 1, 2009 Storm


 April 1, 2009 Storm April 1, 2009 Storm April 1, 2009 Storm

 April 1, 2009 Storm April 1, 2009 Storm


Figure 7. Spatio-temporal mapping of the storm occurred on April 1, 2009 (spring) at the time of 0, 30, 60, 120, 240, 360, 480, and 600 min (from top left corner to bottom right corner).
Table 4 also shows that five rainfall events caused the entire watershed (100% area) to generate runoff including August 10, 2008, September 14, 2008, March 29, 2009, April 1, 2009, and April 3, 2009 storms. The eight fields of the study watershed generated runoff for the storm of August 10, 2008 due to slightly higher soil moisture in the fields which resulted from a heavy rain that occurred a day before on August 9, 2008. The same reason may be applicable to explain the 100% area generating runoff for the storm of September 14, 2008. Higher amount of rainfall and slightly higher rainfall intensity were also responsible for 100% RGAs for these events. The spring storms also caused 100% area of the watershed to generate runoff. This was mainly due to higher soil moisture in all the fields. These results confirm that the soil moisture plays an important role in the generation of runoff. However, other factors such as the amount of rainfall, rainfall intensity, and the antecedent rainfall are also responsible for runoff generation.
The minimum soil moisture for the RGAs in the watershed for summer and fall was 7%, and the maximum area generated runoff in summer (66%) was higher than that of fall (48%). The exception was the storms of August 10, 2008, and September 14, 2008, which contributed 100% due to the occurrence of heavy rainfall a day before those storms. The minimum and maximum RGAs were 15% and 83%, respectively, in spring regardless of the 100% contribution for all three rainfall events. Figure 8(a) clearly shows that only one storm (August 10, 2008) has caused the 100% of the watershed to generate runoff among ten recorded storms for the summer season. Figure 8(b) illustrates that the entire watershed area has generated runoff for only one (September 14, 2008) of the 5 storms in the fall season. Figure 8(c) displays 100% of the watershed area has generated runoff for all 3 recorded rainfall events in the spring season.
Overall, Figure 8 indicates that the temporal trend of change in RGAs in summer and fall is similar as the size of RGAs increases rapidly after storms start and decreases moderately with progression of the storms. This similarity is mainly due to a non-significant difference in the average soil moisture between these two seasons. The difference in the seasonal pattern of RGAs between summer, fall, and spring is due to soil moisture content and duration of rainfall events.
The analysis of persistence of 100% runoff generating status for the five rainfall events for summer, fall and spring illustrates that the 100% runoff generating status occurred sooner in summer and fall than spring (Figure 8). However, summer and fall rainfall events have generally higher intensity and shorter durations than those of spring, causing the 100% of watershed area to generate runoff faster, and remain at this status for shorter period of time. While spring rainfall events have lower intensity and longer durations, resulting in taking longer time in achieving the 100% runoff generation status and also persist for longer duration.
3.3. Factors Affecting RGAs
The spatio-temporal assessment of the factors governing the variability of RGAs, include; total rainfall, average rainfall duration, average rainfall intensity, average five-day antecedent rainfall, and average soil moisture. Statistical analysis (coefficient of correlation) indicated that there is no linear relationship between any single factor and RGAs in summer and fall, indicating that increasing and decreasing of these factors may not necessarily increase or decrease the RGAs (Table 5). This is mainly due to the dynamic nature of RGAs in these two seasons
 (a)
(a) (b)
(b)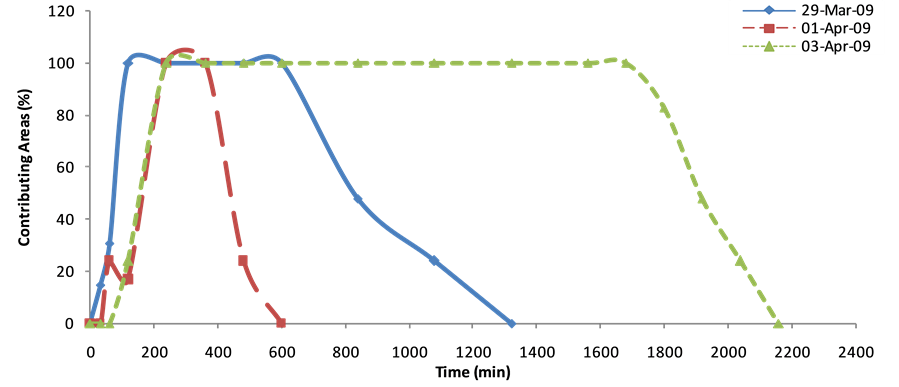 (c)
(c)
Figure 8. Temporal distribution of area generating runoff during a rainfall event for summer (a), fall (b), and spring (c) seasons.
Table 5. Coefficients of correlation between RGA, amount of rainfall, rainfall duration, rainfall intensity, five-day antecedent rainfall, and soil moisture for summer, fall, and spring seasons.
†Number of storms; ‡Total rainfall; ±Rainfall duration; αRainfall intensity; β5-day antecedent rainfall; γSoil moisture.
as well as the importance of other factors that may affect this phenomenon which are not evaluated in this study. In spring, the total rainfall and rainfall duration linearly affect the RGA’s variability.
Total amount of rainfall, average rainfall intensity, and soil moisture showed higher correlation coefficients for summer; rainfall intensity, five-day antecedent rainfall and soil moisture for fall; and soil moisture, total rainfall amount, and rainfall duration have higher correlations with RGAs for spring (Table 5). Table 5 also indicates that the amount of rainfall and the soil moisture are two key factors for quantifying RGAs for all three seasons followed by rainfall intensity for summer and fall, as reported by [34] [35] . The rainfall intensity does not affect the RGAs much in spring since soil is saturated or close to saturation and any storm can cause the entire watershed to generate runoff. The analysis also shows that the higher amount of rainfall and longer rainfall duration in spring can trigger the watershed to respond more rapidly and to maintain 100% runoff generation status.
Multiple regression analysis was performed for the factors with higher correlation coefficients with RGA except for spring season due to the low number of storms. For the spring season, two simple regression models were chosen since the low number (n = 3) of rainfall storms did not allow for multiple regressions analysis.
Table 6 summarizes the regression models best fitted to the data for the three seasons. The statistical analysis for summer data with low correlation among studied variables (R2 = 0.76) showed that the prediction of RGA requires consideration of other factors which affect the RGAs in summer. The fall and spring regression models could be more justified by the studied factors based on the higher R2 associated with them. This could also be interpreted that the variability of RGA in summer is more complicated than the other seasons. The analysis also shows that the relationships of the studied factors with RGA cannot guarantee that any field would generate runoff during summer. The higher values of R2 in the fall (0.92) and spring (0.99) could be interpreted such that the selected factors are more effective for predicting runoff generating area than those for summer.
3.4. Field Scale Analyses of Outflow
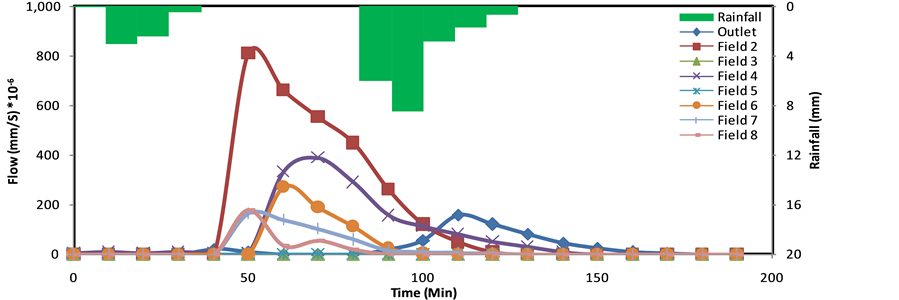
The outflow hydrographs at the outlets of each field was used to compute the total flow generated by the different field in the study watershed. Figure 9 shows the flow hydrographs of different fields of the watershed for the rainfall events of August 10, 2008 (summer), October 2, 2008 (fall), and April 3, 2009 (spring). Also, Table 7 shows the total volume of runoff from each field and from the entire watershed for the eighteen recorded rainfall events. These data show that the highest amount of runoff was generated by Field 2 for the 18 recorded storms, followed by Fields (4, 6, 7, and 11). Fields 8, 3, and 5 generated the least amount of runoff, respectively, as shown in Table 7 and Figure 12.
The average percentage of runoff volumes generated by each field was ranked based on the average percentage of total volume of runoff generated by each field. Figure 10 shows the sensitivity map of all the fields, where Field 4 contributed runoff for 14 out of 18 recorded storms, followed by Field 2 which contributed runoff for 11 out of 18 rainfall events. Fields 5 and 1 contributed runoff only for 4 out of 18 recorded rainfall events (Table 7).
The eight fields in the study watershed were then ranked based on percentage of the number of responses to the 18 rainfall events on another sensitivity map. Figure 11 illustrates the sensitivity map of the eight fields in the watershed based on the number of storms that caused each field to contribute to runoff. The difference between the fields in response to the storms could be explained by different soil moisture levels of the fields for various storms during the year as well as the discrepancy between the fields in slope and area. Spatial distribution
Table 6. Regression models for runoff generating area in summer, fall and spring.
‡Total rainfall; αRainfall intensity; γSoil moisture; β5-day antecedent rainfall; ±Rainfall duration.
 (a)
(a)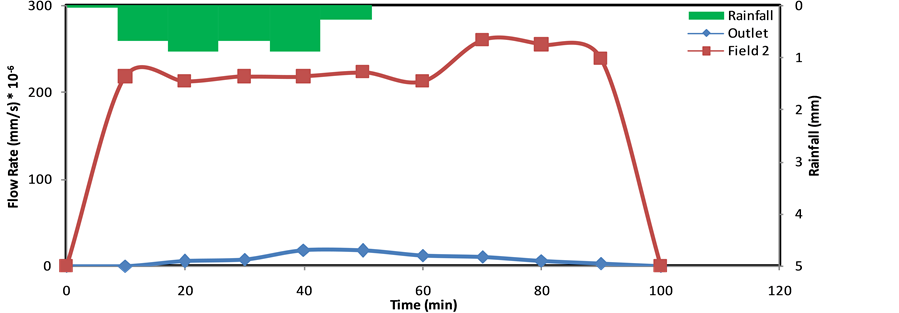 (b)
(b) (c)
(c)
Figure 9. Outflow hydrographs at the outlet for all 8 fields and outlet of the study watershed for the rainfall events of summer (August 10, 2008), fall (October 2, 2008), and spring (April 3, 2009).
Table 7. Contribution of the 8 fields in the study watershed to runoff for the 18 recorded rainfall events.
†The value in bracket is the percentage of contribution of the field to generate runoff as a fraction of total surface runoff depth.

Figure 10. Sensitivity of the 8 fields to the amount of runoff generated by each field for 18 recorded rainfall events in the study watershed.

Figure 11. Sensitivity of the each field to the number of storms caused the field to contribute to runoff in the study watershed.
of bulk density and hydraulic conductivity could also be responsible for variability of field responses to rainfall storms.
Slope-Area Analysis
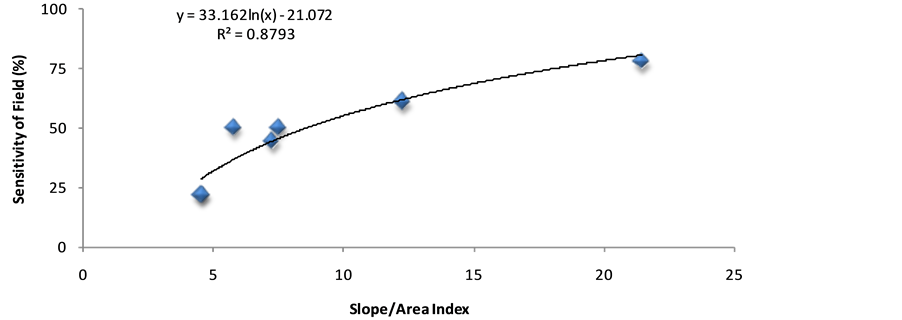
The analysis of the Slope/Area Index (SAI) of the eight fields for the eighteen rainfall events indicated a logarithmic relationship with the sensitivity of the fields. The relationship between the sensitivity of runoff generating areas alongside SAI with R2 value of 0.88 conforms the Topographic Index (TI), which is the most widely used index for the identification of saturated areas (Figure 12(a)). It shows that the greater the value of SAI, the higher the probability of generating runoff. The SAI index was also ranked and mapped based on the number of responses using SAI (Figure 12(b)). The analysis shown in Figure 12 revealed that the SAI is a good predictor of sensitivity of fields to the number of storms that caused the fields to contribute to runoff, since the index identified Field 4 as the most sensitive field among other fields, followed by Field 2.
Fields 7, 6, 8, 5, and 1 were placed after Field 2 in this ranking, respectively. Field 3 did not show any relationship with Slope/Area Index, even though it had the highest value of the index. This could be due to sensor misreading or different soil compaction in this field, resulting in a different pattern of soil moisture status. These results indicate that area and slope of the fields have significant effects on the contribution of fields to runoff. This should be considered along with the soil moisture to predict the sensitivity of the field to contribute to runoff.
These data combined with the data in Table 4 explain that even though runoff generating area is highly dynamic from event to event and from season to season, the sensitivity of some fields to runoff generation remains constant for all storms in summer, fall, and spring seasons. Such as Field 2 and Field 4 which contributed runoff for most of the rainfall events regardless of the season. Data given in Table 7 show that 15% area in the study watershed (Field 2 and Field 4) generated 85% of surface runoff in summer, 100% of runoff in fall, and 40% of runoff in spring. Analysis of the data also shows that the 15% area in the study watershed contributed runoff by 75% as an average for a year. Also, Fields 4 and 2 are hot spots in the study watershed that should be given serious attention for agricultural activities.
 (a)
(a) (b)
(b)
Figure 12. Identification of sensitivity of fields. (a) Sensitivity of fields to respond to the storm; (b) Generated by Slope/Area Index in the study watershed.
It was also confirmed by the SAI that the hot spots of the watershed were successfully highlighted. Therefore, the SAI method could be effectively used for the identification of RGAs in the study watershed for the purposes of nutrient management to reduce the risk of water pollution as proficiently as possible.
3.5. Watershed Scale Analyses of Outflow
The watershed outflow data were analyzed in order to compute the flow characteristics of the rainfall events (Table 8, Table 9) to explore the relationships of these factors with the variability of RGA. Four factors including
Table 8. Flow characteristics for the 18 recorded natural rainfall events in the watershed study.
Table 9. Relationship of rainfall and runoff return periods with RGA for summer, fall, and spring seasons.
peak flow, total flow, runoff coefficient, and return period were selected for further analysis for summer, fall, and spring seasons.
3.5.1. Analyses of Peak Flow and Total Flow
The analyses of peak flow and total flow at the outlet of the study watershed indicated that there is a linear relationship between peak flow and RGA, and between total flow and RGA for summer, fall, and spring (Figure 13). However, the degree of linearity decreases from fall to spring to summer. This can be either due to the complexity of summer hydrology or due to the fact that more storms were recorded for this season. The peak flow with an R2 of 0.69 was found to be a better indicator than the total flow with an R2 of 0.63 for RGA in summer. Moreover, the peak flow (R2 = 0.97) and total flow (R2 = 0.98) are equally good indicators for the variability of contributing areas during fall. Also, during spring, total flow (R2 = 0.96) is a better index than peak flow (R2 = 0.91) of RGA.


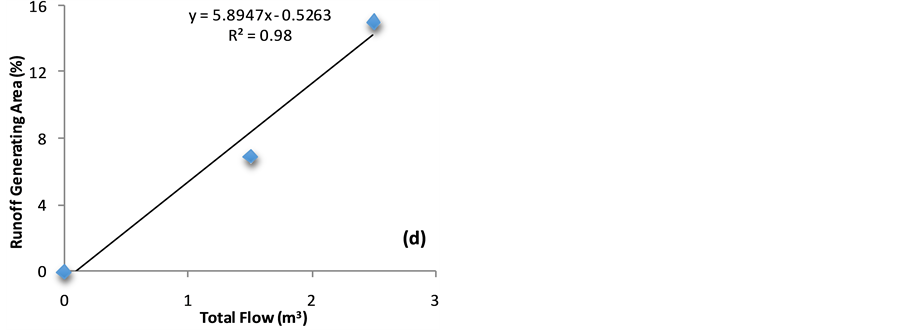


Figure 13. Relationship of peak flow rate and total flow with runoff generating area for summer (a) (b), fall (c) (d), and spring (e) (f), respectively.
Southern Ontario experiences more intense storms in summer than in the fall and spring; therefore, the responses of the watersheds to the storms are very rapid with sharper peak flows in summer than in the fall and spring. However, due to low soil moisture and in turn high soil storage, most of the produced runoff will enter the soil, resulting in lower total flow in summer. In contrast, early fall experiences fewer storms with lower intensities and soil moisture condition is almost similar to summer. Therefore, the contribution of the watershed to runoff is lower, resulting in reduced peak flow and total flow due to higher available storage. As a result, both total flow and peak flow can be assessed as good indicator for the fall season. The intensity of storm events is very low during spring and they rarely produce very sharp peak flows as observe during summer storms. Also, due to soil saturation, most of the rainfall events contribute runoff, resulting in high total flows, during the spring season. This clearly implies that total flow is a more reasonable indicator of RGAs for spring than peak flow.
Quantitative comparison of peak flow and total flow with RGAs during summer, fall, and spring, the 50th percentile value of runoff generating area was calculated (data not shown). The data indicated that if 50% of the area of the study watershed contributes to runoff, the peak flows of 4, 2.8, and 11 L・s−1; and the total flows of 13, 8.6, and 240 m3 would be generated during summer, fall, and spring, respectively. These results depict that the study watershed contributes a considerable amount of runoff during spring while it only contributes a slight amount of runoff during fall. Therefore, spring is a critical season for manure/fertilizer application due to high risk of nutrient transport with water. Consequently, early fall may be the best time of the year for agricultural activities in the study watershed.
3.5.2. Analyses of Runoff Coefficients
Table 8 shows no relationship between RGA and runoff coefficient for the summer season. However, runoff coefficient showed a linear relationship with runoff generating area for fall and spring, while the degree of linearity is lower for fall (R2 = 0.90) than in spring (R2 = 0.99) (Figure 14). These results indicate that the contribution of the watershed to runoff in summer is very low even for highly intense storms.
Runoff coefficient analysis explains the variability of RGA extremely well during spring and fall by indicating that the watershed runoff contribution pattern follows storm characteristics, i.e., intense storms result higher runoff coefficients and larger size of RGAs. Such a relationship is not visible in summer. The average seasonal runoff coefficients for the three seasons show a nonlinear relationship alongside RGA with R2 of 0.96. Seasonal runoff coefficients were found to be very low in fall, increasing sharply in summer and increasing moderately in spring (Table 8). Although the values of seasonal runoff coefficients of summer and fall are close, runoff generating areas of these two seasons are significantly different. This discrepancy could be related to different factors affecting RGAs in these two seasons. These findings indicate that runoff coefficient has potential to index RGA for all three seasons.
3.5.3. Analyses of Rainfall and Runoff Return Periods
Evaluation of RGAs revealed that the return is more closely correlated to RGAs for all seasons than the rainfall return period (Table 9). Comparison of the R2 values of rainfall return period and runoff return period indicate that the difference between the two values of R2 (rainfall return period and runoff return period) increases from spring to fall to summer, respectively, as shown in Table 9. This means that the rainfall and runoff are highly correlated in spring, while they are poorly correlated in summer. These results indicated that runoff return period can be used as a reliable index for the percentage of watershed area generating surface runoff specifically during fall season. This also indicates that the link between RGA with rainfall characteristics is uncertain during summer and can be better explained during spring; however, more data are needed for fall and spring investigations.
3.5.4. RGAs and Nutrient Management
The average values of RGA and the factors influencing its spatial and temporal variability including the amount of rainfall, rainfall duration, rainfall intensity, five-day antecedent rainfall, and soil moisture at the beginning of the rainfall event were examined for nutrient management (Figure 15). These data show that the magnitude of the RGA is directly influenced by soil water content. During spring period the most important factors for RGAs are soil water content, rainfall amount and duration of rainfall events.
For summer and fall seasons the magnitude of RGAs is more influenced by five days antecedent rainfall followed by soil moisture and the amount of rainfall in that season. For the spring season the magnitude of RGAs is


Figure 14. Relationship of runoff coefficient with RGA for fall (a) and spring (b) season.
influenced by soil moisture and the amount of rainfall in spring. Figure 15 also shows that the fall season has the minimum runoff generating area compared to that of summer and of spring. These findings give indications that the early part of the fall season may be more appropriate for manure/fertilizer application due to fewer fields expected to contribute runoff. Manure application during early spring period should be restricted due to large RGAs and increased risk of water pollution.
3.5.5. Evaluation of Spatio-Temporal Variability of RGAs
In order to evaluate the results of the spatial-temporal variability of the RGA study, the findings were compared to Dickinson and Whiteley’s moisture index [6] and Arteaga and Rantz’s storm index (Equation (3)) [36] .
 (3)
(3)
where SI is storm index is in inch (2.54 mm), A is antecedent rainfall in inch (2.54 mm), and S is total storm rainfall in inch (2.54 mm).
The variability of contributing areas in summer, fall and spring were plotted versus these two indices. Figure 16, Figure 17 show that these relationships are nonlinear for summer and fall. However, the trend of RGA is

Figure 15. Comparison of RGA, amount of rainfall, rainfall duration, rainfall intensity, five-day antecedent rainfall, and soil moisture for three different seasons.

Figure 16. Variability of soil moisture and storm indices with RGA during summer season.
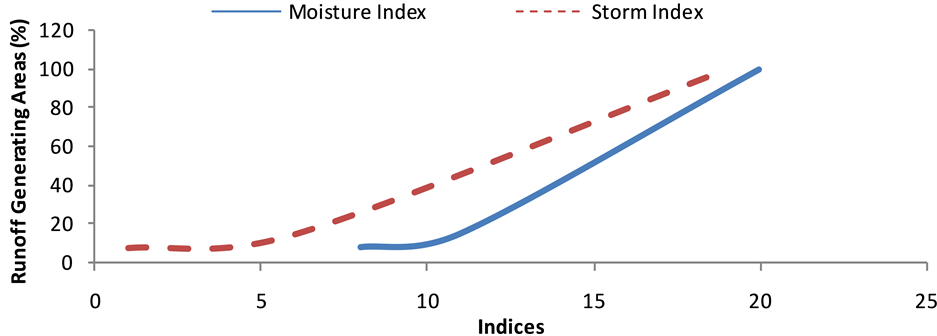
Figure 17. Variability of soil moisture and storm indices with RGA during fall season.
different during spring (Figure 18), even though it is nonlinear. This implies that the spring season has a different nature in southern Ontario as reported by [26] and the watersheds respond differently to storms in this season. This could be due to the high amount of moisture in the soil profile in this season such that soil is saturated or close to saturation either by direct rainfall or by snow melting.
Saturation by groundwater does not occur in the study watershed since the soil of the watershed belongs to a well-drained soil series so that the depth of groundwater generally remains at 0.5 m below the soil surface even during March to May, and is below 2 m during August to October [37] . Another reason for this difference could be related to the factors upon which these two indices are calculated. The moisture index is based on soil moisture changes while it is uniformed in spring; whereas the storm index is based on antecedent rainfall which was proved not to have any relationship with RGA in spring. A threshold of 30 cm have introduced above which the RGAs change significantly with moisture index [6] . This threshold has been found in this study to be 23 cm for summer and 11 cm for fall; however, no such threshold is introduced for spring.
4. Conclusions
The following conclusions have been drawn from the current study:
・ The results show that due to low soil moisture, runoff is generated by the infiltration excess mechanism in summer and fall, while the saturation excess mechanism dominated in the entire watershed in spring is due to the high initial moisture content of the soil.
・ Runoff generating areas (RGAs) are highly dynamic and vary within a storm, storm to storm, as well as seasonally within a watershed. Out of 18 studied rainfall storm events, only five events were able to produce 100% contribution from the fields (one summer storm, one fall storm, and three spring storms). Also, the 100% runoff generating status occurred sooner in summer and fall than spring. RGA is relatively more responsive during spring than in fall and summer due to high soil moisture content in the field.
・ The nature of a field responds differently to various rainfall events. This is evident when a field with low soil moisture generated surface runoff for a rainfall event, while the same field with higher soil water content does not generate any runoff for some other events. This implies that only soil moisture is not sufficient to study the variability of runoff generating areas. The statistical analysis showed that the amount of rainfall and rainfall intensity for summer (R2 = 0.63, 0.82) and fall (R2 = 0.74, 0.80), respectively, affected the RGAs. For spring, the amount and duration of rainfall (R2 = 0.99) were found to be effective parameters in generating runoff.
・ The field scale analysis developed a sensitivity map and slope-area method which showed that 15% area in the study watershed generated 85% of surface runoff in summer, 100% of runoff in fall, and 40% of runoff in spring. Analysis on annual basis also indicated that only the 15% area in the study watershed contributed runoff by an average of 75%. These data indicated that these hot spots should be given serious attention for agricultural activities in the study watershed.
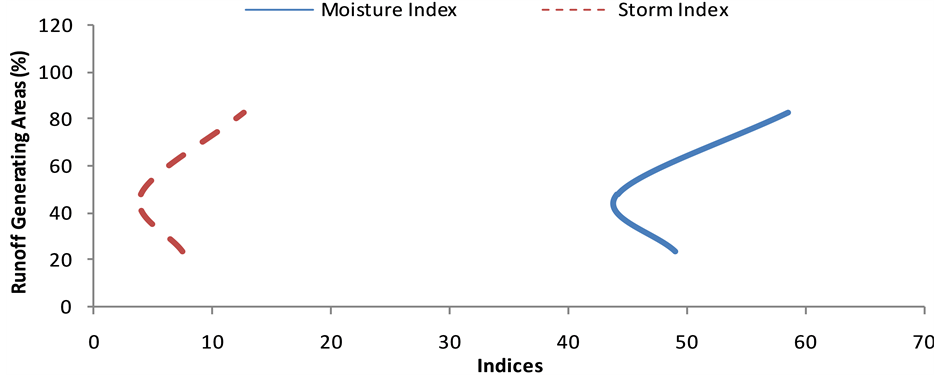
Figure 18. Variability of soil moisture and storm indices with RGA during spring season.
・ The statistical analysis at watershed scale indicated that the relationship between RGA and peak flow (R2 of 0.70) is a better indicator than the total flow (R2 of 0.63) for summer. In addition, the peak flow (R2 = 0.97) and total flow (R2 = 0.98) are equally good indicators for the variability of RGAs during fall and spring seasons. No relationship was found between RGA and runoff coefficient for the summer season; however, runoff coefficient showed a linear relationship with RGA for fall (R2 = 0.90) and spring (R2 = 0.99), respectively.
・ The database and the Slope/Area Index method developed in this research have potential for identifying RGAs at watershed scale. These fields can be marked for the purposes of BMPs for non-point source pollution controls, protecting source waters, and nutrient management.
5. Recommendations
・ The runoff sensors and wireless system use very sensitive electronic devices which are affected by climatic characteristics, animals in the field, and other field operations. Therefore, development of a robust system and an appropriate housing is essential for their short-term and long term use.
・ Manually recording of surface runoff and soil moisture are recommended for some randomly selected rainfall events to evaluate the function of pressure and soil moisture sensors during field experiment.
・ The developed sensors do not perform well during the growing season when the plants are tall. Therefore, further research is needed to develop an antenna system capable of delivering signals from the surface runoff sensor to the base station for any height of crop. Also, further research is needed for comprehensive evaluation of the developed monitoring system in heterogeneous watersheds exhibiting spatial variations in soil surface, subsurface, land use and topographic characteristics.
Acknowledgements
The authors gratefully acknowledge the useful contributions to this paper of Dr. Stefano Gregori, Dr. Amanjot Singh, and Steven P. Poret, of the School of Engineering, University of Guelph.
References
- Walter, M.T., Walter, M.F., Brooks, E.S., Steenhuis, T.S., Boll, J. and Weiler, K.R. (2000) Hydrologically Sensitive Areas: Variable Source Area Hydrology Implications for Water Quality Risk Assessment. Journal of Soil and Water Conservation, 55, 277-284.
- Hewlett, J.D. (1961) Watershed Management. USDA Forest Service, Southeastern Forest Experiment Station, Ashville.
- Hewlett, J.D. and Hibbert, A.R. (1967) Factors Affecting the Response of Small Watersheds to Precipitation in Humid Areas. In: Sopper, W.E. and Lull, H.W., Eds., Proceedings of the International Symposium on Forest Hydrology, Pergamon, Pennsylvania State University, New York, 275-290.
- Sivapalan, M., Beven, M. and Wood, E.F. (1987) On Hydrologic Similarity: 2. A Scaled Model of Storm Runoff Production. Water Resources Research, 23, 2266-2278. http://dx.doi.org/10.1029/WR023i012p02266
- Betson, R.P. (1964) What Is Watershed Runoff? Journal of Geophysical Research, 69, 1541-1552. http://dx.doi.org/10.1029/JZ069i008p01541
- Dickinson, W.T. and Whiteley, H. (1970) Watershed Areas Contributing to Runoff. International Association of Scientific Hydrology Bulletin, 96, 12-26.
- Moore, T., Dunne, T. and Taylor, C.H. (1976) Mapping Runoff-Producing Zones in Humid Regions. Journal of Soil and Water Conservation, 31, 160-164.
- O’Loughlin, E.M. (1986) Prediction of Surface Saturation Zones in Natural Catchment by Topographic Analysis. Water Resources Research, 22, 794-804. http://dx.doi.org/10.1029/WR022i005p00794
- Latron, J. and Gallart, F. (2002) Seasonal Dynamics of Runoff Variable Contributing Areas in a Mediterranean Mountain Catchment (Vallcebre, Catalan, Pyrenees). Project 5. ERB and Northern European FRIEND, Demanoska Dolina.
- Leh, M.D., Chaubey, I., Murdoch, J., Brahana, J.V. and Haggard, B.E. (2008) Delineating Runoff Processes and Critical Runoff Source Areas in a Pasture Hillslope of the Ozark Highlands. Hydrological Processes, 22, 4190-4204. http://dx.doi.org/10.1002/hyp.7021
- Dunne, T. and Black, R.D. (1970) An Experimental Investigation of Runoff Production in Permeable Soils. Water Resources Research, 6, 478-490. http://dx.doi.org/10.1029/WR006i002p00478
- Hewlett, J.D. (1982) Principles of Forest Hydrology. University of Georgia Press, Athens.
- Gburek, W.J. (1990) Initial Contributing Area of a Small Watershed. Journal of Hydrology, 118, 387-403. http://dx.doi.org/10.1016/0022-1694(90)90270-8
- Horton, R.E. (1933) The Role of Infiltration in the Hydrologic Cycle. Transactions of the American Geophysical Union, 14, 446-460. http://dx.doi.org/10.1029/TR014i001p00446
- Novotny, V. and Chesters, G. (1981) Handbook of Nonpoint Pollution: Sources and Management. Van Nostrand Reinhold Company, New York.
- Loehr, R.C. (1972) Agricultural Runoff―Characterization and Control. Journal of Sanitary Engineering Division, 98, 909-923.
- Olness, S., Smith, J., Rhoades, E.D. and Menzel, R.G. (1975) Nutrient and Sediment Discharge from Agricultural Watersheds in Oklahoma. Journal of Environmental Quality, 4, 331-336. http://dx.doi.org/10.2134/jeq1975.00472425000400030009x
- Wall, G.J., Dickinson, W.T. and Van Vliet, L.J.P. (1982) Agriculture and Water Quality in the Canadian Great Lakes Basin: II. Fluvial Sediments. Journal of Environmental Quality, 11, 482-486. http://dx.doi.org/10.2134/jeq1982.00472425001100030032x
- Dickinson, W.T. and Rudra, R.P. (1986) Identification of Soil Erosion and Fluvial Sediment Problems. Hydrological Processes, 1, 111-124. http://dx.doi.org/10.1002/hyp.3360010110
- Park, S.W., Mostaghimi, S., Cookeand, R.A. and McClellan, P.W. (1994) BMP Impacts on Watershed Runoff, Sediment, and Nutrient Yields. Water Resources Bulletin, 30, 1011-1023. http://dx.doi.org/10.1111/j.1752-1688.1994.tb03349.x
- Miller, M.H., Robinson, J.B., Coote, D.R., Spires, A.C. and Wraper, D.W. (1982) Agriculture and Water Quality in the Canadian Great Lakes Basin: III. Phosphorus. Journal of Environmental Quality, 11, 487-493. http://dx.doi.org/10.2134/jeq1982.00472425001100030033x
- Tomer, M.D., Jamesand, D.E. and Isenhart, T.M. (2003) Optimizing the Placement of Riparian Practices in a Watershed Using Terrain Analysis. Journal of Soil and Water Conservation, 58, 198-206.
- PLUARG (1978) Environmental Management Strategy for the Great Lakes Basin. Final Report of the Pollution from Land Use Activities Reference Group to the International Joint Commission, Windsor.
- Duda, A.M. and Johnson, R.J. (1985) Cost-Effective Targeting of Agricultural Nonpoint-Source Pollution Controls. Journal of Soil and Water Conservation, 40, 108-111.
- Qiu, Z. (2003) A VSA-Based Strategy for Placing Conservation Buffers in Agricultural Watersheds. Environmental Management, 32, 299-311.
- Dickinson, W.T., Rudra, R.P. and Wall, G.J. (1990) Targeting Remedial Measures to Nonpoint Source Pollution. Water Resources Bulletin, 26, 499-507. http://dx.doi.org/10.1111/j.1752-1688.1990.tb01388.x
- Megahan, W.F. and King, P.N. (1985) Identification of Critical Areas on Forest Lands for Control of Nonpoint Sources of Pollution. Environmental Management, 9, 7-18. http://dx.doi.org/10.1007/BF01871440
- James, A.L. and Roulet, N.T. (2007) Investigating Hydrologic Connectivity and Its Association with Threshold Change in Runoff Response in a Temperate Forested Watershed. Hydrological Processes, 9, 3391-3408. http://dx.doi.org/10.1002/hyp.6554
- Detty, J.M. and McGuire, K.J. (2010) Topographic Controls on Shallow Groundwater Dynamics: Implications of Hydrologic Connectivity between Hillslopes and Riparian Zones in a Till Mantled Catchment. Hydrological Processes, 24, 2222-2236. http://dx.doi.org/10.1002/hyp.7656
- Sen, S., Srivastava, P., Dane, J.H., Yoo, K.H. and Shaw, J.N. (2010) Spatial-Temporal Variability and Hydrologic Connectivity of Runoff Generation Areas in a North Alabama Pasture―Implications for Phosphorus Transport. Hydrological Processes, 24, 342-356.
- Marjerison, R.D., Dahlke, H., Easton, Z.M., Seifert, S. and Walter, M.T. (2011) A Phosphorus Index Transport Factor Based on Variable Source Area Hydrology for New York State. Journal of Soil and Water Conservation, 66, 149-157. http://dx.doi.org/10.2489/jswc.66.3.149
- Buchanan, B.P., Fleming, M., Schneider, R.L., Richards, B.K., Archibald, J., Qiu, Z. and Walter, M.T. (2013) Evaluating Topographic Wetness Indices across Central New York Agricultural Landscapes. Hydrology and Earth System Sciences, 10, 14041-14093. http://dx.doi.org/10.5194/hessd-10-14041-2013
- Thompson, J., Cassidy, R., Doody, D.G. and Flynn, R. (2013) Predicting Critical Source Areas of Sediment in Headwater Catchments. Agriculture, Ecosystems and Environment, 179, 41-52. http://dx.doi.org/10.1016/j.agee.2013.07.010
- Verhoest, N.E.C., Troch, P.A., Paniconi, C. and DeTroch, F.P. (1998) Mapping Basin Scale Variable Source Areas from Multitemporal Remotely Sensed Observations of Soil Moisture Behavior. Water Resources Research, 34, 3235- 3244. http://dx.doi.org/10.1029/98WR02046
- Srinivasan, M.S., Gburek, W.J. and Hamlett, J.M. (2002) Dynamics of Stormflow Generation―A Hillslope-Scale Field Study in East-Central Pennsylvania, USA. Hydrological Processes, 16, 649-665. http://dx.doi.org/10.1002/hyp.311
- Arteaga, F.E. and Rantz, S.E. (1973) Application of the Source-Area Concept of Storm Runoff to a Small Arizona Watershed. Journal of Research, U.S. Geological Survey, 1, 493-498.
- Mackintosh, E.E. and Van der Hulst, J. (1978) Soil Drainage Classes and Soil Water Table Relations in Medium and Coarse Textured Soils in Southern Ontario. Canadian Journal of Soil Science, 58, 287-301. http://dx.doi.org/10.4141/cjss78-035
NOTES

*Corresponding author.