Journal of Water Resource and Protection
Vol. 2 No. 11 (2010) , Article ID: 3185 , 10 pages DOI:10.4236/jwarp.2010.211111
Development of a Regional Regression Model for Estimating Annual Runoff in the Hailar River Basin of China
1Ph.D. Candidates (Duan and Luo) and Dean and Prof., College of Conservancy and Civil Engineering, Inner Mongolia Agricultural University, Hohhot, China
2Visiting Scholars (Duan and Luo) and Assistant Prof., Department of Engineering and Physics, Tarleton State University, Stephenville, USA
3Civil Engineer, Hebei Institute of Investigation & Design of Water Conservancy & Hydropower, Tianjin, China
E-mail: {duanlimin820116, txliu1966}@163.com, xwang@tarleton.edu
Received September 10, 2010; revised October 18, 2010; accepted October 18, 2010
Keywords: Inner Mongolia, Indirect Estimation, Monsoon Climate, Subbasin Runoff
ABSTRACT
The Hailar River, a first-grade tributary of the Erguna River that borders China and Russia, is the main water source for the local industry and agriculture. However, because there are only 11 flow gauging stations and those stations cannot monitor all runoff paths, it is hard to directly use the existing flow data to estimate the annual runoffs from all subbasins of interest although such estimation is needed for utilization and protection of the water resources in the Hailar River. Thus, this study implemented an indirect approach (i.e., regional regression model) by correlating annual runoff with annual rainfall and water surface evaporation as well as hydrologic characteristics of the 11 subbasins monitored by the gauging stations. The study used 51 years (from 1956 to 2006) data. The results indicated a significant correlation (R2 > 0.87) between annual runoff and the selected subbasin characteristics and showed the model to be robust because the predicted runoffs for the validation period are compatible with the corresponding observed values. In addition, this model was used to estimate the annual runoffs for the subbasins that are not monitored by the 11 flow gauging stations, which adds new information to existing literature.
1. Introduction
While the availability of hydrological (e.g., flow) data is crucial for water resources planning and management, most rivers in developing countries, including China, do not have sufficient data partially due to poorly maintained monitoring networks [1-3]. In addition, it is almost impractical to monitor all subbasins of interest within large basins [4], such as the 54,805 km2 Hailar River basin located in northeastern China. Thus, researchers developed and/or used various methods to estimate runoff from ungauged basins/subbasins. Those methods include sophisticated simulation models as well as simple statistics models. In practice, simple models have been widely used by water agencies to estimate annual runoff at a regional scale.
Among the simple models, the simplest methods transfer streamflow from a nearby hydrologically similar basin by assuming the runoff per unit drainage area is constant [5], or directly uses a runoff map [6-9]. The other approaches use multiple regression techniques to exploit the spatial relationship between annual runoff and readily measured basin characteristics, such as rainfall, potential evapotranspiration, drainage area, land use, and geomorphology. For example, a research related annual runoff to geomorphic and climate characteristics for three selected basins in western, central and southern U.S. [5], for one basin in western U.S. [10], for one basin in northeastern U.S. [11], for several areas in South Dakota [12], for whole U.S. [13], and for the state of New England [14,15].
Also the basin characteristics can be easily determined using remote sensing (RS) and geographic information systems (GIS) [16-18], greatly facilitating the application of these approaches. For example, a GIS-based rainfallrunoff model with independent variables of rainfall, land use, and soil characteristics was adopted for the Tapi River basin, India [19], and a GIS model was exploited to estimate basin geomorphological, geological, soil, and climatic characteristics for predicting total streamflow [20].
However, a study similar with the researches mentioned above is lacking for the Hailar River basin, which is located in an undeveloped area of northeastern China, and has limited hydrologic data. The objectives of this study were to: 1) develop a regional regression model for estimating annual runoff in the Hailar River basin; and 2) use the regression model to predict the amounts of runoff for the return periods of interest.
2. Materials and Methods
2.1. Study Area
The 54,805 km2 Hailar River basin (Figure 1), located in southestern Hulunbeir of China, is very sensitive to climatic and environmental changes [21,22]. This study selected this basin to demonstrate the estimation of annual runoff because of the basin is typical for water resources planning and management. The river originates from the Da Xingan mountains, has a main channel length of 708.5 km, and is fed by 12 major tributaries upstream of its confluence with the Erguna River.
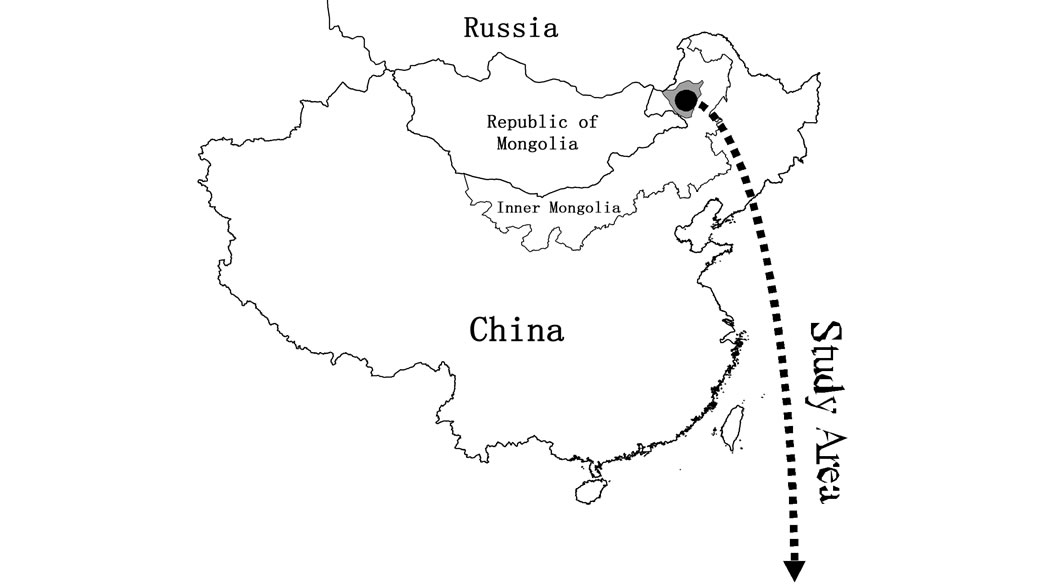

Figure 1. Map showing the location and drainage network of the Hailar River basin.
The Hailar River basin has a temperate continental monsoon climate. That is, the basin is strongly influenced by the eastern Asian summer monsoon and frequently suffers from extreme climates: short-cool summers and long-cold winters [22,23]. Based on the data from 1956 to 2006, the basin receives an average annual rainfall of 347.6mm , has a water surface evaporation of 801.7 mm and an annual average temperature of -1.2℃. The topography is dominated by mountains and hills, plains, and wetlands, with elevations ranging from 510 to 1622 m above mean sea level.
2.2. Available Data
There are 8 rainfall, 17 weather, and 11 flow gauging stations in and adjacent to the Hailar River basin (Figure 1). These stations, maintained by the local climatic and hydrologic monitoring departments, collect data on rainfall, water surface evaporation, and/or streamflow. Most of the stations have data from 1956 to 2006, while the datasets for several stations are not continuous. The missing values were filled using an interpolation and extension approach detailed in the following context. The basin characteristics (Table 1) were obtained from the Hailar Hydrographic Bureau.
2.3. Methods
This study investigated the correlations of annual runoff (R) with several selected independent variables, including annual rainfall (P), annual water surface evaporation (E), subbasin centroid coordinates (X,Y), subbasin centroid elevation (H), subbasin area (AB), subbasin wetland area (AW), and subbasin shape factor (K). The investigation was used to establish a regional regression model for estimating annual runoff of subbasins that cannot be monitored by the 11 flow gauging stations. The investigation was realized by: 1) using the multiple-period universal kriging spatial estimation theory (MUKSE) [24,25] to estimate values of annual rainfall and water surface evaporation from 1956 to 2006 for the subbasins that are monitored by the 11 flow gauging stations and the 12 ungauged subbasins; 2) using the principal component regression (PCR) technique provided in the Eviews 7.0 software package to build/validate a regression model between annual runoff and subbasin characteristics in terms of the data of the subbasins monitored by the 11 flow gauging stations; 3) using the validated regression model and it’s coefficients to estimate the annual runoffs for the 12 ungauged subbasins of the Hailar River basin.

Table 1. The characteristics of the subbasins in the Hailar River basin.
2.3.1. Annual Rainfall Estimation
This study used the MUKSE to estimate annual rainfall because this method is superior to the conventional interpolation methods [26,27], including the Thiessen polygon method, arithmetic average method, inverse distance or inverse distance square method, isopluvial line method, and Kriging method. The MUKSE is an improved version of the Kriging method and implements an optimal technique to estimate rainfall for small subbasins or localized areas where adequate rainfall data do not exist. The estimation was realized through the following six steps.
Step 1: Rainfall interpolation and extension In order to derive a complete annual rainfall dataset from year 1956 to 2006 for the 36 stations in and adjacent to the Hailar River basin, the univariate and bivariate statistical regression methods were implemented to fill the missing values. Herein, the annual rainfall at station i and year j was designated Zi (tj) (i = 1, 2, …, 36; j = 1, 2, …, 51).
Step 2: Annual rainfall stationary testing The MUKSE requires that Zi (tj) be stationary. This study used the Fourier cycle analysis to discern the cycles of the annual rainfall time series and then used a moving average method to test the stationary feature.
Step 3: Spatial drift equations determination The available annual rainfall (mi, i =1, 2, …, 36) data were used to estimate the missing values at the 36 stations. mi was regressed on station location (xi,yi) (i = 1, 2, …, 36) by using a trend surface analysis [24] to develop the spatial drift equations of annual rainfall time series.
Step 4: Robust experimental variogram and optimal approximation The spatial drift and experimental variogram can be computed as:
 (1)
(1)
 (2)
(2)
 (3)
(3)
where mi is the spatial drift of station i; T is the time series length; Ri(tj) and Rk(tj) are the residuals at stations i and k, respectively; r(i, k) is the experimental variogram between station i and k.
The computed experimental variograms for the stations were trimmed in a robust statistical sphere [28,29] to eliminate any influences from the large errors of individual data points. Subsequently, along the directions of 0°, 90°, 45° and -45°, the variograms in different directions were determined with an angle interval of ± 22.5°. According to trends of the annual rainfall experimental variograms along those four directions, a spherical theoretical variogram model was developed by fitting the variograms using the hydrology system package procedure [24]. The model was used to create an “overlapping” variogram that is used in the next step (i.e., Step 5).
Step 5: Theoretical variogram and spatial drift equation The overlapping theoretical variogram model and spatial drift equation were tested as follows: for any year tj at station i, integrating annual rainfall series of the other stations (except for station i) to get equation (4), which in turn was used to estimate the annual rainfall Zi*(tj) at station i. The theoretical variogram and spatial drift equation were considered to be reasonable (i.e., the MUKSE model is valid) [24,29], if Zi(tj)- Zi*(tj) (i = 1, 2, …, 36; j = 1, 2, …, 51) give: 1) an average error (Me) that can approximate to zero; 2) a variance of error ( ) that can approximates to the average kriging variance (S*2); 3) an error histogram that can approximately represent a normal distribution; 4) an absolute standard deviation of the error histogram that can approximately represent a normal distribution; and 5) more than 95% of the absolute values of Me are less than 1.96 S*2, i.e.,
 .
.
Step 6: Annual rainfall estimation The subbasins that are monitored by the 11 flow gauging stations were subdivided into 2 km × 2 km quincunx grids. The annual rainfalls for the grids were estimated using equations (4) and (5), and then were averaged to get annual rainfalls for the subbasins.
 (4)
(4)
 (5)
(5)
where  and
and  are Lagrange multipliers;
  and
and  are the variograms between station
  and
and , and station
  and
and , respectively;
  is the weight of observed
  at
at  of station
 ;
;  is the weight of observed
  at
at  of station
 ;
;  and
and  are the
  drift basis functions of station
  and
and , respectively;
  is the variance of error.
2.3.2. Annual Water Surface Evaporation Estimation
The aforementioned six steps for annual rainfall estimation were also implemented to estimate the annual water surface evaporations for the subbasins. Herein, the data at 24 stations were used.
2.3.3. Regional Regression Model Establishment
The flow hydrographs observed at the 11 gauging stations were used to calculate the annual runoffs for the years from 1956 to 2006. The maximum annual usage of surface water was 2271.38 Mm3, accounting for only 0.66% of the total annual runoff observed at the Cuogang station. This station is located at the Hailar River mouth. This indicates that the water usage can be neglected when estimating natural runoff.
As stated above, the dependent variable is annual runoff (R), while the independent variables are annual rainfall (P), annual water surface evaporation (E) calculated using the MUKSE, subbasin centroid coordinates (X, Y), subbasin centroid elevation (H), subbasin area (AB), subbasin wetland area (AW), and subbasin shape factor (K) that was calculated by the Hailar Hydrographic Bureau.
The regression was done using the PCR technique embedded in the Eviews 7.0 software package. The crucial feature of this technique is to transform the independent variables into unrelated principal components, each of which is a linear combination of the independent variables. R is regressed on the principal components. The regression procedure implemented in this study is as follows: 1) calculate the eigenvalues ( ) and eigenvectors
 ; 2) calculate the principal components of the independent variables as:
 (6)
(6)
where  (
( ) are functions of the independent variables and independent of each other. Generally, the change of independent variables can be sufficiently described by first m principal components
 . This study used a cutting point that the accumulative contribution rate of
  reach a threshold value of 85%; 3) Build a linear regression of R on the principal components
  expressed as equation (7), and let
  as equation (8); and 4) calculate the standardized regression coefficients
  can be calculated by using equation (8) and the coefficients
  of the original independent variables, as then according to the relationship
 , (where
 ,
, are standard deviation of Y and
 ) to calculate the coefficients
  of the original independent variables.
 (7)
(7)
 (8)
(8)
For each year from 1956 to 2006, the rational regression model in terms of the independent variables can be expressed as:
 (9)
(9)
3. Results and Discussion
3.1. Annual Rainfall and Water Surface Evaporation Estimation
The Fourier cycle analysis shows that the annual rainfall and water surface evaporation series have 7-, 18- or 44-year cycles. Using the 44-year cycle in the moving average method, it was found that the series for each gauging station met the stationary requirement of the MUKSE.
The calculated experimental variograms in different directions revealed that the point gropes were comparatively concentrated and had obvious trends, indicating that rainfall and evaporation had anisotropic spatial structures. The optimal simulation indicated that for rainfall, the semimajor is 555 km, the semiminor is 315 km, the direction angle is 58°, and the anisotropy ratio is 1.762, and for evaporation, the semimajor is 580 km, the semiminor is 240 km, the direction angle is 92°, and the anisotropy ratio is 2.417. Further, the overlapping theoretical variogram model and spatial drift equation are judged to be reasonable (Table 2), and the MUKSE can be used to estimate the annual rainfalls and water surface evaporations for the subbasins within the study area (Figures 2 and 3).
3.2. Annual Runoff Estimation
The MUKSE and PCR for estimating annual runoff were
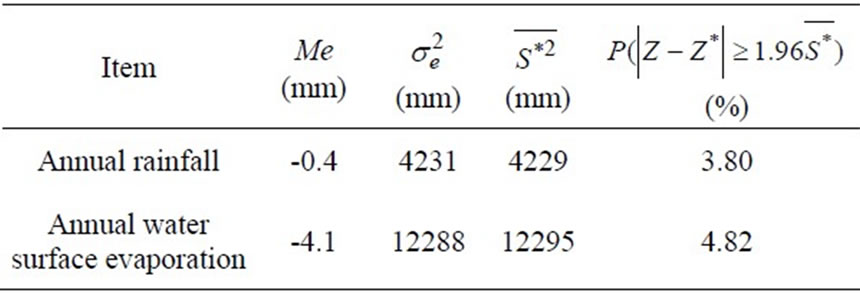
Table 2. The testing results of theoretical variogram and spatial drift equation.
 (a)
(a) (b)
(b)
Figure 2. Plots showing the (a) error and (b) standard deviation for annual rainfall.
 (a)
(a) (b)
(b)
Figure 3. Plots showing the (a) error and (b) standard deviation for annual water surface evaporation.
judged to be good, as indicated by large R2 > 0.826 (Figure 4) and the significant F statistics (p-value < 0.05), while somewhat multicollinearity likely exists because the adjoint probability t-test of independent variables in the model were insignificant at a significance level of  = 0.05. The multicollinearity problem was resolved by using the principal components. Further, the model did a very good job in reproducing the observed annual runoffs at the 11 flow gauging stations (Figure 5).
Table 3 presents the coefficients of independent variables for the model (i.e., Equation 9). It shows that annual rainfall, basin centroid coordinates, basin centroid elevation and basin shape factor are positively correlated with annual runoff, implying that annual runoff tends to increase with the increase of these independent variables. Because rainfall is the origin of runoff generation, more rainfall will logically generate more runoff. The increase trend of runoff with longitude, latitude and elevation is consistent with that presented by a runoff depth isogram developed by the Hailar Hydrologic Bureau. On the other hand, annual water surface evaporation, subbasin area and subbasin wetland area are negatively correlated with annual runoff, implying that annual runoff tends to decrease with the increase of these independent variables. Evaporation can reduce the portion of rainfall to be converted into runoff, while wetlands likely increase surface storage, lowering the generation of runoff.

Figure 4. Regressed coefficient R2 of the annual runoff and basin characteristics.


Figure 5. Plots showing the model estimated vs. observed annual runoffs at the 11 flow gauging stations.

Table 3. The coefficients of Equation 9.

Table 4. The estimated subbasin annual runoffs for various return periods.
3.3. Subbasin Annual Runoff Estimation
For the subbasins that are not monitored by the 11 stations, the annual runoffs for the years from 1956 to 2006 were estimated using Equation (9) with model coefficients presented in Table 3.
Based on the estimated annual runoffs, the means, coefficients of variation ( ), and ratios of coefficients of skewness (
 ) to
) to  were computed and are presented in Table 4. In terms of the
  and
and , the runoffs for the return periods of interest (i.e., 75, 90, 95, and 97%) were computed by assuming a Person-III distribution and are also shown in Table 4.
4. Conclusions
This study set up a regional regression model by using the observed data of annual runoff, annual rainfall, annual water surface evaporation as well as other basin characteristics of the Hailar River basin from 1956 to 2006, through the methods of multiple-period universal kriging spatial estimation theory (MUKSE) and principal component regression (PCR) technique.
The testing results indicated that MUKSE was an effective method to estimate annual rainfall and annual water surface evaporation of ungauged subbasins, and PCR can resolve multicollinearity problem with a significant correlation (R2 > 0.87) between annual runoffs and the subbasin characteristics. Finally, the model was used to predict the amounts of runoff for the return period of interest. These results will add invaluable information to existing literature.
5. Acknowledgements
The authors appreciate Dr. Daniel Marble, Head of Engineering and Physics Department at Tarleton State University for sponsoring the primary author (Duan) to conduct this research as an international visiting scholar.
REFERENCES
- L. Oyebande, “Water Problems in Africa-How Can Sciences Help,” Hydrological Sciences Journal, Vol. 46, No. 6, 2001, pp. 947-961.
- J. C. Rodda, “Water under Pressure,” Hydrological Sciences Journal, Vol. 46, No. 6, 2001, pp. 841-853.
- D. Mazvimavi, A. M. J. Meijerink, H. H. G. Savenije and A. Stein, “Prediction of Flow Characteristics Using Multiple Regression and Neural Networks: A Case Study in Zimbabwe,” Physics and Chemistry of the Earth, Vol. 30, 2005, pp. 639-647.
- S. M. Chiang, T. K. Tsay and S. J. Nix, “Hydrologic Regionalization of Watersheds. I: Methodology,” Journal of Water Resources Planning and Management, Vol. 128, No. 1, 2002, pp. 3-11.
- D. M. Thomas and M. A. Benson, ‘‘Generalization of Streamflow Characteristics from Drainage-basin Characteristics,’’ U.S. Geological Survey Water-Supply Paper, 1970, pp. 1975.
- M. W. Busby, ‘‘Yearly Variations in Runoff for the Conterminous United States, 1931–60,’’ U.S. Geological Survey Water-Supply Paper, 1963, pp. 1669-S.
- W. A. Gebert, D. J. Graczyk and W. R. Krug, ‘‘Average Annual Runoff in the United States, 1951–80.’’ Hydrologic Investigations Atlas, 1987, pp. HA-70.
- G. D. Bishop and M. R. Church, ‘‘Automated Approaches for Regional Runoff Mapping in the Northeastern United States,’’ J. Hydro., Amsterdam, Vol. 138, 1992, pp. 361-383.
- N. W. Arnell, ‘‘Grid Mapping of River Discharge,’’ J. Hydro., Amsterdam, Vol. 167, 1995, pp. 39-56.
- N. E. Hawley and R. H. McCuen, ‘‘Water Yield Estimation in Western United States,’’ J. Irrig. and Drain. Div., Vol. 108, No. 1, 1085, pp. 25-35.
- R. M. Vogel, C. Bell and N. M. Fennessey, ‘‘Climate, Streamflow and Water Supply in the Northeastern United States,’’ J. Hydro., Amsterdam, Vol. 198, 1997, pp. 42-68.
- S. I. Majtenyi, ‘‘A Model to Predict Annual Watershed Discharge,’’ J. Hydr. Div., Vol. 93, No. 7, 1972, pp. 1171-1186.
- S. M. Vogel, I. Wilson and C. Daly, “Regional Regression Models of Annual Streamflow for the United States,” Journal of Irrigation and Drainage Engineering, Vol. 125, 1999, pp. 148-157.
- H. W. Lull and W .E. Sopper, ‘‘Factors that Influence Streamflow in the Northeast,’’ Water Resour. Res., Vol. 2, No. 3, 1966, pp. 361-369.
- C. G. Johnson, ‘‘A Proposed Streamflow Data Program for Central New England,’’ Open-File Rep., U.S. Geological Survey, Boston, Mass.
- E. McAlister, N. Domburg and R. Aspinall, “Environmental Mapping and Modeling of a Catchment Using GIS,” 1997. Internet Available: http://gis.esri.com/library/userconf/proc97/proc97/to700/pap673/p673.htm.
- M. K. Nagarag, S. C. Yaragal and G. Rajasekhar, “Runoff Estimation Using GIS Techniques,” Proceedings of International Conference on Hydrology and Watershed Management, Vol. 2, 2002, pp. 466-473.
- S. Anbazhagan, S. M. Ramasamy and S. Das Gupta, “Remote Sensing and GIS for Artificial Recharge Study, Runoff Estimation and Planning in Ayyar Basin, Tamil Nadu, India,” Environ Geol, Vol. 48, 2005, pp.158-170.
- A. Sargaonkara, R. Vijaya and A. Guptaa, “Quantitative Assessment of Annual Runoff in Sub-catchments Using GIS: a Case Study of the Tapi River Basin, India,” International Journal of Environmental Studies, Vol. 63, No. 2, 2006, pp. 189-199.
- Y. Zhu and L. D. Rick, “Regression Modeling of Streamflow, Baseflow, and Runoff Using Geographic Information Systems,” Journal of Environmental Management, Vol. 90, 2009, pp. 946-953.
- L. Zhang, X. Fang, G. Ren and X. Suo, “Environmental Changes in the North China Farming Grazing Transitional Zone,” Earth Science Frontiers, Vol. 4, 1997, pp. 127-136.
- C. Fu, H. Wei, M. Chen, B. Su, M. Zhao and W. Zhen, “Evolution of Summer Monsoon Rain Belts over East China in a Regional Climate Model,” Chinese Journal of Atmospheric Sciences, Vol. 22, 1998, pp. 522-534.
- Y. Liu, G. Bao, H. Song, Q. Cai and J. Sun, “Precipitation Reconstruction from Hailar Pine (Pinus sylvestris var. mongolica) Tree Rings in the Hailar Region, Inner Mongolia, China Back to 1865 AD,” Palaeogeography, Palaeoclimatology, Palaeoecology, Vol. 282, 2009, pp. 81-87.
- T. Liu and B. Chaolun, “The Application of Multiple-period Universal kriging Spatial Estimation Throry in Hydrology,” Chinese Journal of Hydrology Engineering, Vol. 2, 1995, pp. 76-83.
- M. Coulibaly and S. Becker, “Spatial Interpolation of Annual Precipitation in South Africa-Comparison and Evaluation of Methods,” Water International, Vol. 32, No. 3, 2007, pp. 494-502.
- D. Kastelec and K. Košmelj, “Spatial Interpolation of Mean Yearly Precipitation Using Universal kriging,” Developments in Statistics, Vol. 17, 2002, pp. 149-162.
- R. Mao, E. Li and Z. Liu, “Optimal Estimation of Point and Surface Rainfall,” Chinese Journal of Wuhan University, Vol. 5, 1991, pp. 47-52.
- R. M. Lark, “A Comparison of Some Robust Estimations of the Variogram for Use in Soil Survey,” European Journal of Soil Science, Vol. 51, 2000, pp. 136-157.
- X. Liu, B. Chaolun, L. Wang and H. Wang, “The Application of Multiple-period Universal kriging Model in Interpolation of Rainfall,” China Rural Water and Hydropower, Vol. 0, No. 1, 2010, pp. 34-38.
NOTES
*This research is supported by the “Inner Mongolia Agricultural Univ. Cold-Arid Region Water Resources Utilization Program (NDTD2010- 6)” and “National Natural Science Foundation of China (#51069005).”