Materials Sciences and Applications
Vol.10 No.09(2019), Article ID:95148,14 pages
10.4236/msa.2019.109043
Effect of Sliding Wear on Surface Microstructure and Wear Property of D2 Wheel Steel
Chunpeng Liu1,2, Xiujuan Zhao1,2, Pengtao Liu1,2, Jinzhi Pan3, Ruiming Ren1,2*
1School of Material Science and Engineering, Dalian Jiaotong University, Dalian, China
2Key Laboratory of Critical Materials of Rail Transportation in Liaoning Province, Dalian Jiaotong University, Dalian, China
3National and Local Joint Engineering Center of Rail Transit Equipment Design and Manufacturing Technology, Dalian Jiaotong University, Dalian, China

Copyright © 2019 by author(s) and Scientific Research Publishing Inc.
This work is licensed under the Creative Commons Attribution International License (CC BY 4.0).
http://creativecommons.org/licenses/by/4.0/


Received: August 7, 2019; Accepted: September 16, 2019; Published: September 19, 2019
ABSTRACT
In this paper, the surface microstructure and wear property of D2 wheel steel under sliding wear condition were studied by MRH-30 sliding wear tester. After testing, a transmission electron microscope (TEM), scanning electron microscope (SEM) with electron backscatter diffraction (EBSD), and micro-hardness testers were used to characterize the surface microstructure of samples with different cycles. The results show that the wear losss samples are increased as the increase of cycles, and the wear loss of wheel samples is higher than that of rail samples. The surface hardness and thickness of deformation layer of wheel samples are increased as the cycles increase. After sliding wear, the samples surfaces form the white etching layer with the thickness of several microns. Through the analysis of surface microstructure of sample with 12,000 cycles, the lamellar cementite in pearlite is fragment into cementite particles with the decrease of depth from surface, and the cementite is dissolved at surface to lead to the form of white etching layer. The ferrite grains are refined gradually and the fraction of high angle grain boundary is increased with the decrease of depth from surface. The nanosgrains layer of ferrite grains with 5 μm thickness is formed. According to the result of finite element simulation of contact surface temperature, the formation of surface nanograins and the dissolution of cementite are caused by the severe plastic deformation. The fiber structure of samples is formed after sliding wear, with direction of <110>.
Keywords:
D2 Wheel Steel, Sliding Wear, Surface Microstructure, White Etching Layer

1. Introduction
In recent years, the rolling contact fatigue and wear of train wheels are more severe with increase of operation speed and axle load. The severe wear and rolling contact fatigue of wheel surface are not only causing the economic loss but also the rise of traffic accident. The evolution of surface microstructure of wheels is the main reasons to cause the wheel failure [1] [2] [3] . Therefore, the investigation of evolution of surface microstructure of wheel steel is important to study the mechanism of wear and rolling contact fatigue failure.
The sliding wear is the ultimate operation condition of trains, which will occur at turning and the brake process. During sliding wear process, the wheel surface will produce high temperature and shear stress to lead to the sharply change of surface microstructure, such as nanograin layer [4] [5] [6] [7] , dynamic recrystallization [8] , new phase [9] . The contact surface of wheel-rail material will also form white etching layer (WEL) during sliding wear or rolling-sliding wear process. The hardness of WEL can reach up to 1200 HV [10] [11] . As the hard and brittle defect, the fatigue cracks will initiate at the interface between WEL and deformation layer due to the inharmonious plastic deformation. The contact temperature and plastic deformation are main factors to result in the formation of WEL at surface of wheel-rail material. The research results of Wösterle et al. and J. Takahashi et al. [12] [13] show that the martensite was produced in WEL owing to the sharp cooling. However, Lojkowski et al. [14] and Baumann et al. [15] [16] proposed that the WEL was nanograin of α-Fe with 15 - 500 nm, and the cementite was dissolved by severe plastic deformation. Therefore, the mechanism of the formation of WEL is not uniform.
In present paper, the surface microstructure and wear property of D2 wheel steel under sliding wear condition were studied by MRH-30 sliding wear tester. After testing, a transmission electron microscope, scanning electron microscope with electron backscatter diffraction, and micro-hardness testers were used to characterize the surface microstructure of samples with different cycles. The contact temperature is analyzed by finite element simulation to obtain the mechanism of the formation of WEL.
2. Material and Methods
The chemical composition of D2 wheel steel in test was C 0.53, Si 1.0, Mn 1.0, and Fe balance (mass %). The original microstructure of the wheel samples was formed of pearlite and proeutectoid ferrite (PF). The original hardness of the wheel samples was around 330 HV, and the yield strength and tensile strength of the wheel samples were 615 and 955 MPa, respectively. The rail samples comprised U71Mn and had an original hardness of approximately 360 HV; the yield strength and tensile strength of the rail samples were 880 and 900 MPa, respectively. The sample dimensions of the wheel/rail and their contact mode are shown in Figure 1. The experiment load was 200 N, the rolling speed was 400 r/min and the cycle was 200 cycles, 800 cycles, 4000 cycles and 12,000 cycles. The
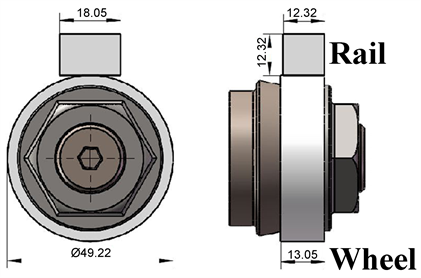
Figure 1. Sample dimensions and contact mode of wheel/rail samples (unit: mm).
operation condition was dry sliding wear. The samples were cooled by a fan and stopping the wear tester every 10 s to cooling the contact surface.
After the test, the surface microstructure from different cycles was analyzed by using a Lecia optical microscope (OM), Zeiss Supra 55 field-emission scanning electron microscope (SEM) with electron backscatter diffraction (EBSD) and a JSM-2100 field-emission transmission electron microscope (TEM). The longitudinal section thin film for TEM sample was prepared by following steps: Firstly, grinding the film to a thickness of about 30 μm with sandpaper, and then using Gatan ion thinning machine to carry out ion thinning. Finally, a thin region with a thickness of about 100 nm was obtained to carry out analyze by TEM with accelerating voltage of 200 kv. The samples for EBSD are prepared by cutting, grinding, polishing for 20 minutes with SiO2 polishing fluid, and then vibrating polishing for 40 minutes. Finally, the surface microstructure uses Zeiss Supra field emission scanning electron microscope for EBSD analyzed by use of by EBSD with accelerating voltage of 15 kv. The surface microhardness was measured by using an FM-700 microhardness tester with a loading of 0.01 kg. The dwell time was 15 s.
Three-dimensional finite element model of wheel and rail specimen is established by solid element. Ls-dyna software was used to simulate the temperature of wheel and rail samples under pure sliding conditions within 10s. In the simulation, an angular velocity of 400 r/min was applied to the wheel and rail specimen, and a constant force load of 200 N was applied to the wheel specimen. The wheel/rail samples were modeled using a linear elastoplastic material, with modulus (E) is 210 GPa, Poisson’s ratio is 0.3, yield strength limit is 600 MPa, tangent modulus Etan is 21 GPa, friction coefficient μ is 0.6.
3. Results and Discussion
3.1. The Wear Behavior
Figure 2 is shown the wear loss profile wheel/rail samples. The wear loss of wheel/rail samples is increased with increase of cycles. And the wear loss of

Figure 2. The wear loss of wheel/rail samples with different cycles.
wheel samples are higher than that of rail samples. The wear morphology of wheel samples with different cycles is displayed in Figure 3. The surface morphology of original sample exist obviously machining mark with the peak and valley, as shown in Figure 3(a). It can be seen that the surface morphology of samples is relatively flat and no obvious cracks at 200 cycles. At 800 cycles, the samples surface produces a small amount of cracks, as shown in Figure 3(b). At 4000 cycles, the samples surface produce obvious cracks (Figure 3(c)). At 12,000 cycles, the cracks of samples surface are more severe, and the some cracks happen the flaking to cause the wear failure of samples. As a result, the wear mechanism of samples is that the cracks are flaked gradually as the cycles increase to cause the wear loss. Figure 4 is the SEM micrograph of the relationship between cracks of wheel samples and microstructure at 12,000 cycles. The cracks initiate the surface. The reason is that the maximum shear stress of samples is at surface under sliding wear condition. and the cracks propagate along the interface between fine grain layer and matrix. That is because the fine grain layer and matrix is the inharmonious plastic deformation.
3.2. Surface Hardness
The hardness profile of wheel samples at different depth from surface with different cycles is shown in Figure 5. The original hardness of the wheel samples was around 330 HV. At 200 cycles, the surface hardenss is about 330 HV. At 800 cycles, the surface hardness is about 350 VH, and the thickness of hardening layer is about 10 μm. At 4000 cycles, the change rule of hardness is similar to that at 12,000 cycles. It is that the hardness is declining with increase of depth from surface. While the surface hardness at 4000 cycles is lower than that at 12,000 cycles, which is about 670 HV. The thickness of hardening layer is about 23 μm. At 12,000 cycles, the thickness of hardening layer is maximum, which is about 40 μm. With the increase of cycles, the thickness of plastic deformation layer is increased gradually, as shown in Figure 6. Therefore, the thickness of

Figure 3. The wear morphology of wheel samples with different cycles (a) original sample (b) 200 cycles (c) 800 cycles (d) 4000 cycles (e) 12,000 cycles.

Figure 4. The SEM images of the relationship between D2 wheel steel’s fatigue cracks and microstructure at 12,000 cycles.
hardening layer is increased grauually. The surface hardness of samples is about 780 HV, which is similar to the result of H. W. Zhang et al. [17] and Sarvesh Pal
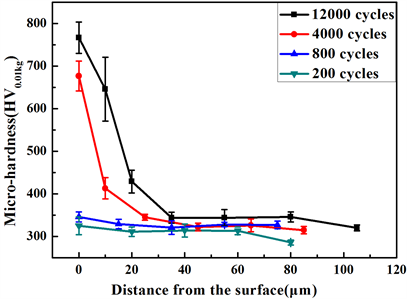
Figure 5. The hardness profile of wheel samples at different depth from surface with different cycles.
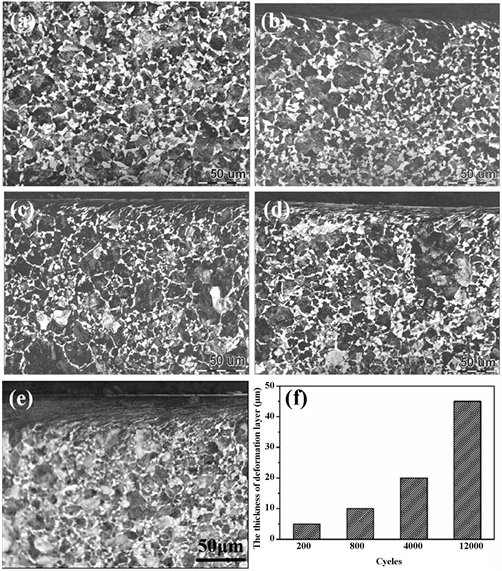
Figure 6. The OM micrographs of wheel samples with different cycles (a) original microstructure (b) 200 cycles (c) 800 cycles (d) 4000 cycles (e) 12,000 cycles (f) the thickness of deformation layer with different cycles.
et al. [18] . During sliding wear process, the degree of plastic deformation is the most severe at surface due to the maximum shear stress. The refinement of ferrite grains, the increase of dislocation density and the dissolution of a part of cementite are the main reasons to enhance the surface hardness to 780 HV. Therefore, the surface hardness is the maximum. With the increase of depth from surface, the hardness of samples is decreased gradually. At depth of 40 μm from surface, the hardness of samples is consisted with the matrix hardness, which is about 330 HV. With increase of depth from surface, the shear stress is decreased gradually. As a result, the degree of plastic deformation is decreased gradually. So the hardness of samples is dropped gradually.
3.3. Surface Microstructure
The OM micrographs of wheel samples with different cycles are shown in Figure 6. The original microstructure of the wheel samples is formed of pearlite and proeutectoid ferrite (PF). At 200 cycles, no obvious deformation layer is formed on the surface of sample, but the proeutectoid ferrite on the top layer is distorted. At 800 cycles, a deformation layer of about 10 μm is formed on the surface of the sample, and a discontinuous white etching layer is formed on the top layer with a thickness of about 2 μm. The formation of WEL indicates that apart of cementite are dissloved at sample surface. As the cycles increased, the thickness of the deformation layer gradually increased. At 12,000 cycles, the surface of the sample is deformed to a thickness of about 45 μm, and there is an intermittent white etching layer on the surface. During sliding wear process, through the wear loss is increase according to cycles (Figure 2). However, the formation of plastic deformation layer is rapid as the sliding wear process. Hence, the degree of plastic deformation is accumulated as cycle increase. The thickness of plastic deformation layer is increased according to cycles.
At 12,000 cycles, the degree of plastic deformation of the sample is the most serious and the surface forms an intermittent white layer. Therefore, the surface microstructure of the sample from the surface to the matrix at 12,000 cycles is analyzed systematically by SEM with EBSD and TEM.
Figure 7 shows the SEM micrograph of the longitudinal section of the sample from the surface to the matrix at 12,000 cycles. The microstructure from the surface to the center is divided into four layers: nanocrystalline layer (NL), severely plastic deformed layer (SPDL), plastic deformed layer (PDL) and original microstructure. As shown in Figure 7(b), the grain size in the nanocrystalline layer cannot be distinguished by SEM, and the cementite in the pearlite is dissolved obviously. In SPDL, the plastic deformation of pearlite and proeutectoid ferrite is obvious, and the ferrite grains are obviously parallel to the sliding direction. Moreover, the lamellar cementite in the pearlite is completely fragmented, as shown in Figure 7(c). In PDL, it can be seen from Figure 7(d) that the pearlite and proeutectoid ferrite in the deformation layer is distorted. However, the lamellar cementite in the pearlite is not borken. The lamellar spacing of pearlite is significantly reduced relative to the original micorstructure. The pearlite and proeutectoid ferrite are nor deformed at depth of about 40 μm from surface.
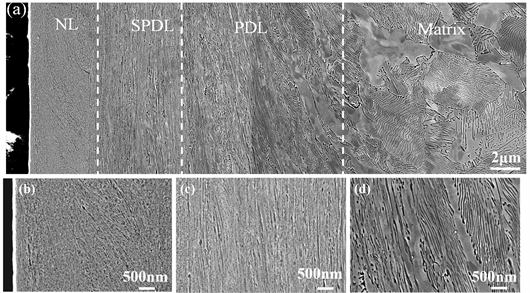
Figure 7. The SEM micrograph of wheel samples at 12,000 cycles (a) low magnification micrograph from surface to the matrix (b) nanograin layer (NL) (c) severe plastic deformation layer (SPDL) (d) plastic deformation layer (PDL).
The microstructure changes of nanocrystalline layer and SPDL are analyzed by use of TEM and EBSD. Figure 8 presents the bright field images with different distances from the surface and the corresponding selected diffraction. It can be seen from the Figure 8 that the cementite and ferrite grains in the pearlite are lamellar at 27 - 30 μm from the surface, and a large amount of dislocations are formed in the lamellar ferrite. At 10 - 13 μm from surface, the ferrite grains in pearlite are still lamellar. However, the lamellar ferrite grains are sample parallel to the sliding direction, and the lamellar spacing relative to the original microstructure decreased significantly. A circular discrete diffraction spots is displayed in this area. Therefore, it is possible that fiber structure is formed in this region. In the region 4 - 7 μm away from the surface, it can be seen from the bright field image that the ferrite grains are obviously refined and the corresponding diffraction spots gradually form a ring. The continuous ring formation of the selected diffraction spots may be due to the gradual increase of high angle grain boundary in this region [19] . Within a distance of 0 - 3 μm from the surface, the diffraction spots completely form a continuous ring, and the ferritic grains in this region are refined to about 100 nm by observation pg high magnification bright and dark field images (Figure 9(a) and Figure 9(b)).
According to the reseach of Fecht et al. [20] and Valiev et al. [21] , during severe plastic deformation process, the formation of nanograins on the surface is divided into three stages. In the first stage, a large amount of dislocations are produced in the ferrite grains, and a large number of dislocations lead to the formation of the cellular structure. In second stage, with gradually increase of the degree of plastic deformation, the cellular structure gradually transform into the subgrains. In the last stage, when the balance between dislocation multiplication rate and annihilation rate is reached, the subgrains in the ferrite gradually transform into the high angle grain boundary. Therefore, the selection diffraction is a ring at the top layer. This process, which the dislocations transform into
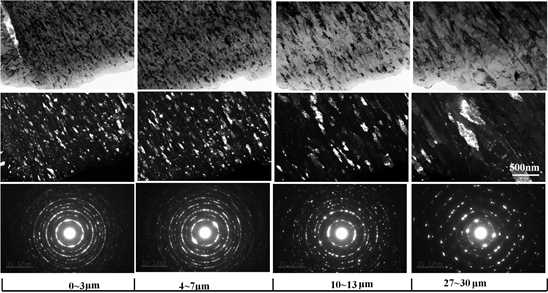
Figure 8. The longitudinal section TEM micrograph of wheel samples with 12,000 cycles at different positions from surface.
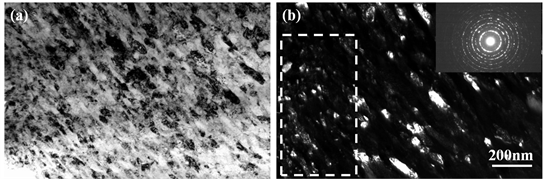
Figure 9. The surface TEM images of D2 wheel steel at 1.2 × 10⁴ cycles. (a) bright-field (BF) image, (b) dark-field (DF) image with selected area electron diffraction (SAED) image.
high angle grain boundary, is continuous dynamic recrystallization (cDRX). For high fault energy materials, cDRX can occur from 0 to 1 at any T/Tm (T is the actual contact surface temperature and Tm is the melting point of the material) in the severe plastic deformation process [22] [23] [24] . Another grain refinement mechanism, discrete dynamic recrystallization (dDRX), can also refine surface grains to nanograins. The grain refinement mechanism of dDRX is mainly determined by temperature. And the sample temperature must reach T/Tm ≈ 0.5. H.Q. Sun et al. [25] studied the grain refinement mechanism of magnesium alloy through SMAT and found that it is mainly through the dDRX mechanism to refine grain to nano level. The diffraction spots (112) and (120) of the cementite are not found inside the ring (110). It is possible that the cementite is dissolved at surface result in the formation of white etching layer. Therefore, finite element simulation is carried out to calculate the contact surface temperature of samples during sliding wear process. According to Figure 10(b), the maximum surface temperature of the wheel sample was 25˚C within 10 s. The wear tester is stopped and cooled every 10 s during the test. The maximum surface temperature of the wheel sample could not reach the point of dDRX and martensite transition temperature. Therefore, the grain refinement and cementite dissolution of the surface layer is mainly caused by severe plastic deformation.
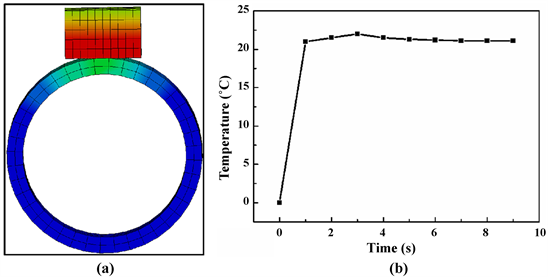
Figure 10. The finite element simulation of contact surface temperature (a) temperature field (b) the variation profile of contact surface temperature.
In order to further study the change of grain misorientation at different positions away from the surface and the fiber structure in the deformation layer, EBSD is used to perform on the longitudinal section of the sample at different positions away from the surface, as shown in Figure 11 and Figure 12. According to Figure 11, the region, which is at depth of 17 - 21 μm away from the surface, is the PDL region. In this region, the ferrite grains are mainly the low angle grain boundary and the fraction of high angle grain boundary is only 12%. In the region 11 - 15 μm away from the surface, the fraction of high angle grain boundary is about 25%. In the region 6 - 10 μm away from the surface, the fraction of high angle grain boundary is around 51%. The fraction of high angle grain boundary increases gradually as the distance from the surface decreases. However, within 0 - 5 μm zone, the ferrite grains cannot be resolved by EBSD due to its high resolution and stress on the outermost layer. The results of TEM and EBSD images are consistent. With the decrease of the distance from the surface, the high angle grain boundary is increased and ferrite grains are refined gradually.
Figure 12(a) and Figure 12(b) present the polar figure of wheel samples at 12,000 cycles and original sample, respectively. As can be seen from Figure 12(b), obvious fiber structure is formed in the deformation layer. Ferrite grains in pearlite are polycrystalline materials. In the process of sliding wear, the shear stress on the surface is the maximum. Therefore, the direction of ferrite grains in the pearlite in the deformation layer is gradually parallel to the running direction from the matrix to the surface. This plastic deformation mode is similar to other severe deformation modes such as high pressure torsion HPT and pearlite drawing [19] [27] . Ferrite is body centered cubic, and the main slip system of body centered cubic is {110}<111>. While the ferrite grain rotation is mainly parallel to <110> crystal orientation. Because <110> crystal orientation of body centered cubic grains is stable, while <111> and <100> crystal orientation is unstable, as shown in Figure 10(c) and Figure 10(d). Therefore, in the process of severe plastic deformation, polycrystalline ferrite grains mainly form texture in the direction of <110> [26] [27] [28] [29] .

Figure 11. The longitudinal section EBSD images of D2 wheel steel at 1.2 × 10⁴ cycles at different positions from surface (red line: θ > 15˚, green line: θ < 15˚, HAGB: θ > 15˚).

Figure 12. The pole figure of wheel samples. (a) deformation layer of sample at 1.2 × 10⁴ cycles (b) the original sample (c) <110> crystalline texture of deformation layer of sample at 1.2 × 10⁴ cycles (d) <111> crystalline texture of deformation layer of sample at 1.2 × 10⁴ cycles.
4. Conclusions
The surface microstructure and wear property of D2 wheel steel under sliding wear condition were studied by MRH-30 sliding wear tester. After testing, a transmission electron microscope, scanning electron microscope with electron backscatter diffraction, and micro-hardness testers were used to characterize the surface microstructure of samples with different cycles. The conclusions are summarized as follows:
1) The wear loss of samples is increased as the increase of cycles. And the wear loss of wheel samples is higher than that of rail samples. The amount of surface cracks of samples is increased with the increase of cycles. The flake of surface cracks leads to the wear failure of samples.
2) The surface hardness of samples is increased as the increase of cycles. At 12,000 cycles, the surface hardness of samples is about 780 HV, which is similar to the hardness of WEL. The refinement of ferrite grains, the increase of dislocation density and the dissolution of a part of cementite are the main reasons to enhance the surface hardness. With the increase of depth from surface, the hardness of samples is decreased gradually.
3) The surface microstructures of samples at 12,000 cycles are systematically analyzed. The degree of plastic deformation gradually increases from matrix to surface. With the decrease of the distance from the surface, the cementite in the pearlite gradually broke into particles from lamellar, and cementite in the top surface layer is dissolved to form a WEL. The ferrite grains in pearlite gradually refined and the fraction high angle grain boundary ratio gradually increased as the decrease of the distance from the surface. The maximum contact surface temperature of the sample is 25˚C within 10 s. Therefore, the surface nanocrystalline and cementite dissolution are caused by severe plastic deformation.
4) By comparing the polar figure of the deformation layer and the original sample, the fiber structure is formed obviously in the deformation layer, and the fiber structure direction of ferrite grains is mainly <110>.
Acknowledgements
This research was supported by National Key Basic Research Program of China (No. 2015CB654802).
Conflicts of Interest
The authors declare no conflicts of interest regarding the publication of this paper.
Cite this paper
Liu, C.P., Zhao, X.J., Liu, P.T., Pan, J.Z. and Ren, R.M. (2019) Effect of Sliding Wear on Surface Microstructure and Wear Property of D2 Wheel Steel. Materials Sciences and Applications, 10, 600-613. https://doi.org/10.4236/msa.2019.109043
References
- 1. Sato, Y., Matsumoto, A. and Knothe, K. (2002) Review on Rail Corrugation Studies. Wear, 253, 130. https://doi.org/10.1016/S0043-1648(02)00092-3
- 2. Ahlstrom, J. and Karlsson, B. (1999) Microstructural Evaluation and Interpretation of the Mechanically and Thermally Affected Zone under Railway Wheel Flats. Wear, 232, 1-14. https://doi.org/10.1016/S0043-1648(99)00166-0
- 3. Khourshid, A.M., Gan, Y.X. and Aglan, H.A. (2001) Microstructure Origin of Strength and Toughness of a Premium Rail Steel. Journal of Materials Engineering and Performance, 10, 331. https://doi.org/10.1361/105994901770345042
- 4. Ganapathi, S. and Rigney, D. (1990) An HREM Study of the Nanocrystalline Material Produced by Sliding Wear Processes. Scripta Metallurgica et Materialia, 24, 1675-1678. https://doi.org/10.1016/0956-716X(90)90526-M
- 5. Wang, T.S., Yang, J., Shang, C.J., Li, X.Y., Lv, B., Zhang, M. and Zhang, F.C. (2008) Sliding Friction Surface Microstructure and Wear Resistance of 9SiCr Steel with Low-Temperature Austempering Treatment. Surface & Coatings Technology, 202, 4036-4040. https://doi.org/10.1016/j.surfcoat.2008.02.013
- 6. Kato, H., Sasase, M. and Suiya, N. (2010) Friction-Induced Ultra-Fine and Nanocrystalline Structures on Metal Surfaces in Dry Sliding. Tribology International, 43, 925-928. https://doi.org/10.1016/j.triboint.2009.12.040
- 7. Wang, X., Wei, X.H., Hong, X.L., Yang, J.Y. and Wang, W.R. (2013) Formation of Sliding Friction-Induced Deformation Layer with Nanocrystalline Structure in T10 Steel against 20CrMnTi Steel. Applied Surface Science, 280, 381-387. https://doi.org/10.1016/j.apsusc.2013.04.165
- 8. Emge, A., Karthikeyan, S. and Rigney, D. (2009) The Effects of Sliding Velocity and Sliding Time on Nanocrystalline Tribolayer Development and Properties in Copper. Wear, 267, 562-567. https://doi.org/10.1016/j.wear.2008.12.102
- 9. Li, J.G., Umemoto, M., Todaka, Y. and Tsuchiya, K. (2006) Nanocrystalline Structure Formation in Carbon Steel Introduced by High Speed Drilling. Materials Science and Engineering A, 435-436, 383-388. https://doi.org/10.1016/j.msea.2006.07.036
- 10. Eyre, T.S. and Baxter, A. (1972) The Formation of White Layers at Rubbing Surfaces. Tribology International, 5, 256-261. https://doi.org/10.1016/0041-2678(72)90104-2
- 11. Feller, H.G. and Walf, K. (1991) Surface Analysis of Corrugated Rail Treads. Wear, 144, 153-161. https://doi.org/10.1016/0043-1648(91)90012-J
- 12. Österle, W., Rooch, H., Pyzalla, A. and Wang, L. (2001) Investigation of White Etching Layers on Rails by Optical Microscopy, Electron Microscopy, X-Ray and Synchrotron X-Ray Diffraction. Materials Science and Engineering A, 303, 150-157. https://doi.org/10.1016/S0921-5093(00)01842-6
- 13. Takahashi, J., Kawakami, K. and Ueda, M. (2010) Atom Probe Tomography Analysis of the White Etching Layer in a Rail Track Surface. Acta Materialia, 58, 3602-3612. https://doi.org/10.1016/j.actamat.2010.02.030
- 14. Lojkowski, W., Djahanbakhsh, M., Bürkle, G., Gierlotka, S., Zielinski, W. and Fecht, H.J. (2001) Nanostructure Formation on the Surface of Railway Tracks. Materials Science and Engineering: A, 303, 197-208. https://doi.org/10.1016/S0921-5093(00)01947-X
- 15. Baumann, G., Fecht, H. and Liebelt, S. (1996) Formation of White-Etching Layers on Rail Treads. Wear, 191, 133-140. https://doi.org/10.1016/0043-1648(95)06733-7
- 16. Baumann, G., Knothe, K. and Fecht, H. (1997) Surface Modification, Corrugation and Nanostructure Formation of High Speed Railway Tracks. Nanostructure Material, 9, 751-754. https://doi.org/10.1016/S0965-9773(97)00162-1
- 17. Zhang, H.W., Ohsaki, S., Mitao, S., Ohnumaa, M. and Hono, K. (2006) Microstructural Investigation of White Etching Layer on Pearlite Steel Rail. Materials Science and Engineering A, 421, 191-199. https://doi.org/10.1016/j.msea.2006.01.033
- 18. Pal, S., Daniel, W.J.T., Valente, C.H.G., Wilson, A. and Atrens, A. (2012) Surface Damage on New AS60 Rail Caused by Wheel Slip. Engineering Failure Analysis, 22, 152-165. https://doi.org/10.1016/j.engfailanal.2012.01.002
- 19. Ivanisenko, Yu., Lojkowski, W., Valiev, R.Z. and Fecht, H.-J. (2003) The Mechanism of Formation of Nanostructure and Dissolution of Cementite in a Pearlitic Steel during High Pressure Torsion. Acta Materialia, 51, 5555-5570. https://doi.org/10.1016/S1359-6454(03)00419-1
- 20. Fecht, H.J., Edlestein, A.S. and Cammarata, R.C. (1996) Nanomaterials: Synthesis, Properties and Applications. Institute of Physics Publishing, 89-92.
- 21. Valiev, R.Z., Ivanisenko, Yu.V., Rauch, E.E. and Baudelet, B. (1996) Structure and Deformaton Behaviour of Armco Iron Subjected to Severe Plastic Deformation. Acta Materialia, 44, 4705-4712. https://doi.org/10.1016/S1359-6454(96)00156-5
- 22. Humphreys, F.J. and Hatherly, M. (2004) Recrystallization and Related Annealing Phenomena. 2nd Edition, Elsevier, Oxford. https://doi.org/10.1016/B978-008044164-1/50016-5
- 23. Sakai, T. and Jonas, J.J. (2001) Plastic Deformation: Role of Recovery and Recrystallization. In: Buschow, K.H., Cahn, R.W., Flemings, M.C., Ilschner, B., Kramer, E.J. and Mahajan, S., Eds., Encyclopedia of Materials: Science and Technology, Vol. 7, Elsevier, Oxford, 7079-7084. https://doi.org/10.1016/B0-08-043152-6/01254-7
- 24. Valiev, R.Z., Islamgaliev, R.K. and Alexandrov, I.V. (2000) Bulk Nanostructured Materials from Severe Plastic Deformation. Progress in Materials Science, 45, 103-189. https://doi.org/10.1016/S0079-6425(99)00007-9
- 25. Sun, H.Q., Shi, Y.N., Zhang, M.X. and Lu, K. (2017) Plastic Strain-Induced Grain Refinement in the Nanometer Scale in a Mg Alloy. Acta Materialia, 55, 975-982. https://doi.org/10.1016/j.actamat.2006.09.018
- 26. Zhao, T.Z., Zhang, G.L., Song, H.W., Chen, M. and Zhang, S.H. (2014) Crystallographic Texture Difference between Center and Sub-Surface of Thin Cold-Drawn Pearlitic Steel Wires. Journal of Materials Engineering and Performance, 23, 3279-3284. https://doi.org/10.1007/s11665-014-1098-1
- 27. Guo, N., Luan, B.F., Wang, B.S. and Liu, Q. (2013) Microstructure and Texture Evolution in Fully Pearlitic Steel during Wire Drawing. Science China Technological Sciences, 56, 1139-1146. https://doi.org/10.1007/s11431-013-5184-7
- 28. Fang, F., Hu, X., Zhang, B., Xie, Z.H. and Jiang, J.Q. (2013) Deformation of Dual-Structure Medium Carbon Steel in Cold Drawing. Materials Science and Engineering: A, 583, 78-83. https://doi.org/10.1016/j.msea.2013.06.081
- 29. Kumar, P., Gurao, N.P., Haldar, A. and Suwas, S. (2011) Progressive Changes in the Microstructure and Texture in Pearlitic Steel during Wire Drawing. ISIJ International, 51, 679-684.