Forensic Medicine and Anatomy Research
Vol.03 No.01(2015), Article ID:52527,8 pages
10.4236/fmar.2015.31002
A Quantitative Assessment of the Morphology of the Piriform Aperture as an Indicator of Race
Seth Gardner
Department of Natural and Social Sciences, Bowling Green State University, Huron, USA
Email: gardnes@bgsu.edu
Copyright © 2015 by author and Scientific Research Publishing Inc.
This work is licensed under the Creative Commons Attribution International License (CC BY).
http://creativecommons.org/licenses/by/4.0/


Received 26 September 2014; revised 28 October 2014; accepted 20 November 2014
ABSTRACT
Piriform apertures from skulls in the Bass Collection at the University of Tennessee were examined. The morphology of the perform aperture from digital images was captured using Adobe Measuring Tool 9.0 and data analyzed with SPSS 17.0. Twenty-four linear measurements from a central point of the aperture as well as the perimeter were evaluated to quantify a difference between Black and White populations. The statistical analyses employed Discriminate Functional Analysis followed by Stepwise analysis. Discriminate functions were generated to predict to which group a skull belonged. A discriminate function produced an accuracy of 77.4%. Step-wise discriminate function analysis, using only three variables, produced an accuracy of 79.0%.
Keywords:
forensic science, forensic anthropology, Perform aperture, angular Morphometrics, anthropometrics, skull

1. Introduction
The assessment of race (ancestry) from human remains is an important aspect of forensic anthropology [1] . The primary objective of the forensic anthropologist is to develop a biological profile, which reports age, sex, stature, and race along with any anomalies that will make personal identification easier for the authorities [2] . The skull is considered to be the most useful part of the skeleton for the assessment of race [3] [4] . Successful approaches to race determination of unidentified human remains using the skull have been developed by anatomists and biological anthropologists, but few quantitative methods are available for distinguishing various specimens [5] . The most useful landmarks for racial classification are mid-facial, including the nose and mouth area [6] . In 1990, Gill and Gilbert created a metric method of distinguishing between American Blacks and Whites based upon six measurements of the mid-facial region. These researchers find that the measurements have a very high accuracy in determining the race of Black versus White skulls, averaging around 90%. The size and the shape of the nasal bones and the piriform aperture can be used to clarify the “anthropological characteristics of each race” [7] . The overall morphology of the piriform aperture seems to be an informative characteristic of the hominoid face [8] . However, quantitative data on the piriform aperture remain rare [8] . One area of investigation has focused specifically on differences between Africans and Europeans in the shape of the piriform aperture (also known as the anterior nasal aperture).
Anthropometrics have revealed that there are many skeletal differences between Africans and Europeans [9] . Because there are characteristic differences among races in the shape and size of the nose, it is likely that the nasal bones and the piriform aperture (anterior nasal opening) also have some differences, which can provide useful insights in the field of forensic anthropology [7] . Europeans tend to have a narrower triangular opening, while Africans tend to have a much wider and more rectangular opening. These differences have been noted for many years and have been used forensically in the nonmetric assessment of race from the skeleton [10] . While nonmetric methods have proven useful, they are also somewhat subjective. Anthropometric data are thought to be objective and they allow the forensic anthropologist to go beyond subjective assessments such as similar or different [11] . With measurement data, the examiner is able to quantify the degree of difference or similarity and state how much confidence can be placed in this interpretation [11] . Precise characterization of the piriform aperture shape in well-identified species has also been helpful in the proper interpretation and classification of extinct and fossil individuals [12] .
Some authors described the piriform aperture by using the anthropological nasal index, an anthropometric measure used to classify nasal aperture shape [8] . The nasal index is defined as the ratio of the maximum nasal aperture breadth to the maximum nasal aperture length (multiplied by 100). Maximum length is measured on the skull as the distance from the anterior nasal spine to the point where the internasal suture meets the frontal bone (nasion), while maximum breadth is measured as the widest distance between the left and right boundaries of the piriform aperture. By using this index, human skulls were classified into leptorrhinians (nasal index ranging from 42 to 47), mesorrhinians (48 to 52) and platyrrhinians (53 to 58) [13] .
The goal of this study was to quantitatively describe the morphology of the piriform aperture using angular anthropometrics and develop a method by which forensic anthropologists can use angular anthropometrics to assign ancestry to a skull, based on a sample of American Blacks and Whites.
2. Materials and Methods
The random sample studied included sixty-two (62) skulls of known race, sex and age from the William H. Bass Skeletal Collection in Knoxville, Tennessee. The skulls were required to be grossly normal, that is, without breakage or defect of the piriform aperture or defect of the bones that contribute to formation of the aperture. More White specimens were available (n = 36) than Black (n = 26) specimens. The skulls were placed in sand and aligned in the Frankfort Horizontal (FH). Skulls were then tilted and laser aligned to place the nasal aperture in a plane perpendicular to the line of sight of the camera. To do this, the skull was tilted such that a point located at the inferior edge of the inter-nasal suture lay in the same horizontal plane as two points located at the most inferior lateral margins of the nasal aperture aligned by laser level as seen in Figure 1. This was done in hopes of capturing a more complete view of the aperture. Skulls were then photographed using a 7.2 megapixel Sony Cyber-shot camera on a tripod from a distance of 20 inches (50.8 cm). Quantification of the morphology of the piriform aperture was done using Adobe Acrobat Measuring Tool 9.0 by measuring from the centroid of the aperture to the perimeter of the aperture every 15˚ for a total of twenty four measurements (in millimeters) (Figure 2 and Figure 3).
The centroid was determined by choosing the mid-point value (in mm) of a vertical line from the lowest point of the internasal suture to a horizontal line indicating the lowest point of the aperture. Measurements about the aperture are shown in Figure 3. The measurements from the digital images were uploaded into the computer and measurements were calculated after calibrating the measuring tool. The measurements were taken from unmarked digital images that did not identify race, sex or any other demographic data at the time of measurement. The data were evaluated using independent t-tests to investigate racial dimorphism as shown in Table 1. The data were further evaluated using multivariate statistical methods (discriminant function analysis and stepwise analysis). Discriminant function analysis was chosen as it involves the generation of an equation that will pre-

Figure 1. Skull placement for photograph. The red line con- nects the internasal suture (a) with the inferior lateral margin of the piriform aperture (b). The skull is positioned such that this line was parallel to the overhead sight line of the camera (white arrow).

Figure 2. Finding the centroid of the piriform aperture. The ho- rizontal blue line is drawn through the lowest point(s) on the in- ferior margin of the aperture. The blue line is drawn perpen- dicular to this horizontal from the inferior limit of the internasal suture (arrow). The centroid of aperture is the mid-point along this perpendicular.

Figure 3. Measurements taken from the centroid every 15 de- grees. Radial measurements (lines) were constructed from cen- troid to the perimeter, at 15 degree intervals beginning from the internasal suture. Note: lines on the photograph above were dra- wn free-hand and may not accurately reflect 15 degree intervals.

Table 1. Results from the independent t-tests. Of the twenty-five variables, eleven variables were statistically significant between Blacks and Whites with p-values ≤ 0.05 (bold values).
Legend all measurements in mm. (#.#) = Standard Deviation. *significant at p ≤ 0.05.
dict to which group the case belongs [14] . Step-wise discriminant analysis using Wilks’ Lambda for variable selection was used to indicate the variables which were most useful for determining race. The validity of the discriminant function equation generated was assessed by using the leave-one out classification procedure. The reliability and validity of the Adobe Acrobat Software Pro 9.0 Measuring Tool were tested against digital caliper (Mitutoyo Model #CD-8) measurements. Reliability and validity of Adobe Acrobat Measuring Tool 9.0 was evaluated by measuring the maximum length and breadth of the piriform aperture (nasal index) of each five specimens as shown in Table 2.
While these measurements were not directly germane to the study, they aided in validating the use of computer software as a viable alternative to caliper measurements. The angular measurements taken and analyzed by Adobe Acrobat 9.0 Measuring Tool would have been impractical and difficult to duplicate with calipers on a study of this nature; therefore, angular measurements were not tested against the calipers.
Manual caliper nasal height and breadth measurements from the actual skulls were compared to the computer-evaluated height and breadth data sets from photographs using intraclass correlation coefficients (ICC) with a 95% confidence interval indicating high validity. Intraexaminer and interexaminer reliability measurements were also carried out, and the data were evaluated using intraclass correlation coefficient with a 95% confidence interval indicating very high reliability [15] .
3. Results
The reliability and validity of the Adobe Acrobat Software Pro 9.0 Measuring Tool were tested against the digital caliper measurements. Reliability and validity were evaluated by measuring the maximum length and breadth of the piriform aperture (nasal index) Manual caliper nasal height and breadth measurements from the actual skulls were compared to the computer-evaluated height and breadth data sets from photographs using in traclass
Table 2. Comparison of computerized versus caliper measurements.
Legend all measurements in mm.
correlation coefficients (ICC) with a 95% confidence interval indicating high validity. Intraexaminer and interexaminer reliability measurements were also carried out, and the data were evaluated using intraclass correlation coefficient with a 95% confidence interval indicating very high reliability
The significant variables were 90˚, 105˚, 120˚, 135˚, 165˚, 180˚, 195˚, 240˚, 255˚, 270˚ and 360˚. Table 3 shows the discriminant function analysis, which yielded a structure matrix showing the correlation coefficients used in constructing the discriminant function.
A function was generated using the twenty-five standardized canonical discriminant function coefficients in Table 3.

This equation generates a value that can be compared to the Function at Group Centroids (i.e., the group means of the predictor variables) in Table 4.
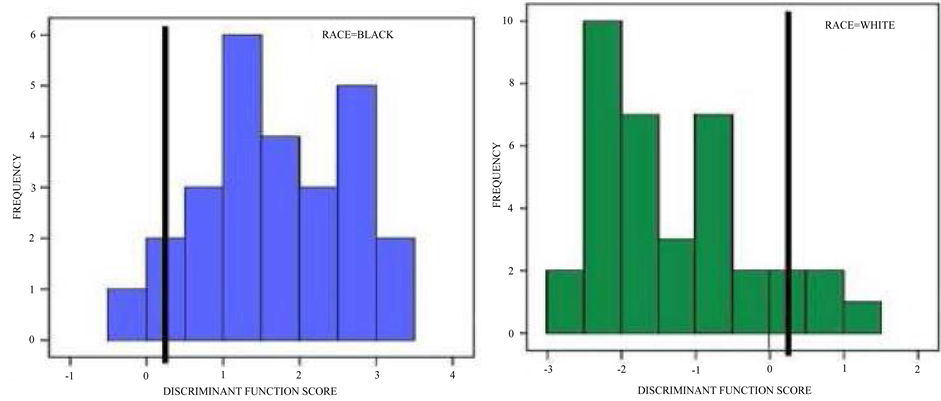
If a skull receives a score from the function closer to −1.245, it most likely came from a White population, and if a skull receives a score closer to 1.724 then it most likely came from a Black population. The dividing point or cut-score is the halfway point between the two scores. The cut-score is derived as follows:

Using the cut-score value, if a skull receives a score above 0.242, the skull most likely came from a Black population; if the score is below 0.242 the skull most likely came from a White population. These values can be interpreted using histograms in Figure 4.
The cross-validated classification in Table 5 showed that overall, 77.4% of the specimens were classified correctly. The White specimens were classified with slightly better accuracy (80.6%) than the Black specimens (73.1%) possibly due to having more White specimens than Black to base the discriminant function on.
Step-wise analysis provides a more streamlined model which arrived at the best classification of an unknown specimen while using the least number of variables.
Only three variables from data were needed to generate a useful function, those measurements taken at 75˚, 105˚ and 195˚ as seen in Table 6.
Using the Standardized Canonical Discriminant Function Coefficients for these three variables (Table 6), a new discriminant function can be generated, as follows:

Table 3. Standardized canonical discriminant function coefficients.
Table 4. Mean scores of each variable by race from DF 1.
Table 5. Classification based on the discriminant function generated.
a90.3% of original grouped cases correctly classification; b77.4% of cross-validated grouped cases correctly classified; cCross validation is done only for those cases in the analysis. In cross validation, each case is classified by the functions derived from all cases other than that case.
The values obtained from this equation are compared to the values in Table 7.
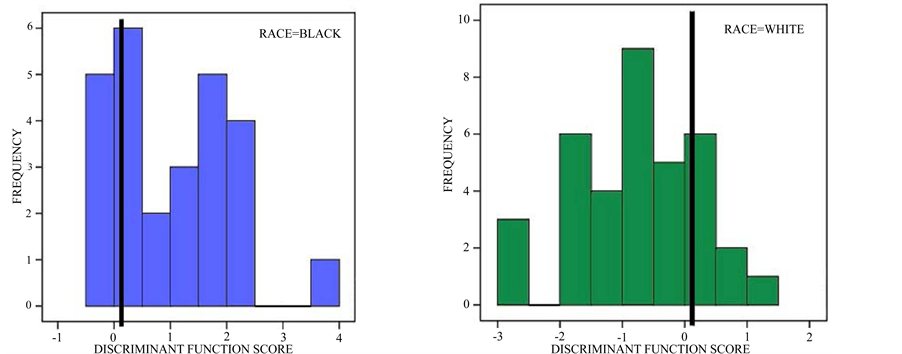
If a skull receives a score closer to −0.747 it is most likely from the White population, while a score closer to 1.034 is most likely belonging to a skull from the Black population. Again, a cut-score is generated:

Table 6. Structure matrix table from step-wise analysis ranked by weight.
Table 7. Mean scores of each variable by race from DF 1 using Step-wise analysis.
 (a) (b)
Figure 4. Histograms showing scores from DF 1 (using all 25 variables) black lines on each histogram indicate cut score of 0.242. (a) Plot of discriminant function scores for Black skulls; (b) Plot of discriminant function scores for White skulls.
If a skull receives a score above 0.143 it most likely belongs to the Black population, a skull receiving a score below 0.143 most likely to belong to the White population.
These values can be interpreted using the histograms in Figure 5.
Table 5 and Table 7 show the classification results or “hit ratio” of each of the functions generated by each analysis. The hit ratio is the overall predictive accuracy of the Model. The hit ratio of the initial Function (based on the original twenty-five variables) had an accuracy of 77.4% while the hit ratio of the Step-wise function (based on the three variables) was 79.0%. The hit ratio or cross-validated accuracy rates generated by SPSS were greater than a minimal acceptable accuracy rate of 64.1%. The minimal acceptable accuracy rate is defined as a 25% increase over the by-chance accuracy rate.
4. Discussion
Nasal proportions do vary between ethnic groups but the size and shape of the nose do not define Caucasian, Asian and African races. Nasal index is very useful in anthropology in distinguishing racial and ethnic differences [12] . It also exhibits sexual differences [16] and it has become a useful tool in Forensic Science [17] . The quantitative data for the piriform aperture that exist are mainly restricted to conventional linear caliper measurements used to determine the nasal index. Facial anthropometry has become an important tool used in genetic counseling, reconstructive surgery and forensic investigation [18] [19] .
This study focused on a new method to assess race (ancestry) of a skull. It is traditional in the sense that the mid-facial region was evaluated and new in that the piriform aperture morphology was quantified more fully
 (a) (b)
Figure 5. Histograms showing scores from Step-wise analysis of function 1 Black lines on each histogram indicate cutscore of 0.143. (a) Plot of discriminant function scores for Black skulls; (b) Plot of discriminant function scores for White skulls.
than in the past. Metrics were used to quantify the difference in shape of the aperture in skulls of known race specifically using Adobe Acrobat Pro 9.0 Measuring Tool. The data show that the distances at eleven angles about the aperture differed between the two races. These were the measurements at 90˚, 105˚, 120˚, 135˚, 165˚, 180˚, 195˚, 240˚, 255˚, 270˚ and 360˚.
The angles and distances from the centroid that reflect the different morphology between the two samples can be useful racial indicators. Discriminant function analysis generated a somewhat useful function using the twenty-five variables; however, it may be unwieldy to measure all twenty-five variables in actual practice.
Step-wise analysis provided a much more useful and practical application of the data. It generated a function using only three of the variables (75˚, 105˚ and 195˚).
This equation is much more efficient to use. In comparing these angles between races, it is evident that there is a difference between the two races, especially between the 195˚ and 105˚ measurements. By combining the measurement of the most significant variable in the DF (i.e., 105˚ as shown in Table 6) with a non-metric racial assessment of the skull, one could be reasonably confident in the determination of that specimen’s race.
The results of this study are encouraging by offering an opportunity to determine the race of an unknown skull specimen by using angular morphometrics and using Adobe Acrobat Measuring Tool to quantify a shape. Various limitations of the study can be identified.
The results of this investigation require careful interpretation and further study. Sample size, sample quality and digital imagery (pixel number) all will affect the outcome. The sample size was very small which may have provided for statistical significance. The investigator hoped to capture the complete aperture, but the nasal aperture, being a three dimensional shape, cannot be completely visualized in two dimensions. A 3-D tomogram would allow for total capture of the area under investigation. Age of the specimens should be accounted for in future studies of this nature, as it may influence the bony makeup of the aperture. This author has no knowledge of any previous study using the Adobe Acrobat Pro 9.0 Measuring Tool to evaluate any biological shape; therefore, differences in the measurement results in the present investigation should be compared with other studies with caution. The specimens available for use in this study numbered only sixty-two. The investigator had access to only six Black female specimens. The Bass collection has been meticulous in its recording of demographic data; however, the designation “Black” or “White” may not have reflected the true ancestry of the individual. These classifications were taken as accurate for use in this study. It also requires some time to become proficient in accurately identifying the exact point to measure. The accuracy of the measurement is affected by the number of pixels of the digital image and the resolution of the computer monitor. Eye strain of the investigator could also be a significant factor in maintaining precision and accuracy of the measurements. The quantification of the piriform aperture in this study using Adobe Acrobat Measuring Tool 9.0 begs for future research in the area of angular morphometrics on quantifying skeletal landmarks for either race or sex assignment.
5. Conflict of Interest
The author declares that there is no conflict of interests regarding the publication of this article.
6. Ethics Statement
This investigation was conducted in a facility constructed with support from Research Facilities Improvement Program Grant Number C06 RR15433-01 from the National Center for Research Resources, National Institute of Health.
Acknowledgements
The author would like to thank the Department of Anthropology at the University of Tennessee in Knoxville, TN the use of the William M. Bass Collection. This research was funded by Palmer College of Chiropractic.
References
- Moraitis, K., Eliopoulos, C., Spiliopoulou, C. and Manolis, S. (2009) Assessment of Ancestral Background from the Skull: Case Studies from Greece. The Internet Journal of Biological Anthropology, 3, 2.
- Bass, W. (1995) Human Osteology: A Laboratory and Field Manual. 4th Edition, Missouri Archaeological Society, Columbia.
- Howells, W. (1970) Multivariate Analysis for the Identification of Race from the Crania. In: Stewart, T.D., Ed., Personal Identification in Mass Disasters, District of Columbia National Museum of Natural History, 11-121.
- Rhine, S. (1993) Skeletal Criteria for Racial Attribution. National Association for the Practice of Anthropology Bulletin, 13, 54-67. http://dx.doi.org/10.1525/napa.1993.13.1.54
- Gill, G. (1986) Craniofacial Criteria in Forensic Race Identification. In: Thomas, C.C., Ed., Forensic Osteology, Springfield, 145-159.
- Reichs, K. (1998) Forensic Osteology. Chas. Thomas Publishers, Springfield.
- Hwang, T., Song, J., Yoon, H., Cho, B.P. and Kang, H.S. (2005) Morphometrics of the Nasal Bones and Piriform Apertures in Koreans. Annals of Anatomy―Anatomischer Anzeiger, 187, 411-414. http://dx.doi.org/10.1016/j.aanat.2005.04.009
- Schmittbuhl, M., Le Minor, J.M., Allenbach, B. and Schaaf, A. (1998) Shape of the Piriform Aperture in Gorilla gorilla, Pan troglodytes, and Modern Homo sapiens: Characterization and Polymorphism Analysis. American Journal of Physical Anthropology, 106, 297-310. http://dx.doi.org/10.1002/(SICI)1096-8644(199807)106:3<297::AID-AJPA3>3.0.CO;2-K
- Robinson, A. (1931) Cunningham’s Textbook of Anatomy. Oxford University Press, New York.
- Bass, W. (2005) Human Osteology. Academic Press, San Diego.
- Adams, B.J. and Byrd, J.E. (2002) Inter-Observer Variation of Selected Postcranial Skeletal Remains. Journal of Forensic Science, 47, 1193-1202.
- Holton, N. and Franciscus, R.G. (2008) The Paradox of a Wide-Nasal Aperture in Cold Adapted Neanderthals: A Causal Assessment. Journal of Human Evolution, 55, 942-951. http://dx.doi.org/10.1016/j.jhevol.2008.07.001
- Topinard, P. and Broca, P. (1890) Anthropology. Chapman and Hall, London.
- Green, S.B. and Salkind, N.J. (2007) Using SPSS for Windows and Macintosh: Analyzing and Understanding Data. 5th Edition, Prentice Hall, Upper Saddle River.
- Bland, J.M. and Altman, D.G. (1990) A Note on the Use of the Intraclass Correlation Coefficient in the Evaluation of Agreement between Two Methods of Measurements. Computer Medicine Journal, 20, 337-340. http://dx.doi.org/10.1016/0010-4825(90)90013-F
- Zhang, X.T., Wang, S.K., Zhang, W. and Wang, X.F. (1990) Measurement and Study of the Nose and Face and Their Correlations in the Young Adult of Han Nationality. Plastic and Reconstructive Surgery, 85, 532-536. http://dx.doi.org/10.1097/00006534-199004000-00007
- Xu, B., Wang, Y., Ma, J., Li, M. and Xu, L. (2011) A Computer-Aid Study on the Craniofacial Features of Archang Race in Yunnan Province of China. West China Journal of Stomatology, 19, 394-396.
- Oladipo, G.S., Olabiyi, A.O., Oremosu, A.A. and Noronha, C.C. (2007) Nasal Indices among Major Ethnic Groups in Southern Nigeria. Scientific Research and Essay, 2, 20-22.
- Krishan, K. (2008) Estimation of Stature from Cephalo-Facial Anthropometry in North Indian Population. Forensic Science International, 181, 52e1-52e6.