Computational Molecular Bioscience
Vol.06 No.02(2016), Article ID:67895,8 pages
10.4236/cmb.2016.62003
Use of FFT in Protein Sequence Comparison under Their Binary Representations
Jayanta Pal1, Soumen Ghosh2, Bansibadan Maji3, Dilip Kumar Bhattacharya4
1Department of Computer Science & Engineering, Narula Institute of Technology, Kolkata, India
2Department of Information Technology, Narula Institute of Technology, Kolkata, India
3Department of Electronics & Communication Engineering, National Institute of Technology, Durgapur, India
4Department of Pure Mathematics, Calcutta University, Kolkata, India

Copyright © 2016 by authors and Scientific Research Publishing Inc.
This work is licensed under the Creative Commons Attribution International License (CC BY).
http://creativecommons.org/licenses/by/4.0/


Received 14 February 2016; accepted 27 June 2016; published 30 June 2016
ABSTRACT
The paper considers Voss type representation of amino acids and uses FFT on the represented binary sequences to get the spectrum in the frequency domain. Based on the analysis of this spectrum by using the method of inter coefficient difference (ICD), it compares protein sequences of ND5 and ND6 category. Results obtained agree with the standard ones. The purpose of the paper is to extend the ICD method of comparison of DNA sequences to comparison of protein sequences. The topic of discussion is to develop a novel method of comparing protein sequences. The main achievements of the work are that the method applied is completely new of its kind, so far as protein sequence comparison is concerned and moreover the results of comparison agree with the previous results obtained by other methods for the same category of protein sequences.
Keywords:
Voss Type Representation, Inter-Coefficient Difference (ICD) Method, Distance Matrix, Phylogenetic Tree, Fast Fourier Transform (FFT), ND5 and ND6 Category of Protein

1. Introduction
Among the numerous available amino acids only 20 are generally found in living beings and every protein sequence is expressed by these 20 amino acids. The representation of protein in terms of its amino acids is called its primary sequence. Based on this primary sequence representation, protein sequence comparison involves basically two types of methods: 1) Alignment Based Method and 2) Alignment Free Method. Protein sequence comparison was primarily done by different alignment based methods [1] - [3] . But especially due to execution time and comparatively difficult procedure, alignment free methods were preferred subsequently. So far as alignment free methods are concerned, a good literature up to 2003 is available in [4] . So we start with highlighting some of the most important contribution in protein sequence comparisons by alignment free methods from 2003 onwards [5] - [25] . Obviously in most cases, protein sequence comparison also follows similar approach as is considered in genome sequence analysis, because the role of four nucleotides is the same as the role of 20 amino acids in a protein sequence. In details, first of all, numerical representations of the protein sequences are obtained from the numerical values given to the individual amino acids, then graphical representation of the protein sequences is obtained; from these graphs descriptors are derived. These are finally used in comparing protein sequences. All the papers from [7] - [24] involve graphical representations. But another completely different approach is also followed in protein sequence comparison. These are based on classification of amino acids in different groups with different cardinality [8] [26] [27] . Again application of Discrete Fourier Transform in Bioinformatics is also well known. Discrete Fourier Transform (DFT) is nicely used in signal and image processing [28] - [34] . The main areas of its application in DNA research are found in gene prediction, hierarchical analysis and such others [35] - [40] . It is effectively used in identification of protein coding regions, because a DFT spectrum of a DNA sequence reflects the distribution and periodic pattern of the sequence [41] . Use of DFT on binary sequence is found in [42] , where the binary sequence is generated from genome sequences by Voss type of representation. Naturally to find similar use of DFT in protein sequence analysis, corresponding Voss type representation of amino acids is to be known priori. Fortunately Voss representation of DNA sequences involving 4 nucleotides has already been generalized to Voss type representation of 20 amino acids in protein sequences [43] . Such representation of amino acids has already been used in obtaining fuzzy representation of amino acids [43] . These are found to be effective in classification of amino acids in 6 different groups. Finally protein sequence classification has been obtained based on such classified groups of amino acids [8] [25] - [27] [44] . Thus Voss type representation of amino acids is an important contribution in protein sequence analysis. But use of FFT on the binary representations of protein sequences generated by such Voss type representation of amino acids has not yet been attempted in protein sequence comparison. This is the motivation of the paper to consider such binary sequences in comparing protein sequences.
2. Methodology
2.1. Voss Type Binary Representation of Amino Acid
20 amino acids are taken in the following order:
Alanine (A), Cysteine (C), Aspartic acid (D), Glutamic acid (E), Phenylalanine (F), Glycine (G), Histidine (H), Isoleucine (I), Lysine (K), Leucine (L), Methionine (M), Asparagine (N), Proline (P), Glutamine (Q), Arginine (R), Serine (S), Tyrosine (T), Valine (V), Tryptophan (W) and Threonine (Y).
Each amino acid is represented by a 20 component vector of which one bit is 1 and others are 0. But the representation follows the order of amino acid taken. For example amino acid Alanine(a) is represented by 10000000000000000000. The same rule is applied for other amino acids also, so that the last amino acid Threonine (Y) is represented by 00000000000000000001.
From each protein sequence S we get 20 different representations corresponding to 20 different amino acids by putting in the protein sequence 1 for the particular amino acid considered and the rest all 0 for the remaining amino acids. Thus 20 different binary representations viz., UA, UC, UD, UE, UF, UG, UH, UI, UK, UL, UM, UN, UP, UQ, UR, US, UT, UV, UW and UY are obtained.
2.2. ICD Method for Protein Sequence Analysis
The ICD method of DNA sequence and Protein sequence analysis basically remains the same as both deals with binary sequence only. So we describe ICD method as described in [43] . First of all FFT is applied on the binary represented protein sequences of length N say. In the Fourier spectrum the amplitudes are taken, which are N/2 distinct numbers. We normalize these N/2 components by their lengths. On these N/2 normalized components, we take absolute value of the inter coefficient difference (ICD) by calculating the differences of the succeeding terms from the preceding ones. Thus we get (N/2 − 1) distinct elements corresponding to each amino acid. Now 20 such (N/2) − 1 distinct components are concatenated to give a descriptor of length 20*((N/2) − 1)). From such descriptors distance matrix is formed by considering Euclidian Distance measures as follows.
If  and
and  are two sequences for two proteins X and Y, then the distance between X and Y is given by

This is the Euclidean distance between X and Y. The smaller is the distance; more similar are the protein sequences. On the basis of this formula the distances between pair of proteins are calculated and they are used to form the diagonal matrix. Due to similarity, only the lower half of the matrix is taken. Now using the UPGMA software on this matrix the Phylogenetic Tree for all the species is obtained. For comparison of protein sequences of different lengths the question of making all the lengths same does not arise normally in FFT. But if necessary, the length may be manually adjusted by putting additional zeros. For example, suppose two protein sequences are of lengths M and N. Then the descriptors for the first and second sequences are of lengths 20*((N/2) − 1) and 20*((M/2) − 1) respectively. As the descriptors are of unequal lengths, so comparison becomes infeasible. Hence if M = N − 2, say, then we first make the lengths of both the sequences equal to N, by putting two additional zeros to the second sequence. But there is no problem in doing so, as the Fourier transform of zeros gives zero spectrum.
3. Sequences for Comparison
We have used the NADH dehydrogenase subunit 5 (ND5) and subunit 6 (ND6) protein sequences of nine species for comparison as shown in Table 1.
4. Results and Discussions
4.1. Results
Distance matrix obtained by applying our method for 9 protein sequences of ND5 and ND6 category have been presented in Table 2 and Table 3 respectively. Phylogenetic tree obtained from these data have been presented in Figure 1 and Figure 2 for ND5 and ND6 category respectively.
4.2. Discussion
ICD method, which is dependent on Voss type representation of DNA sequences, is already known to be very much successful in comparing DNA sequences. Voss type representation for protein sequences is comparatively a newer concept. As Voss type representation for protein sequences has been applied recently in different areas and found to be very much successful there, so it is expected that this type of representation might be useful in protein sequence comparison also. This is why; in our paper ICD method based on Voss type representation for protein sequences has been developed and used for protein sequence comparison. No doubt that the present method is a new contribution to the literature of protein sequence comparison.

Table 1. List of nine species with their versions and lengths.
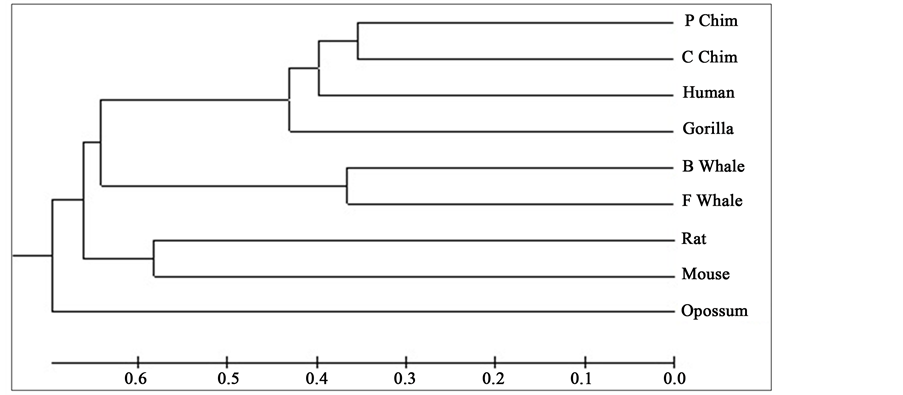
Figure 1. Phylogenetic tree obtained for 9 protein sequences of ND5 category.

Figure 2. Phylogenetic tree obtained for 9 protein sequences of ND6 category.
Table 2. Distance matrix (lower triangular) for 9 protein sequences of ND5 category.
Obviously ICD method, may be for DNA sequence comparison or Protein sequence comparison, is comparatively easier and straight forward to apply.
To compare our results with those obtained earlier by other methods on the same species, we first mention them as far as possible. The phylogenetic tree obtained in [25] for 9 species of ND5 category is given in Figure 3. Similarly the phylogenetic trees obtained in [26] for 9 species of ND5 category and ND6 category are given in Figure 4 and Figure 5 respectively and the phylogenetic trees obtained in [44] for 9 species of ND5 category and ND6 category are given in Figure 6 and Figure 7 respectively.
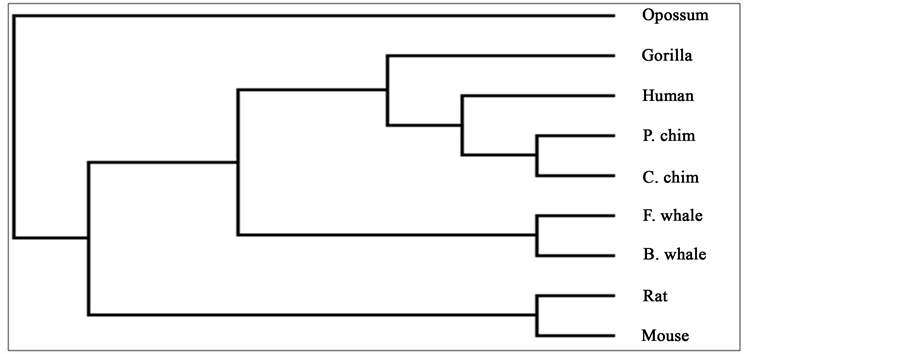
Figure 3. Phylogenetic tree obtained in [25] for 9 species of ND5 category.
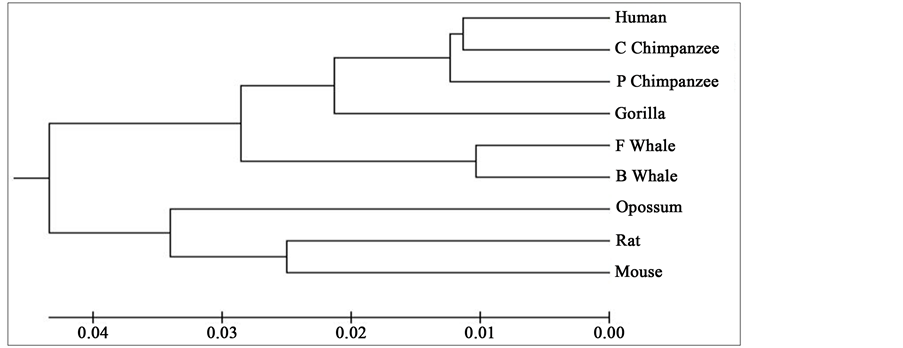
Figure 4. Phylogenetic tree obtained in [26] for 9 species of ND5 category.
Table 3. Distance matrix (lower triangular) for 9 protein sequences of ND6 category.
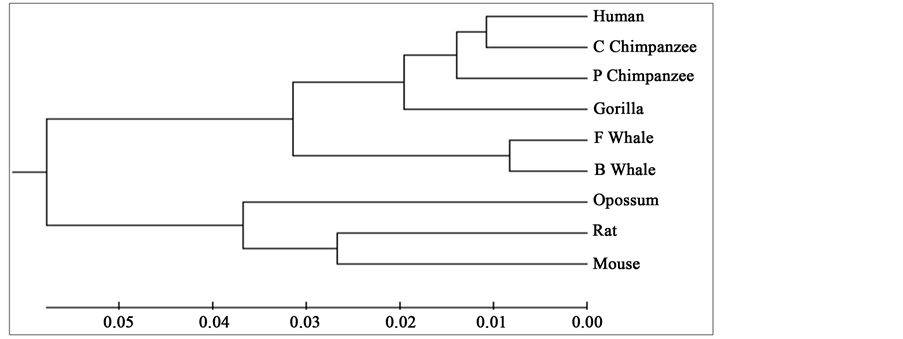
Figure 5. Phylogenetic tree obtained in [26] for 9 species of ND6 category.
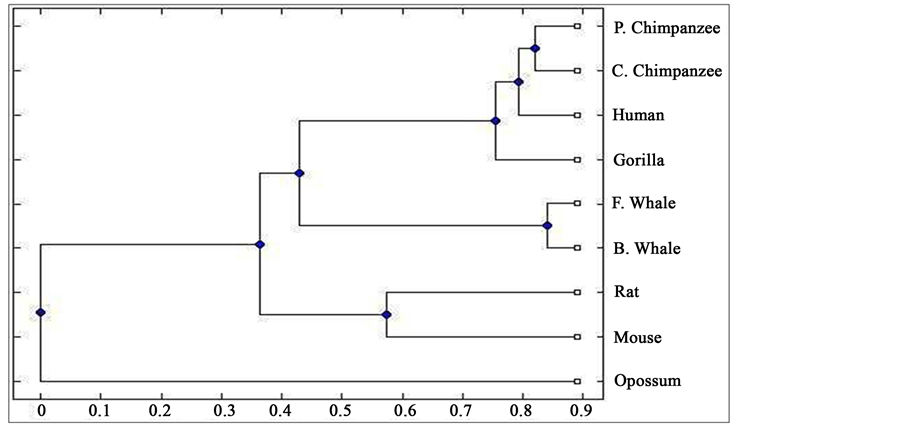
Figure 6. Phylogenetic tree obtained in [44] for 9 species of ND5 category.
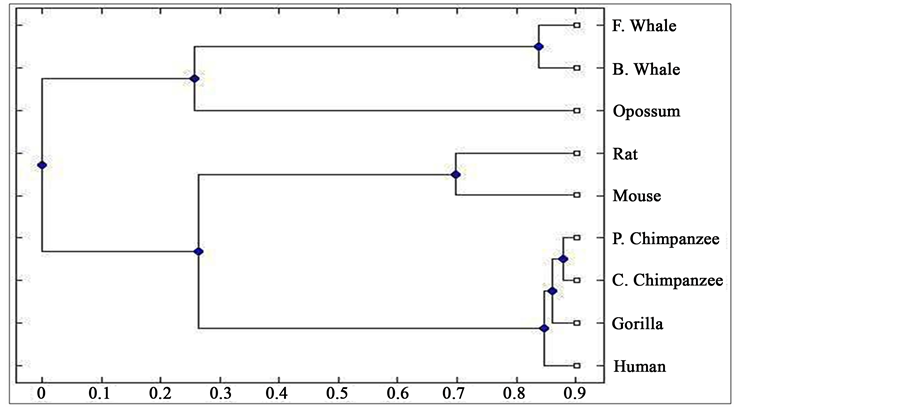
Figure 7. Phylogenetic tree obtained in [44] for 9 species of ND6 category.
From the above phylogenetic trees obtained for ND5 and ND6 categories of protein, it is revealed that in both the cases the phylogenetic trees obtained by our method almost agree with the earlier phylogenetic trees obtained by other methods.
5. Conclusion
Our method is effective and easier to apply in protein sequence comparison.
Cite this paper
Jayanta Pal,Soumen Ghosh,Bansibadan Maji,Dilip Kumar Bhattacharya, (2016) Use of FFT in Protein Sequence Comparison under Their Binary Representations. Computational Molecular Bioscience,06,33-40. doi: 10.4236/cmb.2016.62003
References
- 1. Phillips, A., Janies, D. and Wheeler, W. (2000) Multiple Sequence Alignment in Phylogenetic Analysis. Molecular Phylogenetics and Evolution, 16, 317-330.
http://dx.doi.org/10.1006/mpev.2000.0785 - 2. Thompson, J.D., Higgins, D.G. and Gibson, T.J. (1994) CLUSTAL W: Improving the Sensitivity of Progressive Multiple Sequence Alignment through Sequence Weighting, Position-Specific Gap Penalties and Weight Matrix Choice. Nucleic Acids Research, 22, 4673-4680.
http://dx.doi.org/10.1093/nar/22.22.4673 - 3. Katoh, K., Misawa, K., Kuma, K. and Miyata, T. (2002) MAFFT: A Novel Method for Rapid Multiple Sequence Alignment Based on Fast Fourier Transform. Nucleic Acids Research, 30, 3059-3066.
http://dx.doi.org/10.1093/nar/gkf436 - 4. Vinga, S. and Almeida, J. (2003) Alignment-Free Sequence Comparison—A Review. Bioinformatics, 19, 513-523.
http://dx.doi.org/10.1093/bioinformatics/btg005 - 5. Pinello, L., Lo Bosco, G. and Yuan, G.-C. (2013) Applications of Alignment-Free Methods in Epigenomics. Briefings in Bioinformatics, 15, 419-430.
http://dx.doi.org/10.1093/bib/bbt078 - 6. Domazet-Loso, M. and Haubold, B. (2011) Alignment-Free Detection of Local Similarity among Viral and Bacterial Genomes. Bioinformatics, 27, 1466-1472.
http://dx.doi.org/10.1093/bioinformatics/btr176 - 7. Ghosh, S., Pal, J., Maji, B. and Bhattacharya, D.K. (2016) Condensed Matrix Descriptor for Proteinb Sequence Comparison. International Journal of Analytical Mass Spectrometry and Chromatography, 4, 1-13.
http://dx.doi.org/10.4236/ijamsc.2016.41001 - 8. Li, C., Xing, L.L. and Wang, X. (2008) 2-D Graphical Representation of Protein Sequences and Its Application to Coronavirus Phylogeny. BMB Reports, 41, 217-222.
http://dx.doi.org/10.5483/BMBRep.2008.41.3.217 - 9. Randic, M., Mehulic, K., Vukicevic, D., Pisanski, T., Vikic-Topic, D. and Plavsic, D. (2009) Graphical Representation of Proteins as Four-Color Maps and Their Numerical Characterization. Journal of Molecular Graphics and Modelling, 27, 637-641.
http://dx.doi.org/10.1016/j.jmgm.2008.10.004 - 10. Bai, F. and Wang, T. (2006) On Graphical and Numerical Representation of Protein Sequences. Journal of Biomolecular Structure and Dynamics, 23, 537-545.
http://dx.doi.org/10.1080/07391102.2006.10507078 - 11. Randic, M. (2007) 2-D Graphical Representation of Proteins Based on Physico-Chemical Properties of Amino Acids. Chemical Physics Letters, 440, 291-295.
http://dx.doi.org/10.1016/j.cplett.2007.04.037 - 12. Ghosh, A. and Nandy, A. (2011) Graphical Representation and Mathematical Characterization of Protein Sequences and Applications to Viral Proteins. Advances in Protein Chemistry and Structural Biology, 83, 1-42.
http://dx.doi.org/10.1016/B978-0-12-381262-9.00001-X - 13. Randic, M., Zupan, J. and Vikic-Topic, D. (2007) On Representation of Proteins by Star-Like Graphs. Journal of Molecular Graphics and Modelling, 26, 290-305.
http://dx.doi.org/10.1016/j.jmgm.2006.12.006 - 14. Wen, J. and Zhang, Y. (2009) A 2D Graphical Representation of Protein Sequence and Its Numerical Characterization. Chemical Physics Letters, 476, 281-286.
http://dx.doi.org/10.1016/j.cplett.2009.06.017 - 15. Liao, B., Sun, X. and Zeng, Q. (2010) A Novel Method for Similarity Analysis and Protein Sub-Cellular Localization Prediction. Bio-Informatics, 26, 2678-2683.
http://dx.doi.org/10.1093/bioinformatics/btq521 - 16. Novic, M. and Randic, M. (2008) Representation of Proteins as Walks in 20-D Space. SAR and QSAR in Environmental Research, 19, 317-337.
http://dx.doi.org/10.1080/10629360802085066 - 17. Yu, H.-J. and Huang, D.-S. (2012) Novel 20-D Descriptors of Protein Sequences and Its Applications in Similarity Analysis. Chemical Physics Letters, 531, 261-266.
http://dx.doi.org/10.1016/j.cplett.2012.02.030 - 18. He, P.-A., Wei, J., Yao, Y. and Tie, Z. (2012) A Novel Graphical Representation of Proteins and Its Application. Physica A: Statistical Mechanics and Its Applications, 391, 93-99.
- 19. Randic, M., Novic, M. and Vracko, M. (2008) On Novel Representation of Proteins Based on Amino Acid Adjacency Matrix. SAR and QSAR in Environmental Research, 19, 339-349.
http://dx.doi.org/10.1080/10629360802085082 - 20. Abo-Elkhier, M.M. (2012) Similarity/Dissimilarity Analysis of Protein Sequences Using the Spatial Median as a Descriptor. Journal of Biophysical Chemistry, 3, 142-148.
http://dx.doi.org/10.4236/jbpc.2012.32016 - 21. Randic, M., Zupan, J. and Balaban, A.T. (2004) Unique Graphical Representation of Protein Sequences Based on Nucleotide Triplet Codons. Chemical Physics Letters, 397, 247-252.
http://dx.doi.org/10.1016/j.cplett.2004.08.118 - 22. El-Lakkani, A. and El-Sherif, S. (2013) Similarity Analysis of Protein Sequences Based on 2D and 3D Amino Acid Adjacency Matrices. Chemical Physics Letters, 590, 192-195.
http://dx.doi.org/10.1016/j.cplett.2013.10.032 - 23. Feng, Z.-P. and Zhang, C.-T. (2002) A Graphic Representation of Protein Sequence and Predicting the Sub-Cellular Locations of Prokaryotic Proteins. International Journal of Biochemistry and Cell Biology, 34, 298-307.
http://dx.doi.org/10.1016/S1357-2725(01)00121-2 - 24. Yao, Y.H., Kong, F., Dai, Q. and He, P.-A. (2013) A Sequence-Segmented Method Applied to the Similarity Analysis of Long Protein Sequence. MATCH: Communications in Mathematical and in Computer Chemistry, 70, 431-450.
- 25. He, P.-A., Li, X.-F., Yang, J.-L. and Wang, J. (2011) A Novel Descriptor for Protein Similarity Analysis. MATCH: Communications in Mathematical and in Computer Chemistry, 65, 445-458.
- 26. Ghosh, S., Pal, J., Das, S. and Bhattacharya, D.K. (2015) Differentiation of Protein Sequence Comparison Based on Biological and Theoretical Classifications of Amino Acids in Six Groups. International Journal of Computer Science and Software Engineering, 5, 695-698.
- 27. Zhang, Y.S. and Yu, X.T. (2010) Analysis of Protein Sequence Similarity. IEEE, 1255-1258.
- 28. Wu, Y.-L., Agrawal, D. and El Abbadi, A. (2000) A Comparison of DFT and DWT Based Similarity Search in Time-Series Databases. Proceedings of the 9th International Conference on Information and Knowledge Management, McLean, 6-11 November 2000, 488-495.
- 29. Anastassiou, D. (2000) Frequency-Domain Analysis of Bimolecular Sequences. Bioinformatics, 16, 1073-1081.
- 30. Vaidyanathan, P. and Yoon, B.-J. (2004) The Role of Signal Processing Concepts in Genomics and Proteomics. Journal of the Franklin Institute, 341, 111-135.
http://dx.doi.org/10.1016/j.jfranklin.2003.12.001 - 31. Brigham, E.O. and Morrow, R.E. (1967) The Fast Fourier Transform. IEEE Spectrum, 4, 63-70.
http://dx.doi.org/10.1109/MSPEC.1967.5217220 - 32. Lyons, R.G. (2004) Understanding Digital Signal Processing. Pearson Education, Upper Saddle River.
- 33. Oppenheim, A.V. and Schafer, R.W. (2010) Discrete-Time Signal Processing. 3rd Edition, Prentice Hall, Upper Saddle River.
- 34. Akhtar, M., Epps, J. and Ambikairajah, E. (2008) Signal Processing in Sequence Analysis: Advances in Eukaryotic Gene Prediction. IEEE Journal of Selected Topics in Signal Processing, 2, 310-321.
http://dx.doi.org/10.1109/JSTSP.2008.923854 - 35. Yin, C.C. and Yau, S.S.-T. (2007) Prediction of Protein Coding Regions by the 3-Base Periodicity Analysis of a DNA Sequence. Journal of Theoretical Biology, 247, 687-894.
http://dx.doi.org/10.1016/j.jtbi.2007.03.038 - 36. Tiwari, S., Ramchandran, S., Bhattacharya, A., Bhattacharya, S. and Ramaswami, R. (1997) Prediction of Probable Genes by Fourier Analysis of Genome Sequences. Computer Applications in the Biosciences, 13, 263-270.
- 37. Afreixo, V., Bastos, C.A., Garcia, S.P. and Ferrieira, P.J. (2009) Genome Analysis with Inter-Nucleotide Distances. Bioinformatics, 25, 3064-3070.
- 38. Abu-Zahhad, M., Ahmed, S.M. and Abd-Elrahman, S.A. (2012) Genomic Analysis and Classification of Exon and Intron Sequences Using DNA Nu-merical Mapping Techniques. International Journal of Information Technology and Computer Science (IJITCS), 8, 22-36.
- 39. Sitansu, S.S. and Panda, G. (2010) A DSP Approach for Protein Coding Region Identification in DNA Sequence. International Journal of Signal and Image Processing, 1, 75-79.
- 40. Saberkari, H., Shamsi, M., Sedaaghi, M. and Golabi, F. (2012) Prediction of Protein Coding Regions in DNA Sequences Using Signal Processing Methods. IEEE Symposium on Industrial Electronics and Applications (ISIEA), Bandung, 23-26 September 2012, 355-360.
- 41. Hoang, T., Yin, C.C., Zheng, H., Yu, C.L. and He, R.L. (2015) A New Method to Cluster DNA Sequences Using Fourier Power Spectrum. Journal of Theoretical Biology, 372, 135-145.
http://dx.doi.org/10.1016/j.jtbi.2015.02.026 - 42. King, B.R., Aburdene, M., Thompson, A. and Warres, Z. (2014) Application of Discrete Fourier Inter-Coefficient Difference for Assessing Genetic Sequence Similarity. EURASIP Journal on Bioinformatics and Systems Biology, 2014, 8.
- 43. Ghosh, S., Pal, J. and Bhattacharya, D.K. (2014) Classi-fication of Amino Acids of a Protein on the Basis of Fuzzy Set Theory. International Journal of Modern Sciences and Engineering Technology, 1, 30-35.
- 44. Jafarzadeh, N. and Iranmanesh, A. (2015) A New Measure for Pairwise Comparison of Protein Sequences. MATCH: Communications in Mathematical and in Computer Chemistry, 74, 563-574.