Modeling and Numerical Simulation of Material Science
Vol.3 No.2(2013), Article ID:30797,9 pages DOI:10.4236/mnsms.2013.32008
Numerical Study to Represent Non-Isothermal Melt-Crystallization Kinetics at Laser-Powder Cladding
1Institute on Laser and Information Technology Russian Academy of Sciences, Moscow, Russia
2CSIR-National Laser Centre, Pretoria, South Africa
Email: top20072007@rambler.ru
Copyright © 2013 V. G. Niziev et al. This is an open access article distributed under the Creative Commons Attribution License, which permits unrestricted use, distribution, and reproduction in any medium, provided the original work is properly cited.
Received November 14, 2012; revised December 15, 2012; accepted December 24, 2012
Keywords: Laser Cladding; Numerical Modeling; Kinetics of Phase Change
ABSTRACT
The study of laser-powder cladding process subject to heat transfer, melting and crystallization kinetics has been carried out numerically and experimentally. The Kolmogorov-Avrami equation was applied to describe the kinetics of the phase transitions. Characteristic behavior of temperature and conversion fields has been analyzed. Melt pool dimensions, clad height dependences on mass feed rate, laser power and scanning velocity have been investigated. It has been demonstrated that the melt zone has the boundary distinct from the melting isotherm due to the fact that melting occurs with superheating and crystallization takes place at undercooling. The calculated melt pool depth and clad height are in a good agreement with the experimental results.
1. Introduction
Laser-powder cladding (LC) is one of the intensively developing field of laser technology in direct modification of surface characteristics of materials. It has been widely used in many practical applications such as coating, component repair, and 3D rapid prototyping. The LC needs orientation in wide range of technological regimes, search of optimal energy characteristics of laser radiation and particle flux parameters, physical properties and fraction composition of powder. The quality and microstructure of clad layer are governed by all of these parameters. Process optimization requires both theoretical and experimental understanding of the associated physical phenomena. An empirical optimization is difficult, time-consuming and expensive. Numerical modeling offers a cost-efficient way for understanding the related complex physics in a laser cladding process. An accurate model can be used in process prediction and system control.
There are several numerical and theoretical studies on melt pool dynamics in the LC process in the literature [1-4]. The 1D model of selective laser melting of twocomponents powder composition that account for heat and mass diffusion and fluid flow is investigated in [5,6]. It includes the movement of the solid particles due to shrinkage because of the density change of the powder mixture and the convective fluxes depend on surface tension and gravity forces. Liquid flow is determined by Darcy filtration law. The effect of surface settlement of the powder has been obtained.
In earlier works, height of clad layer was predefined [3]. Recently, level set method was adopted to track free surface evolution [7-10]. Han et al. [7] used a 2D mathematical model for the laser cladding to investigate powder impinging process. Qi et al. [8] developed a selfconsistent 3D model for direct metal deposition with coaxial powder injection. He et al. [9] used that model for investigation of transport phenomena. Modeling of heat-and-mass transfer during plasma deposition manufacturing has some similar solutions [10] such as level set method to track evolution of free boundary.
The knowledge of powder stream temperature is essential for laser cladding technology. Investigation of the heating and melting process in particles delivered to substrate is generally based on Stephan model [11]. Authors have modeled the dynamic and thermal behavior of powder particles in the stream by solving the coupled momentum transfer equations between the particle and gas phase. The accurate model of heating and melting of injected particles at LC process is presented in [12], where the phase change kinetics is considered. Numerical calculations and experimental measures are used [11, 13] to obtain powder stream temperature in coaxial LC.
Commonly, the kinetics of phase change is ignored both for melt pool estimations and particle melting models. In all papers mentioned above, Stephan model is used for melting and crystallization modeling reasonable for equilibrium process. However, laser material treatment is characterized as a rule by rapid and non-equilibrium processes. It is essential to account for kinetic character of the processes [14]. Multiscale model was introduced by authors [15] in order to couple microstructure evolution with macro parameters of the LC process. Nevertheless, phase change problem at LC is not studied enough.
Two approaches for modeling phase change can be underlined. The first is based on description of non-stationary nucleus evolution by unit events of atoms (molecules) attachment and detachment. The cluster size distribution function is quantity characteristic of phase change here. Its behavior is described by Fokker-Planck equation. There are different approximate solutions of it for various simplifying conditions [16-17].
The second simplified approach is in use of Kolmogorov-Avrami equation which allows to obtain explicit expression for volume fraction of new phase with the known nucleation and growth rates. This approximate approach is convenient when associated heat and phase transition kinetics equations are solved together. Earlier, this approach was used, for example, for phase change analysis of silicon exposed short laser impulses [18].
In this study, an improved phase change problem is introduced to involve rapid melting and crystallization which is typical for LC technology. The model is developed to reveal almost all phenomena occur at LC including heat diffusion, melting, crystallization, particle heat and mass addition, laser substrate interaction and free boundary evolution. It consists of 3D heat and phase change (melting/crystallization) equations solved in fully explicit way. Phase change is considered to be non-equilibrium kinetic process and associated with appearance and growth of nucleus in metastable (overheated or supercooled) medium. Modeling of phase change kinetics is based on Kolmogorov-Avrami equation.
2. Model Assumptions
The process of powder deposition at LC is realized by feeding the powder through nozzles (often coaxial) to laser exposed area of substrate. The scheme of LC process with coaxial powder injection is presented on Figure 1. The substrate is exposed by laser radiation moving in positive x direction with constant velocity V. Powder of radius  and temperature
  is delivered onto the substrate coaxially with the laser beam. The laser beam, when passing through the coaxial powder stream, loses
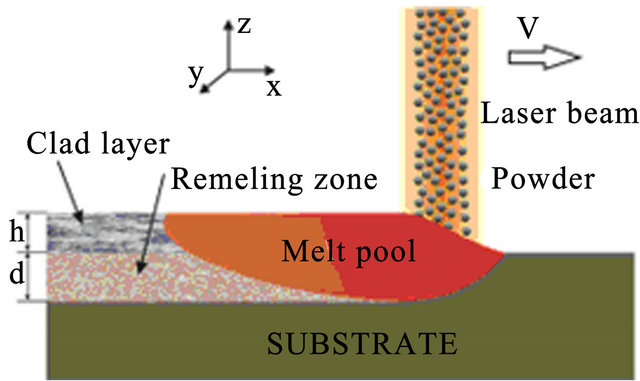
Figure 1. The scheme of laser cladding by powder injection.
energy due to reflection and absorption on particles.
Area of substrate that absorbed enough energy forms melting pool. Cooling, further crystallization and clad building up follows after, when laser beam leaves the area. Laser beam profile is assumed to be Gaussian, the depth-of-focus effect is ignored. Particles reaching molten pool get melt immediately. This approximation is made due to the fact that melting can be completed during 0.1 ms approximately for a 25 µm radius particle gained by calculation. We restrict laser intensity ![]() to the values which does not result in particle and substrate vaporization. The higher intensity results in plasma torch formation and decreases powder capture efficiency that influences negatively on laser cladding. The effect of fluid motion due to Marangoni forces is modeled by introducing an enhanced thermal conductivity factor in the melt pool region [19].
to the values which does not result in particle and substrate vaporization. The higher intensity results in plasma torch formation and decreases powder capture efficiency that influences negatively on laser cladding. The effect of fluid motion due to Marangoni forces is modeled by introducing an enhanced thermal conductivity factor in the melt pool region [19].
3. The Physical Model
The mathematical model involves heat transfer for three phases (solid, liquid and gas) with simultaneous melting and crystallization and evolution of free boundary between liquid and gas.
3.1. The Free Boundary Equation
One of the main problems at LC modeling is to obtain boundary of clad layer. Numerical modeling with moving boundaries is complex task. In earlier papers researcher used to predefine geometry of the surface. In [3], for example, 2D thermal model with spherical geometry of cladding surface was introduced to predict thermal fields.
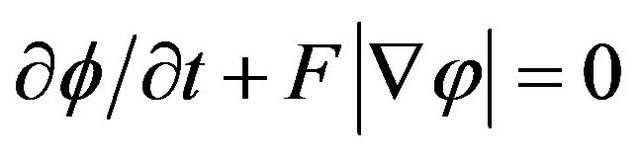
The convenient level-set method has recently been adopted in the deposition modeling to investigate free surface evolution [2,4,7-10]. The key idea here is not to find the boundary, but to track it with the use of special function of the form:
 here d is actual distance from the metal boundary, and the sign depends on the point position (in metal or gas). The function has a value in every point of the calculation domain and movement of free boundary is tracked by level set functions which satisfy the equation. The zero level set is the position of the free surface and other levels has no physical meaning. The interface tracking problem reduces to solving a partial differential equation [20]. In general case, when evolution of free boundary is governed by powder injection and hydrodynamic fluid flow, level set equation takes the form:
 , (1)
, (1)
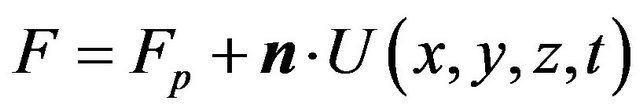
where  is the speed function that acts in the normal direction of the interface:
 ,
,
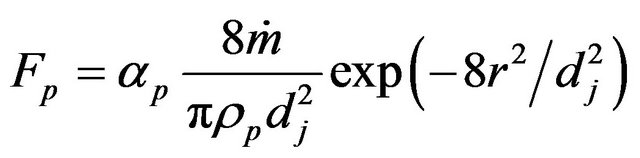 here Fp describes the movement of the interface due to powder addition,
 ![]() is the normal of the interface,
is the normal of the interface,  is the local fluid velocity
  is the powder catchment efficiency,
  is the mass feed rate,
  is the powder density,
  is the jet diameter.
3.2. The Thermal Balance equation
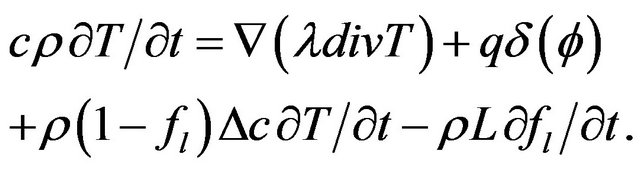
For two phase solid-liquid system heat transfer equation with phase change takes the form
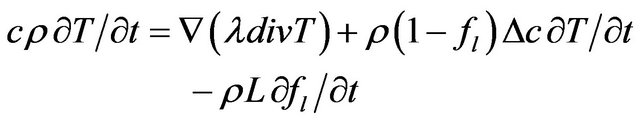 (2)
(2)
where![]() ,
,![]() и
и are specific heat, heat conductivity and density, respectively, L is the latent heat. The detailed justification can be taken from the work [21].
In Equation (2) the first term in the right side is the heat diffusion due to thermal conductivity, the second and third terms are the power density of thermal sources due to phase change.  is the mass fraction of liquid phase, at the moment
  (
( for solid region,
  is for the liquid and can change from 0 to 1 in binary region).
Laser radiation  is absorbed on metal-gas boundary, particles bring/take
  energy depending on the particle temperature. From the other side evaporation
 , Stephan cooling
  occurs on the metal surface. Gas convective cooling also plays the role at LC. Diffusion of gas phase is incorporated into heat equation, so diffusion cooling is considered automatically. So for the flux on metal-gas boundary we have:
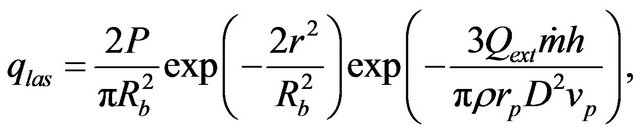

where  is the laser power,
  , V is the scanning speed, second exponent in the formula for
  takes in account attenuation of laser beam coaxial powder stream,
  and
and  are the powder radius and speed, respectively,
  is the diameter of powder flux on the substrate,
  is the contact ratio. Laser beam radius is supposed to be close to powder stream radius
 .
.
Boundary condition can be included into heat transfer Equation (2) as a volume source term, using a delta function , where
  is the level-set value
 (3)
(3)
Delta function  for laser source incorporation can be calculated as a derivative of Heaviside function.
Coefficients for heat transfer equation are defined as follows. All coefficients in gas and metal phases are calculated using Heaviside function:
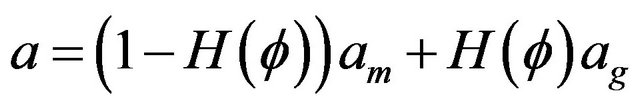
here , values with subscripts m and g denote metal and gas phase, respectively.
In this expression we use smeared Heaviside function, assigned by equation [20]:
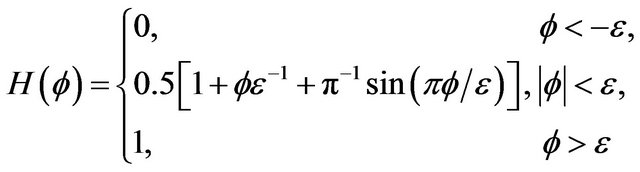
where  is level set function described in Section 2.1,
 ![]() is half-thickness of transition region.
is half-thickness of transition region.
We suppose metal to be a continuum media which is consist of solid, liquid and mushy region. Mass fractions of liquid  and solid
  phases are defined in the following
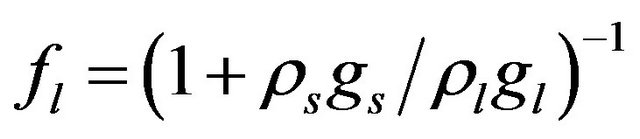 ,
,  where
where  and
and  are the volume fractions of liquid and solid phases,
  and
and  are the densities of solid and liquid phases, respectively. Coefficients in mushy region are expressed by the values of mass
  and volume
  fractions:
 ,
,  ,
,
 ,
, ![]()
where the values with subscripts l and s denote liquid and solid phase, respectively. Using the defined mixture variables, the energy equation is applied for the whole calculation domain.
3.3. The Phase Change Kinetics
Volume fraction of new phase depends on microstructure evolution. Phase change is taken as kinetic process which is associated with nucleation and growth of nuclei of liquid/solid phase in metastable condensed matter. Let  and
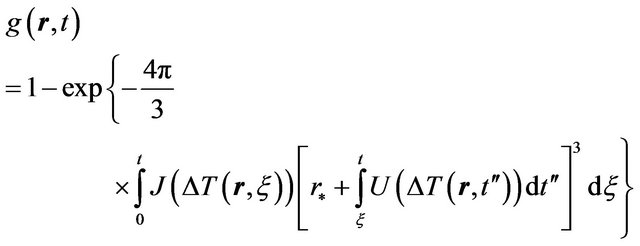
and  are nucleation and growth rates, respectively, which are local functions of temperature. According to [22] the basic phase change kinetic law is Kolmogorov-Avrami equation, which couple volume fraction with nucleation rate
 , (4)
, (4)
where  is the volume of nucleus, generated to time
 , and
, and . Nuclei volume estimation in single-component system is based on accounting of atoms (molecules) thermal oscillations, i.e. is determined by their transition probability through the phase boundary. In the case of spherical geometry for the nuclei volume we have
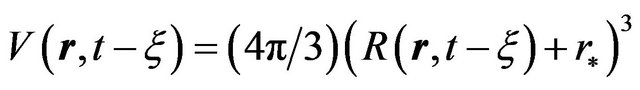 where
where![]() the critical radius of nuclei is. Radius
the critical radius of nuclei is. Radius  is connected with the linear growth rate
  by the following relationship
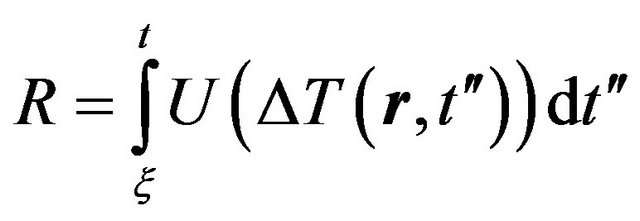
Thus kinetic Equation (5) we can rewrite in the form
 (5)
(5)
where  is superheating in the case of melting, and is supercooling in the case of crystallization.
The form of the nucleation rate  depends on the phase change mechanism. The nucleation rate rises up rapidly on heterogeneous centers (impurities, grain boundary). But the influence of heterogeneous nucleation decreases with cooling/heating rate growth, and homogeneous nucleation plays the essential role, namely fluctuation nucleation of new phase in the unblended regions [22].
In the case then melting/crystallization occurs by homogeneous nucleation in metastable system (superheated or undercooled) the nucleation rate is described by the formula:
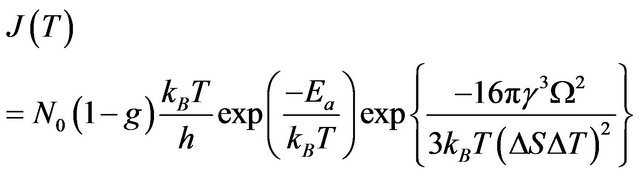 (6)
(6)
where —number of atoms per unit volume (K—number of atoms per one cell, in the case of volume-centric cube K = 2;
 —elementary volume of new phase,
  is the lattice parameter);
  is the Boltzmann constant;
  is the activation energy of atoms for the phase boundary transition;
  is the Planck constant,
  is the surface tension;
  is the entropy change.
The growth rate as a function of temperature has the form:
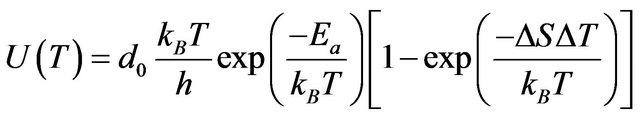 (7)
(7)
The system (1), (4) and (5) is closed and can fully describe the behavior of temperature and new phase volume fraction fields at LC process with coaxial powder feeding.
4. Numerical Algorithm
The numerical implementation of the heat equation is based on the semi-implicit finite-difference approximation method. The stabilizing correction method is used to solve numerical equations which are second order accuracy for time and space dimensions. The detailed procedure of calculation method can be depicted through the following iterative steps:
1) Initialize the calculation variables: let the level set function be the signed normal distance to the surface; set liquid volume fraction g identically zero in the whole calculation domain, and T as room temperature.
2) Compute the laser source term and the thermal coefficients for the computation domain by the temperature on previous layer.
3) Use stabilizing correction method to solve the heat transfer equation 4) Update old liquid volume fraction with Equation (6) for new temperature.
5) Go back to step (2) for the next iteration until convergence criterion  is reached.
6) Advance the level set function in time in an explicit way.
7) Update old temperature, liquid volume fraction, and level set function by new values, and go to the next time step.
5. Numerical Results and Comparison with Experiment
The numerical modeling of heat transfer with phase changes (melting/crystallization) at LC of Fe powder particles has been carried out using the model (1), (4) and (6). Laser power, scanning speed and powder feed rate has been varying in various regimes. Calculations have been held on 2D and 3D formulations. Single track is modeled till temperature get stationary. The convection cooling boundary condition was applied to each side of the substrate except for the free surface where clad forms. Substrate material is considered to be the same as in powder particles. Laser power varied in (0.6 - 4.4) kW diapason. Scanning speed is ranged from 6 mm/s to 4 sm/s and laser beam diameter was 0.35 - 4 mm. Powder feed rate varied in the range of 1 - 8.9 g/min and powder flow diameter was 0.8 - 2 mm on the substrate. Typical values of thermo-physical parameters for Metco 42C powder have been used in calculations.
The calculated sequential 3D track evolution is illustrated in Figure 2. The spatial selectivity of laser energy at LC can be seen. A small zone is affected and the material is not degraded elsewhere. The regimes where the laser heat causes substrate melting, are taken in to consideration, because only that generates a good bonding between the cladding layer and the substrate.
The cross section of temperature field along the scanning direction is presented on Figure 3. Temperature field is displayed by color contours and volume fraction of liquid is shown by black lines. Note that temperature profiles are stretched along the x-axis due to the influence of laser scanning speed. Melting temperature isotherm 1809К is also shown on Figure 3 and melting/ crystallization are seen to take place with considerable
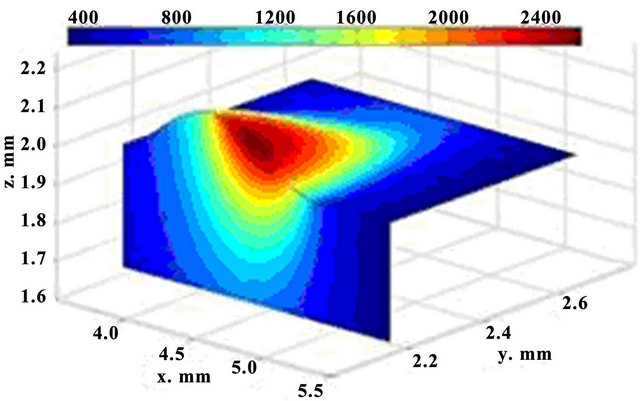
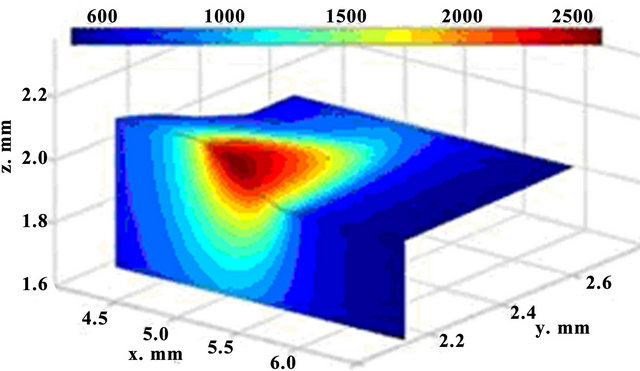
Figure 2. 3D dynamics of temperature fields; t = 62 ms (up) and t = 122 ms (down).
superheating/undercooling. This occurs due to the fact that nucleation rate is zero at melting temperature, as it will be shown below, and gets significant values only after superheating (or undercooling in the case of crystallization).
The distribution of cooling rate values is introduced on Figure 4 in x-z plane. One can note that cooling rate decreases with temperature decrease away from the laser source. Latent heat of phase change is consumed in melting region and is released in crystallization region, so cooling speed is lower in the latter one. The top of crystallization zone is cooling strongly than the bottom, because the intensive heat exchange with air.
Numerical modeling shows that cooling rate is a function of laser power and has a size of order 103 - 104 K/s. The warmer crystallization zone begins to cool rapidly (cooling rate rises). Also cooling rate showed the decrease with time till temperature gets stationary.
Nucleation rate is displayed on Figure 5 in cross section along the scanning direction by the shades of gray (with corresponding scale of values). Black dashed line represents the substrate level, and solid lines are three contours of volume fraction  = 0.01,
  = 0.95 and
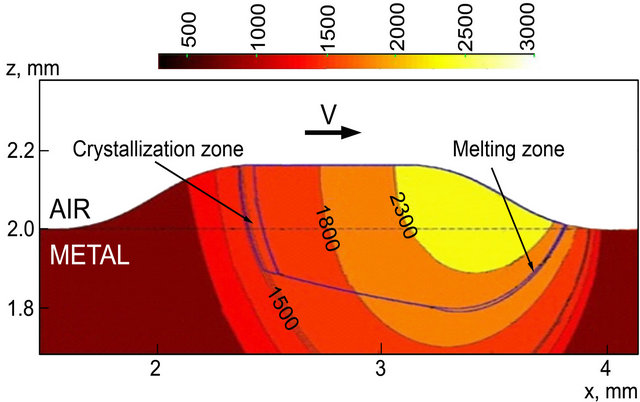
Figure 3. The x-z cross-section of temperature field, t = 130 m/s.
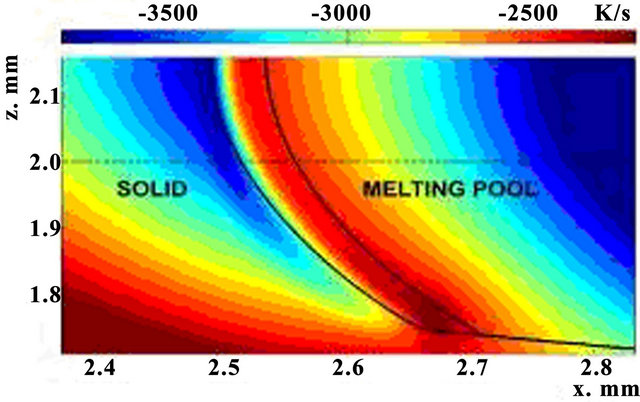
Figure 4. Spatial distribution of cooling rate in the crystallization zone P = 0.75 kW, t = 200 ms, V = 12 mm/s, m = 1 g/min.
 . Nucleation rate is seen to get appreciable values for phase change in transition liquid-solid zone. Temperature dependences of nucleation and growth rates on the line A-A (see Figure 5) are presented on Figure 6. Note that intensive nucleation occurs at temperature. Nucleation rate increases exponentially to the values of 105 sm−3·s−1. Large quantity of nucleus restrain nucleationrate, so further growth of its value changes by rapid decrease due to solid fraction increase.
Large quantity of nucleus restrain nucleation rate, so further growth of its value changes by rapid decrease due to solid fraction increase. The calculation shows that typical undercooling [23] is reached at cooling rate observed at LC. One can note that at such undercooling first exponent in (7) associated with activation energy do not plays any role and decrease of nucleation rate occurs due to multiplier . Also one can note that maximum of growth rate is in the region where nucleation doesn't occur yet, and it appears to be decreasing function in the nucleation region. Equation (6) shows that volume fraction of new phase can increase due to nucleation and growth processes.
The temperature and volume fraction dynamics are found to have qualitative difference at crystallization for different cooling rate (Figures 7 and 8). At the beginning of the process when cooling rate is high temperature change is monotonous (black solid line). Volume fraction of solid phase grows rapidly (grey solid line). When the cooling rate decreases behavior of temperature is non-
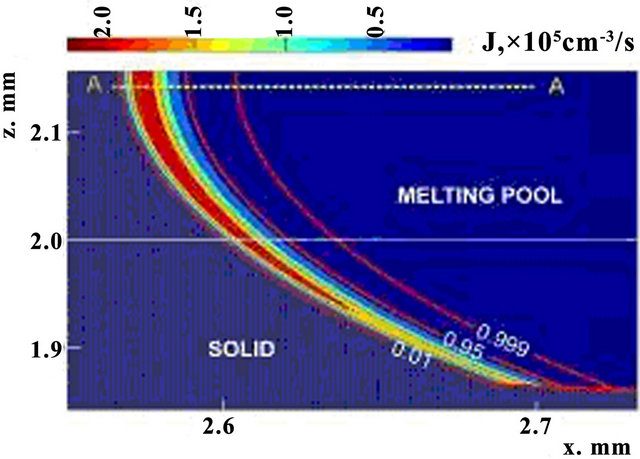
Figure 5. The x-z cross-section distribution of nucleation rate, t = 156 ms.
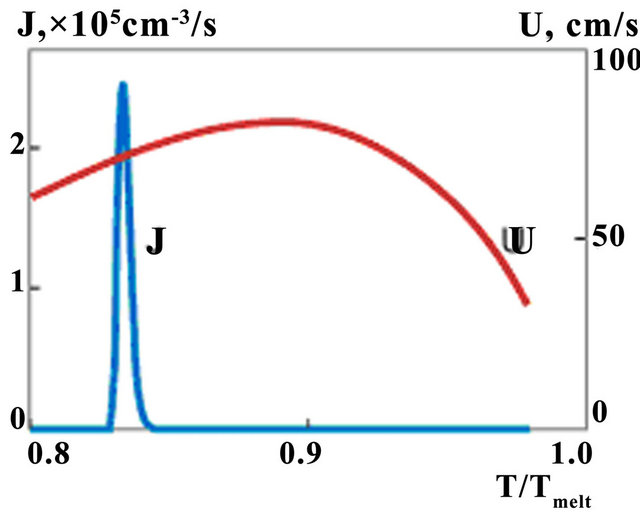
Figure 6. The temperature dependences of nucleation (J) and growth rates (v); t = 156 ms.
monotonous (black dot-dashed line) and volume fraction of solid phase grows smoother (grey, dot-dashed line). This behavior is associated with heat release at crystallization: nonessential in the first case and essential in the second.
The laser power, scanning speed and mass feed rate are known to be the main input parameters. The output parameters are system maximum temperature, melt pool depth and cladding height. These are tree essential parameters to characterize melt pool thermal behavior and they are calculated different input parameters. The parametric investigation was conducted on 3D model. Calculated (solid line) and experimental values (dot line) of clad height and melt pool depth as functions of laser power are shown on Figures 9 and 10. The calculations are carried out at a constant mass feed rate and a scanning velocity. Melt pool size is defined by full molten state.
For comparison with the calculated clad heights were performed experiments were carried out. Laser clad-
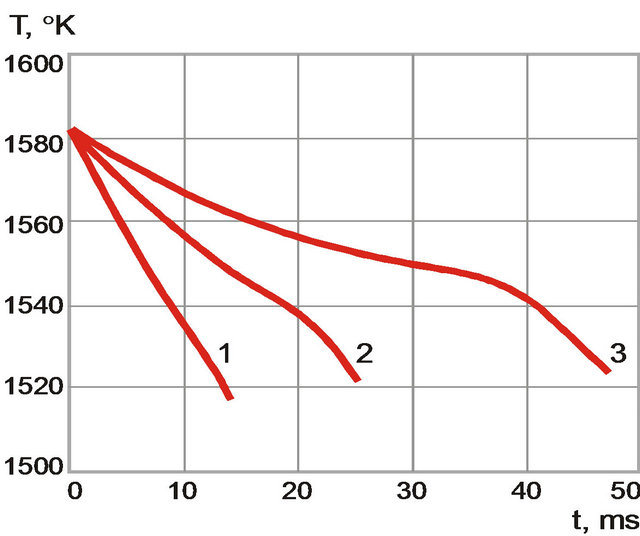
Figure 7 The temperature dynamics for different cooling rates. (1) 4500 K/s; (2) 2400 K/s; and (3) 1200 K/s.
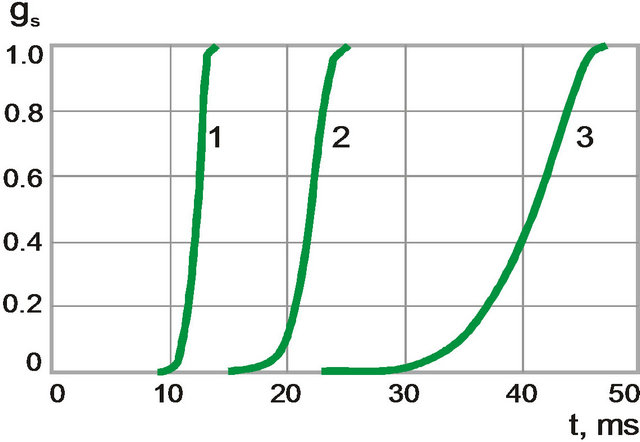
Figure 8. The time dependences of volume fraction of solid phase for different cooling rates. (1) 4500 K/s; (2) 2400 K/s, and (3) 1200 K/s.
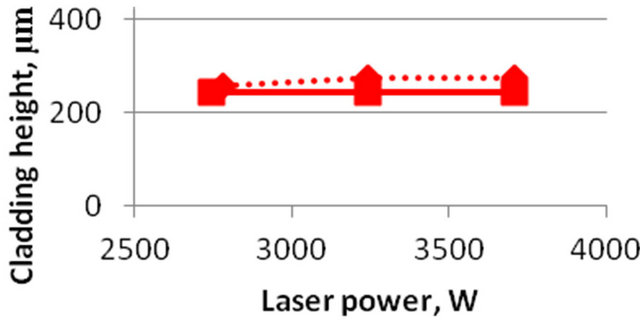
Figure 9. Clad height dependence on laser power. Dotted curve is experiment, solid line is numerical calculations. feed rate m = 8.9 g/min, scanning velocity V = 40 mm/min.
ding of 431 martensitic stainless steel was deposited onto 10mm flat bar C-steel substrate. A 4.4 kW Rofin DY044 diode pumped Nd: YAG laser coupled to a Kuka KR60L30 articulated arm robot and Precitec YW50 welding head with 300 mm focal length was used. Powder cladding was performed with Metco 42C powder and a coaxial nozzle with powder focus diameter of 2.0 mm. Laser spot sizes of 2.0 mm and 4.0 mm were selected to determine the effect of laser power, cladding speed and powder feed rate on dilution and clad height. The experimental methodology was based on a constant powder feed rate per unit length. Powder feed per unit length for the 2 mm spot size was 3.8 g/m and 3.8 and 9.2 g/m for the 4 mm spot size. Process parameters are shown in Table 1. Powder feed rate was converted from rpm to g/min by measuring the weight of powder fed per unit time.
The results of experimental data (dotted lines) for the value of the deposited layer depending on the laser power are shown in Figures 9 and 10. It is seen that the numerical results (solid line) a satisfactory agreement with the experimental data.
Clad height (H) and melt pool depth (D) as functions of scanning speed are shown on Figure 11. Calculations are carried out at constant mass feed rate 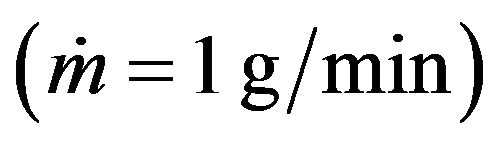 and for two values of laser power P = 0.6 kW and P =
Table 1. Processing conditions.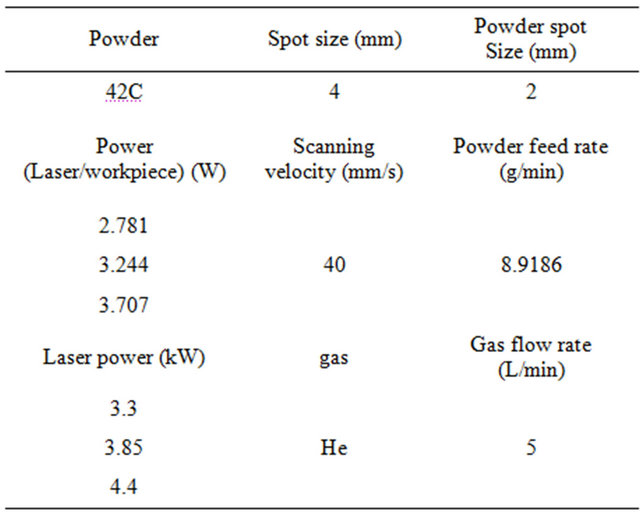
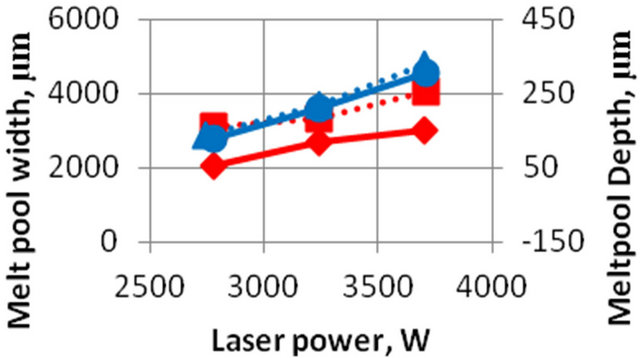
Figure 10. Experimental (dotted line) and numerical (solid line) values of melt pool width (red) and depth (blue) as a function of laser power. Feed rate m = 8.9 g/min, scanning velocity V = 40 mm/min.
0.75 kW. One observes similar decreasing trends both for clad height and melt pool depth with the increase of laser power, but the last decreases weaker.
The energy that is brought into melting pool increases with laser power increase which results in melt pool depth growth. The clad height influences on the melt pool dimensions so it was fixed by mass feed rate and scanning speed for melt pool depth investigations. The melt pool depth dependence on laser power at fixed clad height is presented on Figure 12. Results for the clad height h = 60 µm (1 g/min, V = 16 mm/s) are represented by grey line and for the clad height h = 182 µm ( ,
, ) are shown in white color. Melt pool depth increases with laser power growth. Also one can see the influence of mass feed rate on the melt pool depth. The denser stream attenuates more laser energy so melt pool depth decreases.
6. Conclusions
The numerical model of LC has been presented, which considers the spatial dynamics forecasting of temperature and volume fraction of liquid phase fields at laser deposition of single-component powder on the substrates. The model is based on self-consistent nonlinear equations of heat transfer and kinetics of phase transition.
The time-space dynamics of temperature field, the free boundary evolution and profiles of distribution of liquid
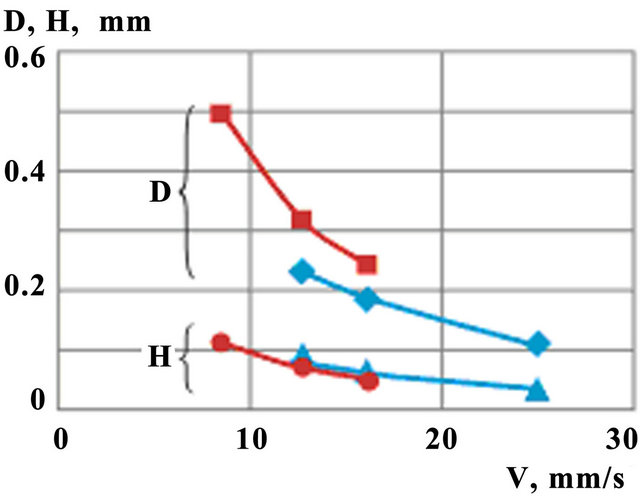
Figure 11. Melt pool depth (D) and clad height (H) dependence on scanning speed for different laser power ( ,
, — P = 0.6 kW;
 ,
, —P = 0.75 kW).
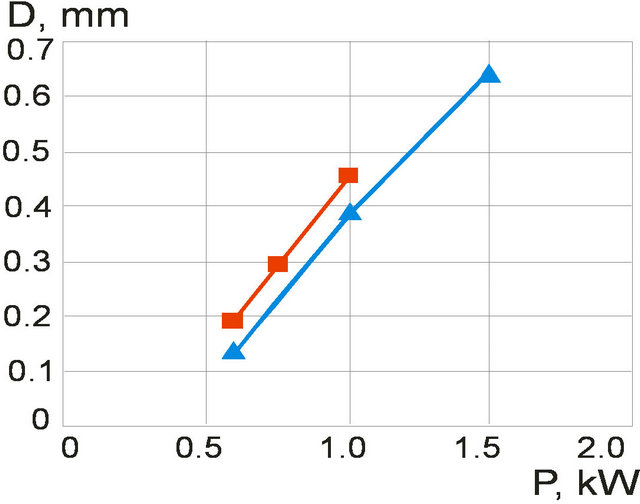
Figure 12. Melt pool depth dependence on laser power at fixed clad height: grey line (h = 60 µm, m = 1 g/min); white line—h = 182 µm, m = 3 g/min (scanning velocity V = 16 mm/s).
and solid phases for different process parameters and characteristics of laser radiation are calculated. Due to the fact that melting occurs with superheating and crystallization—with undercooling, the melt zone has the boundary distinct to the melting temperature isotherm.
Qualitative difference of the crystallization process at high and low cooling speeds is discovered. Temperature dynamics is monotonous at the beginning of the process at high cooling speeds. Then, the process continues while cooling speed decreases and temperature dynamics is nonmonotonic. This is due to the influence of latent heat of crystallization: inessential of the first case and quit appreciable in the second.
The influence of laser power, mass feed rate and scanning speed on maximum temperature and the melt pool behavior is analyzed. It is determined how melt pool depth increases with laser power growth, and cladding height decreases with the scanning speed. Clad layer profile modeling agrees with experimental data. This information provides the starting data for simulations of the microstructure and the residual stress field.
7. Acknowledgements
This research has been supported by the Russian Foundation for Basic Research (Grant No 11-08-93966-SA_а) and Ministry of education and science of Russia (Grant No 07.524.12.4019).
REFERENCES
- G. G. Gladush and I. Smurov, “Physics of Laser Materials Processing: Theory and Experiment,” Springer-Verlag, Berlin, 2011. doi:10.1007/978-3-642-19831-1
- S. Wen and Y. C. Shin “Modeling of Transport Phenomena during the Coaxial Laser Direct Deposition Process,” Journal of Applied Physics, Vol. 108, No. 4, 2010, Article ID: 044908. doi:10.1063/1.3474655
- A. F. A. Hoadley and M. Rappaz, “A Thermal Model of Laser Cladding by Powder Injection,” Metallurgical Transactions B, Vol. 23, No. 5, 1992, pp. 631-642.
- J. Choi, L. Han and Y. Hua, “Modeling and Experiments of Laser Cladding with Droplet Injection,” Journal of Heat Transfer, Vol. 127, No. 9, 2005, pp. 978-986.
- V. G. Niziev, A. V. Koldoba, F. Kh. Mirzade, V. Ya. Panchenko, Yu. A. Poveschenko and M. V. Popov, Mathematical Models and Computer Simulations, Vol. 3, No. 6, 2011, pp. 753-761. doi:10.1134/S2070048211060081
- V. G. Niziev, F. Kh. Mirzade, V. Ya. Panchenko, G. V. Ustugova and V. M. Chechetkin, Mathematical Models and Computer Simulations, Vol. 3, No. 6, 2011, pp. 723-731.
- L. Han, F. W. Liou and K. M. Phatak, “Modeling of Laser Cladding with Powder Injection,” Metallurgical and Materials Transactions B, Vol. 35, No. 6, 2004, pp. 1139- 1150.
- H. Qi, J. Mazumder and H. Ki, “Numerical Simulation of Heat Transfer and Fluid Flow in Coaxial Laser Cladding Process for Direct Metal Deposition,” Journal of Applied Physics, Vol. 100, No. 2, 2006, Article ID: 024903. doi:10.1063/1.2209807
- X. He and J. Mazumder, “Transport Phenomena during Direct Metal Deposition,” Journal of Applied Physics, Vol. 101, No. 5, 2007, Article ID: 053113. doi:10.1063/1.2710780
- H. O. Shang, F. R. Kong, G. L. Wang and L. F. Zeng, “Numerical Simulation of Multiphase Transient Field during plasma deposition manufacturing,” Journal of Applied Physics, Vol. 100, No. 12, 2006, pp. 123522- 123531. doi:10.1063/1.2399341
- S. Y. Wen, Y. C. Shin, J. Y. Murthy and P. E. Sojka, “Modeling of Coaxial Powder Flow for the Laser Direct Deposition Process,” International Journal of Heat and Mass Transfer, Vol. 52, No. 25-26, 2009, pp. 5867-5877.
- R. V. Grishaev, M. D. Khomenko and F. Kh. Mirzade, “Numerical Modeling of Heating and Melting of Microparticles under Laser Radiation,” Proceedings of SPIE, Vol. 7994, No. 1, 2011, Article ID: 79940U1-9.
- J. Lin, “Temperature Analysis of the Powder Streams in Coaxial Laser Cladding,” Optics and Laser Technology, Vol. 31, No. 8, 1999, pp. 565-570. doi:10.1016/S0030-3992(99)00115-2
- F. Kh. Mirzade, M. D. Khomenko, V. G. Niziev, R. V. Grishaev and V. Ya. Panchenko, “Three Dimensional Model of Melting and Crystallization Kinetics during Laser Cladding Process,” SPIE Proceedings of 19th International Symposium on High-Power Laser Systems and Applications, Istanbul, 10 September 2012, Article ID: 86770R.
- Y. Cao and J. Choia, “Multiscale Modeling of Solidification during Laser Cladding Process,” Journal of Laser Applications, Vol. 18, No. 3, 2006, pp. 245-257.
- J. W. Christian, “The Theory of Transformations in Metals and Alloys,” Pergamon Press, Oxford, 1975, p. 586.
- F. Kh. Mirzade, “Kinetics of Nucleation and Nanostructure Formation in Condensed Systems,” In: V. Ya. Panchenko and V. S. Golubev, Eds., Modern Laser-Information Technologies, Intercontact Nauka, Moscow, 2005, pp. 62-78.
- S. P. Zhvavyi, “Simulation of the Melting and Crystallization Processes in Monocrystalline Silicon Exposed to Nanosecond Laser Radiation,” Technical Physics, Vol. 45, No. 8, 2000, pp. 1014-1018. doi:10.1134/1.1307010
- C. Lampay, A. F. H. Kaplanz, J. Powellyx and C. Magnusson, “An Analytical Thermodynamic Model of Laser Welding,” Journal of Physics D: Applied Physics, Vol. 30, No. 9, 1997, pp. 1293-1299. doi:10.1088/0022-3727/30/9/004
- J. A. Sethian, “Level Set Methods and Fast Marching Methods,” 2nd Edition, Cambridge University Press, Cambridge, 1999.
- V. R. Voller and C. R. Swaminathan, “General SourceBased Method for Solidification Phase Change,” Numerical Heat Transfer, Part B, Vol. 19, No. 2, 1991, pp. 175-189.
- V. P. Skripov and V. P. Koverda, “Spontaneous Crystallization of Undercooled Liquid,” Nauka, Moscow, 1984.
- A. V. Evteev, A. T. Kosilov, E. V. Levchenko and O. B. Logachev, “Kinetics of Isothermal Nucleation in Supercooled Melt of Iron,” Fizikatvyordogotela, Vol. 48, No. 5, 2006, pp. 557-582.