American Journal of Molecular Biology
Vol.06 No.04(2016), Article ID:71199,21 pages
10.4236/ajmb.2016.64014
The Potential of DNA Barcode-Based Delineation Using Seven Putative Candidate Loci of the Plastid Region in Inferring Molecular Diversity of Cowpea at Sub-Species Level
Patrick Okoth1, John Muoma2, Mulaya Emmanuel3, Wekesa Clabe4, Dennis O. Omayio2, Paul O. Angienda1
1Department of Zoology, School of Physical and Biological Sciences, Maseno University, Maseno, Kenya
2Department of Biological Sciences, Masinde Muliro University of Science and Technology, Kakamega, Kenya
3Centre for Global Health Research, Kenya Medical Research Institute (KEMRI), Kisumu, Kenya
4Department of Biochemistry and Biotechnology, Kenyatta University, Nairobi, Kenya

Copyright © 2016 by authors and Scientific Research Publishing Inc.
This work is licensed under the Creative Commons Attribution International License (CC BY 4.0).
http://creativecommons.org/licenses/by/4.0/


Received: September 12, 2016; Accepted: October 10, 2016; Published: October 13, 2016
ABSTRACT
The novelty and suitability of the mitochondrial gene CO1 in DNA barcoding as a reliable identification tool in animal species are undisputed. This is attributed to its standardized sequencing segment of the mitochondrial cytochrome c oxidase-1 gene (CO1) which has the necessary universality and variability making it a generally acceptable barcode region. CO1 is a haploid single locus that is uniparentally-inherited. Protein-coding regions are present in high-copy numbers making it an ideal barcode. The mitochondrial oxidase subunit I (COI) gene is a robust barcode with a suitable threshold for delineating animals and is not subject to drastic length variation, frequent mononucleotide repeats or microinversions. However, a low nucleotide substitution rate of plant mitochondrial genome [mtDNA] precludes the use of CO1 as a universal plant DNA barcode and makes the search for alternative barcode regions necessary. Currently, there exists no universal barcode for plants. The plastid region reveals leading candidate loci as appropriate DNA barcodes yet to be explored in biodiversity studies in Kenya. Four of these plastid regions are portions of coding genes (matK, rbcL, rpoB, and rpoC1), and three noncoding spacers (atpF-atpH, trnH-psbA, and psbK-psbL) which emerge as ideal candidate DNA loci. While different research groups propose various combinations of these loci, there exists no consensus; the lack thereof impedes progress in getting a suitable universal DNA barcode. Little research has attempted to investigate and document the applicability and extend of effectiveness of different DNA regions as barcodes to delineate cowpea at subspecies level. In this study we sought to test feasibility of the seven putative candidate DNA loci singly and in combination in order to establish a suitable single and multi-locus barcode regions that can have universal application in delineating diverse phylogeographic groups of closely related Kenyan cowpea variants. In this study, our focus was based on genetic parameters including analyses of intra- and infra-specific genetic divergence based on intra- and infra-specific K2P distances; calculation of Wilcoxon signed rank tests of intra-specific divergence among loci and coalescence analyses to delineate independent genetic clusters. Knowledge of DNA candidate loci that are informative will reveal the suitability of DNA barcoding as a tool in biodiversity studies. Results of this study indicate that: matK, trnH-psbA, psbK-psbL, and rbcL are good barcodes for delineating intra and infraspecific distances at single loci level. However, among the combinations, matK + trnH-psbA, rpoB + atpF-atpH + matK are the best barcodes in delineating cowpea subvariants. rbcL gene can be a suitable barcode marker at single locus level, but overall, multi locus approach appears more informative than single locus approach. The present study hopes to immensely contribute to the scanty body of knowledge on the novelty of DNA barcoding in cataloguing closely related cowpea variants at molecular level and hopes to open up future research on genomics and the possibility of use of conserved regions within DNA in inferring phylogenetic relationships among Kenyan cowpea variants.
Keywords:
DNA Barcoding, Plastid Region, DNA Sequencing, Intergenic Spacers, cp DNA, Molecular Phylogenetics, Intraspecific, Infraspecific

1. Background
DNA-barcoding is a technique used for the taxonomic characterization and phylogenetic analysis of organisms and entails the use of defined regions within the DNA genetic material of an organism, which though exposed to evolution mechanism, is conserved between and within the species. This region serves as a tool to uniquely identify two individuals with unique ancestral-lineage. DNA barcoding is a sequence-based identification system that may be constructed of one or several loci taken together as a complementary unit in delineating relationships and inferring patterns of change among related organisms. It employs short highly variable regions of the genome to delineate organism that are closely related. In animals including human, cytochrome oxidase I (coI-gene) has vastly been utilized as a unique barcoding region for phylogenetic analysis. The mitochondrial coxidase subunit I (COI) gene has demonstrated significant reliability and recoverability notwithstanding its limited application in the plant kingdom [1] . The Consortium for the Barcode of Life (CBOL) plant-working group proposes seven Barcode regions for use as barcoding markers [2] . The feasibility of DNA barcoding and the use of plastid regions in biodiversity studies can be an important tool of utility at molecular level. Plastid DNA candidate loci are universally present and conserved in the plant target lineages and can provide a rapid and reproducible
molecular identification away from the Linnaean system of nomenclature. The informativeness of each barcode region was therefore explored singly and in combination with a view to assessing the feasibility of these candidate loci in infra-specific and intra- specific discrimination of phylogeographic groups among Kenyan cowpea variants. This was informed by the fact that chloroplast genes exist in a single copy and are conserved among plant eukaryotic genomes. These regions undergo limited mutation over- time and are considered novel in revealing evolutionary divergences and ancestral lineages within species. A single and multilocus approach was explored using seven chloroplast genic candidate DNA regions (rbcL gene, atpF-atpH spacer, matK gene, rpoB gene, rpoC1 gene, trnH-psbA spacer and psbK-psbI spacer.
2. Single-Locus DNA Barcode Typing
2.1. MatK
matK is considered an important tool in plant evolutionary studies and systematics. matK gene loci is the only putative group II intron maturase encoded in the chloroplast genome of plants and is the only plastid gene containing this putative maturase domain in higher plants [3] . matK is Maturase-Kinase gene, a plastid gene responsible for the chloroplast post-transcriptional processing. It has an unusual evolutionary tempo, with relatively high substitution rates at both nucleotide and amino acid levels according to [4] . The strong phylogenetic signal from matK gene renders it invaluable gene loci in plant systematics and evolutionary studies at various evolutionary depths. This gene is proposed as the only chloroplast-encoded group II intron maturase, and is suggested to play a role in chloroplast post-transcriptional processing. The ability of Maturase kinase sequence to solely work as a barcoding candidate was assayed together with the six other candidates in the present study to delineate distance characterization. matK has in the recent past emerged as an invaluable locus in plant biodiversity and systematics based on its highly informative ability to decode phylogenetic distinctiveness unlike other candidate loci [5] . This genelocus has 1500 base pair nested in the group II intron of the 50 and 30 exons of trnK in the large single copy region of the chloroplast genome of green plants. matK gene sequence is one of the seven putative gene loci widely utilized in the DNA barcoding of land plants [6] . Phylogenetic analysis based on matK, against other candidate genes has demonstrated excellent parsimony informative characters with significantly more phylogenetic structure pereach parsimony-informative site contrary to the highly conserved chloroplast/plastid region. matK sequence information has been reported to generate robust phylogenies [7] and is considered to have reliable evolutionary rate, suitable length and good inter specific divergence as well as a low transversion rate [8] . matK is however difficult to amplify universally demonstrating that matK barcode albeit informative, may be inadequate and inconclusive when used in isolation as a universal barcode. This study therefore considered matK alongside other six barcode.
2.2. rbcL
A region of the chloroplast gene rbcL―RuBisCo large subunit has been considered an
ideal candidate barcode region in plants and is famed as the most abundant protein on earth. The region, RuBisCo (Ribulose-1, 5-bisphosphate carboxylase oxygenase) is used in the catalysis of the first step of carbon fixation and is a target region in phylogenetic investigations due to its easy amplification, sequencing and alignment. Many taxonomists consider rbcL gene as ideal DNA barcoding region for plants at both family and generic level. However, rbcL sequences have the limitation of slow evolution. The rbcL locus has the lowest divergence of plastid genes in flowering plants according to [1] . Studies by (CBOL Plant Working Group [9] - [12] report modest discriminatory power of this locus. Other studies however indicate that rbcL remains one of the best candidate barcodes based on the straightforward recovery of the gene sequence, easy accessibility and discriminatory power [13] .
2.3. trnH-psbA
The trnH-psbA region is a straightforward region easily amplifiable across land plants, and is one of the most variable intergenicspacers [14] . It has been used successfully in a range of barcoding studies. [15] report that the trnH-psbA, non-coding intergenic region exhibits significant sequence divergence with notable insertion/deletion rates. Studies by [16] indicate that this plastid region has highly conserved coding sequences that makes it an attractive marker. These attributes make trnH-psbA an important plant barcode for species discrimination [15] . However, the complex molecular evolution and considerable length variation of trnH-psbA limits it as a barcode singly [17] . However, trnH-psbA is reported to suffer high rates of insertion or deletion in larger families of angiosperms. The trnH-psbA putative gene loci albeit a standard barcode region in most plants has been reported to suffer frequent inversions in some lineages of plants and singly as a barcode marker, may result to overestimation of genetic divergence and consequently inaccurate assignment of phylogenetic position [18] .
2.4. atpF-atpH
The second International Barcode of Life Conference proposes that at pF-atpH intergenic spacer is a potential plant barcode region [9] . The fact that atpF-atpH marker has not been widely used in studies of plant systematic and phylogeographics has led to paucity of data on its performance as barcodes. However, the CBOL Plant Working Group indicate that atpF-atpH has relatively modest discriminatory power, intermediate sequence quality and universality and could be used as a plant DNA barcode. Recent studies document positive reports on the performance of atpF-atpH as a plant barcode region [19] . Ki-Joong Kim, pers. Comm reports usefulness of atpF-atpH on the Korean flora biodiversity studies. Studies on duckweeds [20] also demonstrated that atpF-atpH, a noncoding spacer could serve as a universal DNA barcoding marker for species-level identification. In their study, the utility of this non cording region in identification of new species by reason of its ease of amplification, straightforward sequence alignment and rates of DNA variation was reported [20] . In the same study, it’s documented that DNA barcoding made significant contribution to the taxonomical structure in duckweeds as opposed to the less informative morphological classification and therefore recommends atpF-atpH as an important barcode region in biodiversity studies. The current study therefore seeks to among others test the in formativeness of this barcode region in delineating cowpea diversity at sub-species level.
2.5. Multi-Locus Candidate DNA Barcode Typing [MLA]
Lack of adequate variation within single loci makes it difficult to get a universal plant barcode comparable to CO1 in animal species [11] ; [12] ; [15] ; [21] - [24] . Amulti-locus approach has been suggested as ideal in delineating species [9] ; [12] ; [15] ; [25] - [28] . Various combinations of plastid loci have been proposed by many studies because combined barcodes exhibit satisfactory discrimination as opposed to single-locus approaches; rbcL + trnH-psbA [15] , or rpoC1 + matK + trnH-psbA or rpoC1 + rpoB + matK [21] and matK + atpF-atpH + psbK-psbL or matK + atpFatpH + trnH-psbA [29] . Previous studies by [15] support the earlier observation that trnH-psbA coupled with rbcL can correctly delineate and discriminate among related species. In the same study, a combination of the non-coding trnH-psbA spacer region and a portion of the coding rbcL locus are considered ideal two-locus global land plant barcode that provides the necessary universality and species discrimination that meets good threshold of CBoL. The Consortium for the Barcode of Life-Plant Working Group (CBOL) recommends a two-locus combination of matK and rbcL as suitable plant barcode with a discriminatory efficiency of 72% [9] . A multi-locus approach has been suggested in typing plant species by taxonomists [12] ; [21] ; [30] ; [31] . However, CBOL demonstrated that multiple loci approach did not clearly improve the species-level discrimination. Accordingly whole-plastid genome sequence has been suggested by other studies as appropriate in plant identification [32] - [34] . Overall, a MLA exhibit higher discriminatory ability as opposed to single-locus barcodes in most studies. Accordingly, several combinations of plastid loci have been suggested among them rbcL + trnH-psbA [15] , rpoC1 + matK + trnH-psbA or rpoC1 + rpoB + matK [18] and matK + atpF-atpH + psbK-psbL or matK + atpFatpH + trnH-psbA [29] . The current study seeks to test this at sub species level. In this study, we sought to test these combinations in delineating cowpea accessions at varietal level. An investigation of the relevance of
3. Statistical Analysis
BIOEDIT Software was used to analyze raw sequence data chromatograms by trimming and assembling. MEGA 6.06 software was then used for multiple sequence alignment. The UPGMA was used for clustering and generating an accurate topology with reference to the molecular clock based on the greatest similarity amongst pairs [35] . Distance estimation model used the Kimura 2 Parameter (K2P) model. This was because K2P distances are best when distance is low especially in highly similar sequences [36] . This was further informed by the fact that our sequences were from closely related cowpea sub variants. The K2P distances generated were exported into an Excel format which was uploaded into GraphPad software and STATA for further statistical analysis. GraphPad Prism v. 7 was then used to plot the histograms on Intra-specific and Infra-specific distances after importing the excel file containing the K2P distances. Wilcoxon Signed Ranks test was performed to separately compare the intra-specific and infra-specific distances of between markers at single and multi-locus level. The choice of Wilcoxon test was informed by the fact that data was non-parametric and did not assume a normal Gaussian distribution [37] . STATA 13 was then used to perform the Moods median Test and the Wilcoxon Two Sample Test for Table 7. Moods median test was used because the data was not normally distributed and yet the mean would not be a good representative of “location” [37] ; hence the need to employ a statistical tool which utilized the median as a better estimator of “location”. The Moods Median test was then preferred to the Sign test. The Wilcoxon two sample tests acted as a quality control for the median test by comparing the P-values of both for significance.
4. Materials and Methods
4.1. DNA Extraction, PCR Amplification, and Sequencing
57 cowpea accessions from different phylogeographic locations of Kenya deposited in the National Gene Bank of Kenya were used for this study. The accessions were collections from different agro-ecological zones of Kenya. Seeds were planted in the green house at Masinde Muliro University of Science and Technology under strict conditions. Young leaves were sampled eight days after planting in 1.5 mL Eppendorf tubes. They were immediately frozen in liquid nitrogen and stored at −80˚C. Leave samples were then manually ground using a micropestle. DNA quality and quantity control was done using Nano-drop spectrophotometer. DNA was normalized by adjusting its concentration to 25 ngμL in an optical 96-well Reaction plates using sterile de-ionized water. Total DNA was extracted using Qiagen plant DNA extraction protocol as per the manufacturer’s guidelines with slight modifications. Total DNA was extracted from each sample and quantified using the DNA Nano Drop ND-1000 by Thermo Fisher at the Kenya Medical Research Institute [KEMRI-Kisumu Kenya]. This was followed by amplification of three intergenic spacers’ atpF-atpH, psbK-psbI and trnH-psbA and four genes: matK, rbcL, rpoB, rpoC1using the primers as shown in Table 1. The amplicons were resolved on 3% agarose gel at 80 V for 48 minutes. The gels were observed for bands using a UV trans-illuminator (FotoDyne model 3 3500 Foto-Prep). Photographs of the bands were taken using the software “Strata-gene Eagle View” that was integrated with the digital camera on the UV trans-illuminator. The bands containing DNA of interest which is 400 bp long was excised and the DNA purified using the DNA purification kit from Qiagen. Sequenced products were then analyzed using an automatic sequencer, ABI3730XL (Applied Biosystems). The sequence chromatograms were analyzed and the terminals were trimmed using the BioEdit software (Thomas Hall & Abbott). Similarity searches were conducted based on Basic Local Alignment Search Tool (BLAST) located at www.ncbi.nih.gov/blast; with the parameters set as follows: database-non redundant;

Table 1. List of cpDNA genes/intergenic spacers amplified in the present study including primers and approximate amplicon lengths.
search-megablast and the expectant value set at 10−9. The sequence that had the lowest expectant value (E-value) and the highest identity score was considered to be a similar sequence. The NCBI taxonomy tool (https://www.ncbi.nih.gov/taxonomy) was then used to determine the complete classification of the sequence which was confirmed in the International Plant Names Index website (https://www.ipni.org/ipni/plantnamessearchpage.do). The sequences were then named as per the molecular characterization. Three subspecies were identified namely: Vigna unguiculata (L.) Walp. Subsp. Cylindrica; Vigna unguiculata var. serotina Bertoni; Vigna unguiculata subvar. Deflexa Bertoni. Also included in our analysis were two other species namely Rhynchosia minima and Vignaluteola to act as out groups for the phylogenetic analysis. The sequences were then assembled into a single Fasta file format in BioEdit software version 7 (Thomas Hall & Abbott). This was followed by performing a local alignment using muscle in Mega 6 software with UPGMA as the clustering method. The intra-specific and infra-specific distances were determined using Kimura-2-parameters in mega 6. Since all the sequences were from the genus Vigna unguiculata but different sub-variants; therefore in Mega 6; the intraspecific distances were determined as “between the various group mean distances” and the infraspecific sequences inferred based on “within group mean distance”.
4.2. Sequence Alignment, Analysis and Amplification Efficiency
Consensus sequences were generated and sequences of the candidate DNA barcodes aligned using muscle. Genetic distance matrices were calculated on the basis of Kimura 2-Parameter (K2P) substitution model for the seven chloroplast candidate DNA loci and the average values between subpopulations inferred. Combined DNA barcode sequences showed significant intra specific but low infra-specific variation rates (Table 3 and Table 4). Average infra and intra-specific distance, mean theta and coalescent depth were calculated to determine infra and intra-specific variation [Table 3 and Table 4]. Wilcoxon signed-rank tests were performed. The distribution of intra-specific versus infra specific variability was evaluated by assessment of the DNA barcoding gaps. The average intra-specific distance, mean theta, and coalescent depth were calculated to evaluate the intra-specific variation [Table 3 and Table 4]. Wilcoxon signed- rank tests were used [Table 5 and Table 6]. Infra- and intra-specific genetic divergences were calculated based on each putative candidate loci. To characterize intra- specific divergence it was necessary to invoke three different metrics. Genetic distances between cowpea variants were used to characterize intra-specific divergence. For each barcode, pairwise distances were calculated with the simplest K2P model followed by Wilcoxon Signed Rank Tests to compare infra- and intra-specific variability for every barcodes following Kress and Erickson [Table 5 and Table 6. DNA barcoding gaps were evaluated by comparing the distribution of infra- versus intra-specific divergences. Median and Wilcoxon Two-Sample Tests were used to evaluate any overlaps in the distributions with a view to establishing a suitable single and multilocus barcode for cowpea at sub-species level [Table 6].
5. Results and Discussion
5.1. DNA Barcoding Success and Levels of Variability
Overall, PCR amplifications were largely successful and any low quality sequences and dubious amplicons were excluded from the analyses [Table 2]. Similar observations were made by [11] ; [15] . However, all the primer pairs designed for each DNA region proved highly successful [Table 1].
5.2. Evaluating the Feasibility of Using DNA Barcodes in Delineating Subspecies of Cowpea
Infra- and Intra-Specific Diversities
Performances of each of the seven candidate DNA barcode loci was assessed by means of intra- and infra-specific diversity calculated from K2P (Kimura’s two parameters) pairwise distance matrices [12] . The highest intraspecific diversity was reached by rbcL [Table 3] followed by matK and psbL-psbK respectively. However, the lowest intraspecific distance was reported by rpoB [Table 3 and Table 4]. The mean coalescent depth was slightly superior to the average of overall intraspecific distances because it takes into consideration only the highest distance. Results showed the highest mean of intraspecific differences was recorded by rbcL (Table 4).
Three different metrics were used to characterize intra and infra-specific divergence between average of all the pairwise distances between all individuals sampled within the samples and mean theta with theta being the average pairwise distances calculated for each sample and the coalescent depth [Table 3 and Table 4]. To test the applicability of
Table 2. Sequence analysis and PCR amplification performance efficiency of seven candidate plastid DNA regions (atpF-atpH spacer, matK gene, rbcL gene, rpoB gene, rpoC1 gene, psbK-psbI spacer, and trnH-psbA spacer).
Table 3. Measurements of intra- and infra-specific K2P distances matrices for four potential barcode regions, three intergenic spacers and multi locus combinations
Legend: Table 3 above and Table 4 below: The intra-specific and infra-specific genetic divergences were calculated for each DNA barcode. Measures used include: the average pair wise distances between all the sampled within subspecies having a minimum of two representatives; the “mean-theta” where theta is the average pair wise distance computed for each species having more than one representative thus eliminating partiality due to uneven sampling among taxa; and the average coalescent depth which is the depth of a node linking all samples. The aforementioned parameters were deemed important in characterizing infra-specific divergence.
Table 4. Measurements of intra- and infra-specific K2P distances matrices for three potential barcode regions, three intergenic spacers and multi locus combinations
the seven loci at single and multi-loci level for sub-species identification, BLAST1 searches and the nearest genetic distance were used (Table 3 and Table 4). The goal was to identify the most informative single locus candidate
5.3. DNA Barcode Gap Analysis
5.3.1. Single Locus Approach [SLA]
The infra and intraspecific genetic divergence was inferred based on the seven candidate DNA barcode loci at a scale of 0.001 distance units [Figure 1 for single loci and Figure 2 for multiple loci combinations]. The goal was to identify the most informative single locus candidate
5.3.2. Multi Locus Approach [MLA]
Previous studies have raised concerns about SLA in discriminating between closely related organisms [9] ; [12] ; [15] ; [25] ; [26] and [28] . To circumvent this, a multilocus approach (MLA) was employed in delineating infra and intra-specific genetic divergencebetween the samples based on the following multigenic combination matK + atpF-atpH; matK + trnH-psbA; matK + atpF-atpH + psbKpsbI; matK + psbK-psbI; matK + trnH-psbA + atpFatpH and matK + trnH-psbA. Overall, the findings of this study reveal the informativeness of chloroplast genes in delineating the diversity of cowpea at sub-species level and continue to reveal further that MLA is more informative [Tables 3-5]. The superiority of rbcLas a suitable single loci candidate in delineating cowpea variants is demonstrated, and continues to reveal multigenic combinations as being more informative. Two clear peaks appear distinguishable albeit some overlap of intra- and infra-specific distances [Figure 2]. These observations are confirmed by median and Wilcoxon two samples statistical tests differentiating the medians for the former and the medians plus the distributions between the infra- and intra-specific distances for the latter Table 5 and Table 6]. For each distribution, Median and Wilcoxon two sample tests were largely significant which agrees with studies by [12] .
The histograms above give a visual impression of the bar-coding gap for each potential marker. A good marker for DNA bar-coding should have “good” gap and no overlaps between the peaks [12] ; [28] , [38] . However, a marker with overlaps between the extreme peaks is not necessarily a bad candidate for bar-coding. Therefore to test this, a statistical tool was employed to evaluate each of the markers and the different marker combinations as a potential barcode candidate despite the overlaps and issues with the bar-coding gap. The use of the Wilcoxon signed rank tests was specifically due to the fact that our data on the Kimura Two Parameters Pairwise Distances (K2P) do not assume a normal Gaussian distribution as well as sample means did not assume a normal distribution. So instead of testing for the difference between the means we tested for the difference in distribution. Consider the case of matK vs atpF-atpH below; W+ = 25350, W− = 31600, N = 1446, P = 0.0808, matK = atpF-atpH. Looking at the histograms, the marker atpF-atpH seems to be more superior to matK because matK has a lot of overlaps. However upon conducting the Wilcoxon Signed Sum Rank test comparing the data on the two markers, we find that there is no significant difference in the distribution of the datasets within the two markers since P = 0.0808 which is more than the P value threshold at 95% confidence (P = 0.05).
In Table 7 above, a comparison of intra and infraspecific distance medians was explored in order to determine the best barcode marker. In this table, the P value for the median test is the probability that the difference between intra and infraspecific
Table 5. Wilcoxon signed-ranks test for intra-specific pair-distances.
Legend: From the table above, N refers to the total number of pairwise comparisons while W+ is the sum of positive runs for the first column while W− is the sum of negative runs for the second column. The efficiency of one marker, or a combination of markers was evaluated in determining intraspecific distances. Results here indicate that matK >> trnH-psbA [P < 0.0001] while psbK-psbL seems to be a relatively better barcode than matK, P = 0.0092. rbCL is a better barcode than rpoC1 where P < 0.0001. In the multi locus approach, the two combinations matK + psbK-psbL and the three loci combination matK + _psbK-psbL + _atpF-atpH were superior to the 4loci [matK + trnH-psbA + atpF-atpH + psbK-psbL] approach [P < 0.0001] in delineating intraspecific distances. However, the 4loci performed better than the combination matK + trnH-psbA + atpF-atpH, P < 0.0001.
Table 6. Wilcoxon signed rank tests for infra-specific differences among loci.
Legend: From the table above, N refers to the total number of pairwise comparisons while W+ is the sum of positive runs for the first column while W− is the sum of negative runs for the second column. In this table, a comparison of one markervs another marker and or combinations in order to determine which marker is superior to the other. Results here indicate that among single loci matK and trnH-psbA are superior to psbK-psbL [P < 0.0001]. rbcL is superior to rpoB and rpoC1 [P < 0.0001]. Amongst the combinations, the 4 loci [matK + trnH-psbA + atpF-atpH + psbL-psbK] approach was superior to all the other two loci combinations P < 0.0001 except for matK + atpF-atpH [P = 0.0281]. For two loci combinations, matK = trnH-psbA was greater than the combinations matK + atpF-atpH and matK + psbK-psbL. Overall matK, trnH-psbA and rpoB would seem the best marker for determining infraspecific distances.
Table 7. Median and Wilcoxon two sample statistical tests applied to the distributions of intra- and infra-specific K2P distances for each potential DNA barcode. In this case #A refers to the number of pairwise comparisons for intraspecific while #B is the number of pairwise comparisons for infraspecific distances Barcoding gaps were assessed with Median and Wilcoxon Two sample statistical Tests. Wilcoxon test served as a QC for median test. These observations were confirmed by two sample statistical tests differentiating the means for the former and the means plus distributions between the intra and infraspecific distance for the latter.
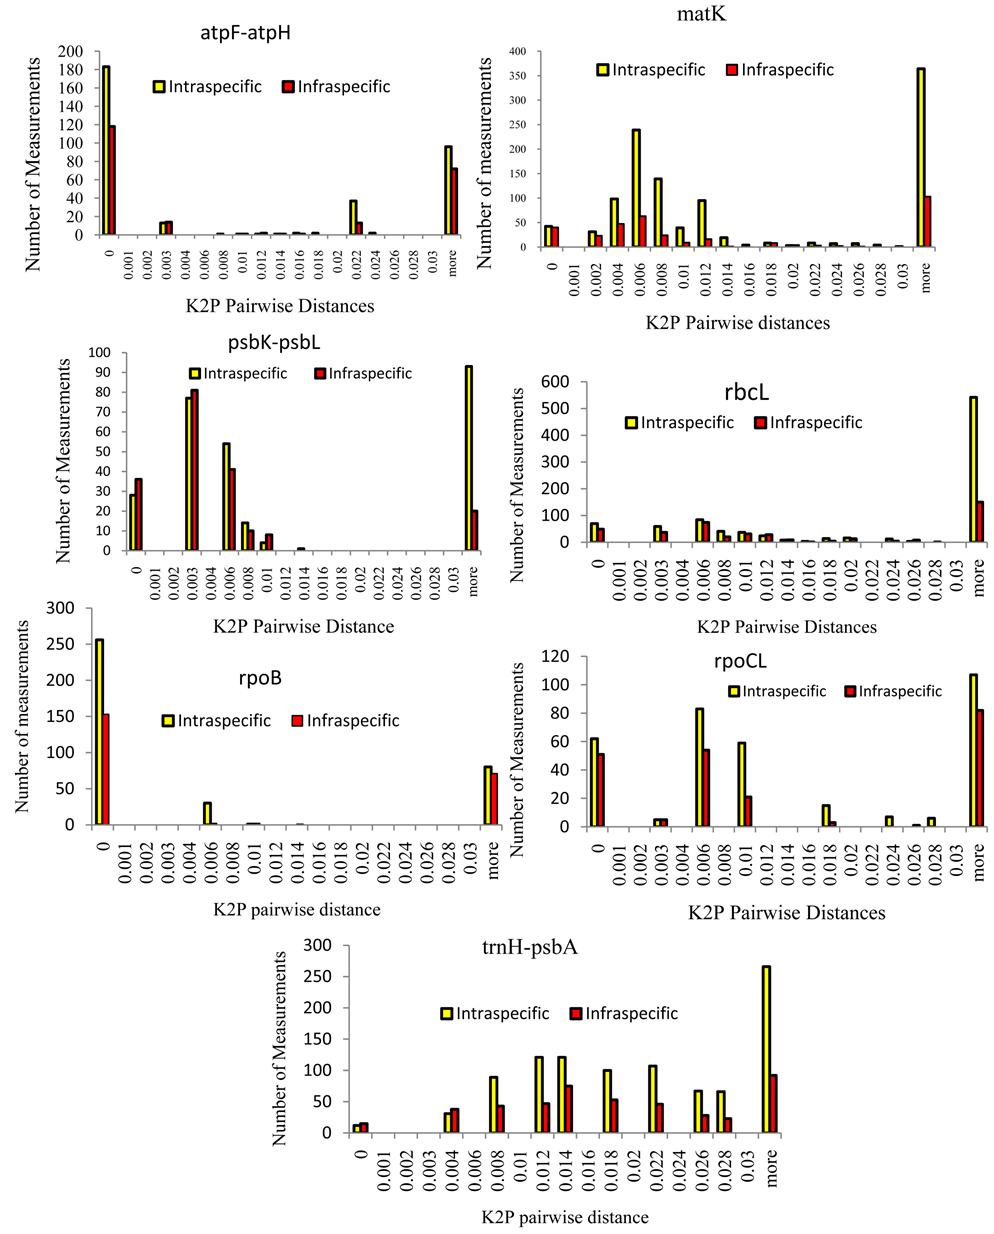
Figure 1. Relative distributions of intraspecific divergence between Vigna unquiculata variants (yellow) and infraspecific distances (red) for seven candidate single loci genes matK, rbcL, rpoB, and rpoC1, and three noncoding spacers (atpF-atpH, trnH-psbA, and psbK- psbL).


Figure 2. Relative distributions of intraspecific divergence between congeneric (yellow) and infraspecific K2P distances (red) for 12different combinations keeping matK for each.
divergence does not occur for example, the P value for matK is 0.0387 signifying a 3.87% type two error rate. Therefore, in determining intra and infra specific distances, matK has an accuracy of more than 95% where P < 0.05. This is confirmed by the Wilcoxon test where P = 1.66−5 which is the type one error rate. Compared to the marker atpF-atpH, the median test P value = 0.8473 signifying an 84.73% error rate with Wilcoxon P value = 0.1523 making it an unsuitable marker for delineating intra and infraspecific distances.
6. Conclusion
This study sought to investigate the plastid sequences in Kenyan cowpea variants looking for the loci that could be used for delineating different phylogeographic groups. Based on the results presented here, the study concludes the best locus combinations for DNA-barcoding of Kenyan cowpea. The evidence presented here clearly demonstrates the overall utility of DNA barcoding in delineating molecular diversity of Kenyan cowpea at sub-species level. The results of this study demonstrate the informativeness of plastid region in delineating intra and infra-specific distances at single loci level; matK, trnH-psbA, psbK-psbL, and rbcL. rbcL and matK distinguish themselves as ideal barcodes at single loci level. However, among the combinations, matK + trnH- psbA, rpoB + atpF-atpH + matK appear to be the best barcodes in delineating genetic distances. The current study however demonstrates that using combinations of DNA barcodes [MLA] improves accuracy of delineation. This study therefore recommends a multi locus approach in delineating cowpea at varietal level.
Acknowledgements
The author acknowledges support of the following persons who contributed in many ways to the success of this study; Wenqin Wang, Shang Sheng, ASARECA.
Conflict of Interest Declaration
The authors declare that there is no conflict of interest regarding the publication of this paper.
Cite this paper
Okoth, P., Muoma, J., Emmanuel, M., Clabe, W., Omayio, D.O. and Angienda, P.O. (2016) The Potential of DNA Barcode-Based Delineation Using Seven Putative Candidate Loci of the Plastid Region in Inferring Molecular Diversity of Cowpea at Sub-Species Level. American Journal of Molecular Biology, 6, 138-158. http://dx.doi.org/10.4236/ajmb.2016.64014
References
- 1. Kress, W.J., Wurdack, K.J., Zimmer, E.A., Weigt, L.A. and Janzen, D.H. (2005) Use of DNA barcodes to identify flowering plants. Proceedings of the National Academy of Sciences of the United States of America, 102, 8369-8374.
http://dx.doi.org/10.1073/pnas.0503123102 - 2. Hollingsworth, P.M., Forrest, L.L., Spouges, J.L., Hajibabaei, M., Ratnasingham, S., van der Bank, M., Chase, M.W., Cowan, R.S., Erickson, D.L., Fazekas, A.J., Graham, S.W., James, K.E., Kim, K.-J., Kress, W.J., Schneider, H., van AlphenStahl, J., Barrett, S.C.H., van den Berg, C., Bogarin, D., Burgess, K.S., Cameron, K.M., Carine, M., Chacón, J., Clark, A., Clarkson, J.J., Conrad, F., Devey, D.S., Ford, C.S., Hedderson, T.A.J., Hollingsworth, M.L., et al. (2009) A DNA Barcode for Land Plants. Proceedings of the National Academy of Sciences of the United States of America, 106, 12794-12797.
http://dx.doi.org/10.1073/pnas.0905845106 - 3. Neuhaus, H. and Link, G. (1987) The Chloroplast tRNALys (UUU) Gene from Mustard (Sinapsis alba) Contains a Class II Intron Potentially Coding for a Maturase-Related Polypeptide. Current Genetics, 11, 251-257.
http://dx.doi.org/10.1007/BF00355398 - 4. Barthet, M.M. and Hilu, K.W. (2007) Expression of matK: Functional and Evolutionary Implications. American Journal of Botany, 94, 1402-1412.
http://dx.doi.org/10.3732/ajb.94.8.1402 - 5. Mu¨ller, K.F., Borsch, T. and Hilu, K.W. (2006) Phylogenetic Utility of Rapidly Evolving DNA at High Taxonomical Levels: Contrasting matK, trnT-F and rbcL in Basal Angiosperms. Molecular Phylogenetics and Evolution, 41, 99-117.
http://dx.doi.org/10.1016/j.ympev.2006.06.017 - 6. Babbar, S.B., Raghuvanshi, S., Singh, H.K., Parveen, I. and Malik, S. (2012) An Overview of the DNA Barcoding of Plants. Phytomorphology, 62, 69-99.
- 7. Cameron, K.M. (2005) Leave It to the Leaves: A Molecular Phylogenetic Study of Malaxideae (Orchidaceae). American Journal of Botany, 92, 1025-1032.
http://dx.doi.org/10.3732/ajb.92.6.1025 - 8. Min, X.J. and Hickey, D.A. (2007) Assessing the Effect of Varying Sequence Length on DNA Barcoding of Fungi. Molecular Ecology Notes, 7, 365-373.
http://dx.doi.org/10.1111/j.1471-8286.2007.01698.x - 9. CBOL Plant Working Group (2009) A DNA Barcode for Land Plants. Proceedings of the National Academy of Sciences of the United States of America, 106, 12794-12797.
http://dx.doi.org/10.1073/pnas.0905845106 - 10. Chen, S., Yao, H., Han, J., Liu, C., Song, J., Shi, L., Zhu, Y., Ma, X., Gao, T., Pang, X., Luo, K., Li, Y., Li, X., Jia, X., Lin, Y. and Leon, C. (2010) Validation of the ITS2 Region as a Novel DNA Barcode for Identifying Medicinal Plant Species. PLoS ONE, 5, e8613.
http://dx.doi.org/10.1371/journal.pone.0008613 - 11. Fazekas, A.J., Burgess, K.S., Kesanakurti, P.R., Graham, S.W., Newmaster, S.G., Husband, B.C., et al. (2008) Multiple Multilocus DNA Barcodes from the Plastid Genome Discriminate Plant Species Equally Well. PLoS ONE, 3, e2802.
http://dx.doi.org/10.1371/journal.pone.0002802 - 12. Lahaye, R., Van Der Bank, M., Bogarin, D., Warner, J., Pupulin, F., Gigot, G., Maurin, O., Duthoit, S., Barraclough, T.G. and Savolainen, V. (2008) DNA Barcoding the Floras of Biodiversity Hotspots. Proceedings of the National Academy of Sciences of the United States of America, 105, 2923-2928.
http://dx.doi.org/10.1073/pnas.0709936105 - 13. Blaxter, M.L. (2004) The Promise of DNA Taxonomy. Philosophical Transactions of the Royal Society of London Series B: Biological Sciences, 359, 669-679.
http://dx.doi.org/10.1098/rstb.2003.1447 - 14. Shaw, J., Lickey, E.B., Schilling, E.E. and Small, R.L. (2007) Comparison of Whole Chloroplast Genome Sequences to Choose Noncoding Regions for Phylogenetic Studies in Angiosperms: The Tortoise and the Hare III. American Journal of Botany, 94, 275-288.
http://dx.doi.org/10.3732/ajb.94.3.275 - 15. Kress, W.J. and Erickson, D.L. (2007) A Two-Locus Global DNA Barcode for Land Plants: The Coding rbcL Gene Complements the Non-Coding trnH-psbA Spacer Region. PLoS ONE, 2, e508.
http://dx.doi.org/10.1371/journal.pone.0000508 - 16. Shaw, J. and Small, R.L. (2005) Chloroplast DNA Phylogeny and Phylogeography of the North American Plums (Prunus Subgenus Prunus Section Prunocerasus, Rosaceae). American Journal of Botany, 92, 2011-2030.
http://dx.doi.org/10.3732/ajb.92.12.2011 - 17. Chang (2006) The Chloroplast Genome of Phalaenopsis aphrodite (Orchidaceae): Comparative Analysis of Evolutionary Rate with That of Grasses and Its Phylogenetic Implications. Molecular Biology and Evolution, 23, 279-291.
http://dx.doi.org/10.1093/molbev/msj029 - 18. Whitlock, B.A., Hale, A.M. and Groff, P.A. (2010) Intraspecific Inversions Pose a Challenge for the trnH-psbA Plant DNA Barcode. PLoS ONE, 5, e11533.
http://dx.doi.org/10.1371/journal.pone.0011533 - 19. Nicolalde-Morejón, F., Vergara-Silva, F., González-Astorga, J., Stevenson, D.W., Vovides, A.P., et al. (2010) A Character-Based Approach in the Mexican Cycads Supports Diverse Multigene Combinations for DNA Barcoding. Cladistics, 26, 1-15.
- 20. Wang, W., Wu, Y., Yan, Y., Ermakova, M., Kerstetter, R. and Messing, J. (2010) DNA Barcoding of the Lemnaceae, a Family of Aquatic Monocots. BMC Plant Biology, 10, 205.
http://www.biomedcentral.com/1471-2229/10/205-BMC Plant Biology 10:205
http://dx.doi.org/10.1186/1471-2229-10-205 - 21. Chase, M.W., Cowan, R.S., Hollingsworth, P.M., van den Berg, C., Madrinan, S., Petersen, G., Seberg, O., Jorgsensen, T., Cameron, K.M., Carine, M., Pedersen, N., Hedderson, T.A.J., Conrad, F., Salazar, G.A., Richardson, J.E., Hollingsworth, M.L., Barraclough, T.G., Kelly, L. and Wilkinson, M. (2007) A Proposal for a Standardised Protocol to Barcode All Land Plants. Taxon, 56, 295-299.
- 22. Sass, C., Little, D.P., Stevenson, D.W. and Specht, C.D. (2007) DNA Barcoding in the Cycadales: Testing the Potential of Proposed Barcoding Markers for Species Identification of Cycads. PLoS ONE, 2, e1154.
http://dx.doi.org/10.1371/journal.pone.0001154 - 23. Kress, W.J., Wurdack, K.J., Zimmer, E.A., Weigt, L.A. and Janzen, D.H. (2005) Use of DNA Barcodes to Identify Flowering Plants. Proceedings of the National Academy of Sciences of the United States of America, 102, 8369-8374.
http://dx.doi.org/10.1073/pnas.0503123102 - 24. Newmaster, S.G., Fazekas, A.J. and Ragupathy, S. (2006) DNA Barcoding in Land Plants: Evaluation of rbcL in a Multigene Tiered Approach. Canadian Journal of Botany, 84, 335-341.
http://dx.doi.org/10.1139/b06-047 - 25. Chase, M.W., Cowan, R.S., Hollingsworth, P.M., van den Berg, C., Madrinan, S., Petersen, G. and Fay, M. (2009) Barcoding of Plants and Fungi. Science, 325, 682-683.
http://dx.doi.org/10.1126/science.1176906 - 26. Erickson, D.L., Spouge, J., Resch, A., Weigt, L.A. and Kress, J.W. (2008) DNA Barcoding in Land Plants: Developing Standards to Quantify and Maximize Success. Taxon, 57, 1304-1316.
- 27. Kane, N.C. and Cronk, Q. (2008) Botany without Borders: Barcoding in Focus. Molecular Ecology, 17, 5175-5176.
http://dx.doi.org/10.1111/j.1365-294X.2008.03972.x - 28. Hebert, P.D.N., Stoeckle, M.Y., Zemlak, T.S. and Francis, C.M. (2004) Identification of Birds through DNA Barcodes. PLoS Biology, 2, e312.
http://dx.doi.org/10.1371/journal.pbio.0020312 - 29. Pennisi, E. (2007) Tax-onomy. Wanted: A Barcode for Plants. Science, 318, 190-191.
http://dx.doi.org/10.1126/science.318.5848.190 - 30. Kane, N., Sveinsson, S., Dempewolf, H., Yang, J.Y., Zhang, D., Engels, J.M.M. and Cronk, Q. (2012) Ultra-Barcoding in Cacao (Theobroma spp., Malvaceae) Using Whole Chloroplast Genomes and Nuclear Ribosomal DNA. American Journal of Botany, 99, 320-329.
http://dx.doi.org/10.3732/ajb.1100570 - 31. Hebert, P.D.N., Cywinska, A., Ball, S.L. and de Waard, J.R. (2003) Biological Identifications through DNA Barcodes. Proceedings of the Royal Society B: Biological Sciences, 270, 313-321. http://dx.doi.org/10.1098/rspb.2002.2218
- 32. Yang, J.B., Tang, M., Li, H.T., Zhang, Z.R. and Li, D.Z. (2013) Complete Chloroplast Genome of the Genus Cymbidium: Lights into the Species Identification Phylogenetic Implications and Population Genetic Analyses. BMC Evolutionary Biology, 13, 84.
http://dx.doi.org/10.1186/1471-2148-13-84 - 33. Nock, C.J., Waters, D.L., Edwards, M.A., Bowen, S.G., Rice, N., Cordeiro, G.M. and Henry, R.J. (2011) Chloroplast Genome Sequences from Total DNA for Plant Identification. Plant Biotechnology Journal, 9, 328-333.
http://dx.doi.org/10.1111/j.1467-7652.2010.00558.x - 34. Sucher, N.J. and Carles, M.C. (2008) Genome-Based Approaches to the Authentication of Medicinal Plants. Planta Medica, 74, 603-623.
http://dx.doi.org/10.1055/s-2008-1074517 - 35. Brinkman, F.S.L. (2001) Phylogenetic Analysis. In: Baxevanis, A.D. and Francis Ouellette, B.F., Eds., Bioinformatics: A Practical Guide to the Analysis of Genes and Proteins, John Wiley & Sons Ltd., Vancouver, Vol. 2, 323-358.
http://dx.doi.org/10.1002/0471223921.ch14 - 36. Collins, R.A., Boykin, L.M., Cruickshank, R.H. and Armstrong, K.F. (2012) Barcoding’s Next Top Model?: An Evaluation of Nucleotide Substitution Models for Specimen Identification. Methods in Ecology and Evolution, 3, 457-465.
http://dx.doi.org/10.1111/j.2041-210X.2011.00176.x - 37. Whitley, E. and Ball, J. (2002) Statistics Review 6?: Nonparametric Methods. Critical Care, 6, 509-513.
http://dx.doi.org/10.1186/cc1820 - 38. Meyer, C.P. and Paulay, G. (2005) DNA Barcoding: Error Rates Based on Comprehensive Sampling. PLoS Biology, 3, 2229-2238.
http://dx.doi.org/10.1371/journal.pbio.0030422