Open Journal of Applied Sciences
Vol.3 No.1(2013), Article ID:29536,13 pages DOI:10.4236/ojapps.2013.31018
Laser Raman Spectroscopic Studies on Hemeproteins in Epileptic Children
Department of Physics, Medical Physics Research Laboratory, D. A. V. (P. G.) College, Muzaffarnagar, India
Email: *sanjeev1962kumar@yahoo.co.in, *sanjeev1962kumar@rediffmail.com
Received October 2, 2012; revised November 4, 2012; accepted November 11, 2012
Keywords: Hemoproteins; Hemoglobin; Laser Raman Bands
ABSTRACT
Laser Raman spectroscopic studies were carried out on hemoproteins with special reference to epilepsy and compared the data with those of controls. Some of the bands were found approximately at 368.45 cm−1, 424.90 cm−1, 625.27 cm−1 and 807.38 cm−1 in case of normal children and at 1749.00 cm−1, 1795 cm−1 and 2000 cm−1 in epileptic children cases. A clear cut picture of the hemoproteins has already given in the literature and very interesting bands were found in the range from 300 cm−1 to 1800 cm−1. Our Raman lines are very effective and peculiar. We did not say anything about the detailing of these bands at this juncture.
1. Introduction
When a beam of light is passed through a transparent substance, a small amount of the radiation energy is scattered, the scattering persisting even if all dust particles or other extraneous matter are excluded rigorously from the substance. If we use a monochromatic radiation, or radiation of a very narrow frequency band is used, the scattered energy will consist almost entirely of radiation of the incident frequency is called Rayleigh scattering. We have also found in addition certain discrete frequencies above and below the incident beam, which will be scattered [1].
Raman spectroscopy is named after the Indian scientist Sir C. V. Raman. Raman and Krishnan [2] have worked jointly together and observed that some of the light scattered by a liquid is changed in wavelength. That portion of light, which undergoes a change in wavelength is called Raman scattered light. The basic phenomenon of Raman scattering seems between inelastic collision of molecules composing the liquid and photons.
These photons are the particles composing the beam of light. We would like to define inelastic collision at this stage. An inelastic collision termed as there is an exchange of energy between the photon and molecule with a consequent change in energy. Due to this change in energy a change in wavelength of photon is found. This basic mechanism is shown in Figure 1.
The total energy is conserved during the scattering process. The gain in energy or lost by the photon must be equal to an energy change within the molecule. If we are able to measure the gain in energy or lost by the photon by any means, we can probe changes in molecular energy. The changes in energy of the molecule are called transitions between molecular energy levels. Raman spectroscopy is concerned with vibrational energy level transitions of the molecule. Raman spectrum is called a vibrational spectrum of a molecule also.
The vibrational spectrum is a sensitive indicator of chemical or biochemical properties. It reflects the disposition of atomic nuclei and chemical bonds within a molecule and the interaction between the molecule and its immediate environment.
Raman and Krishnan used a beam of focused and filtered sunlight in their original experiment of Raman scattering. A schematic representation is shown in Figure 2.
A beam of monochromatic laser of wavelength  is focused into the sample. It produces a high photon density. The resulting scattered light is analyzed for the wavelength and intensity. Raman effect is too much weak and only a minute proportion of the incident photon became Raman photons of wavelength
  etc.
etc.
Introductory Theoretical Details
Tobin, M.C. [3] has supplied some of the useful informations about the detailed knowledge with mathematical formulation of Raman scattering.
If a molecule is placed in an electromagnetic field (E.M. field) has its charge distribution. This distribution is periodically disturbed by the field. The resultant in-
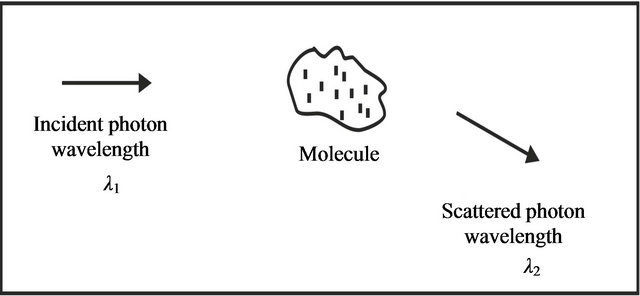
Figure 1. An inelastic collision between a photon and a molecule.

Figure 2. Schematic diagram of Raman experiment.
duced alternating dipole moment acts as a source of radiation and gives rise to the entire class of light scattering phenomenon.
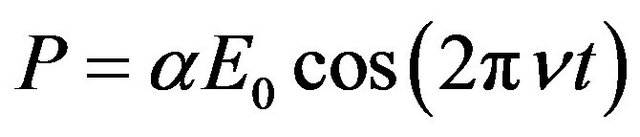
The alternating dipole moment is generally expressed as the dipole moment per unit volume, the polarization.
The polarization is proportional to the inducing field
 (1)
(1)
The constant  is called polarizability. The inducing electromagnetic field is given by
 (2)
(2)
Using Equations (2) and (1), we get
 (3)
(3)
The polarizability  consists of two parts as the first part is a constant,
  , which represents the static polarizability. The second part is the some of terms having the periodic terms time dependence of the normal frequencies of the system under consideration.
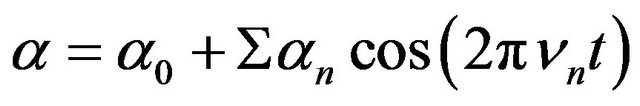 (4)
(4)
The normal frequencies  may be rotational or vibrational frequencies of a molecule, lattice frequencies of a crystal or even, in Brillouin scattering, acoustic frequencies of a solid. Using Equations (1) and (4) has a form.
 (5)
(5)
Equation (5) predicts the major qualitative features of the Raman effect. First term represents the component of the polarization having the frequency of the exciting field. This is called Rayleigh scattering.
Second term has variable component of , which gives components of the polarization of frequencies
  and
and . These accounts for the stokes and antistockes Raman bands.
 (6)
(6)
Here  are the components of polarizability tensor.
We may write Equation (6) in matrix notation as
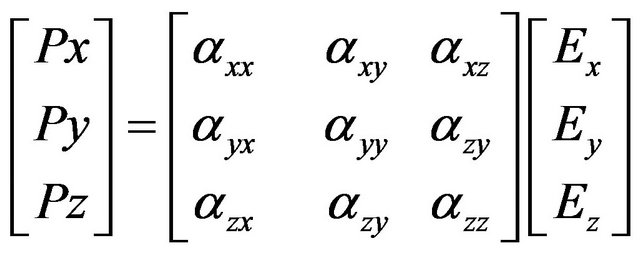 (7)
(7)
If we introduce a coordinate system, the relation of E and P has a property of tensor. There are independent of the Coordinate system. The components of P, and E may change.
The energy scattered per unit time is given according electromagnetic theory
 (8)
(8)
Scattered radiation is predicted to contain frequency components at .
.
The quantum mechanical description of Raman effect starts from a detailed analysis of dipole moment associated with transitions between two states a and b. A molecule is perturbed by an E.M. field of frequency .
.
 (9)
(9)
We may define 
Now
 (10)
(10)
The energy radiated per second by a system in an E.M. field into a Raman transition is given by
 (11)
(11)
 describes a Raman effect.
2. Intensities and Scattering Cross Sections of Raman Experiment
If a single molecule is placed in a beam of monochromatic light of flux density
 .
.
A detector is attached to record the solid angle. Scattered power is given by
 (12)
(12)
Here, we have  is the total scattering cross section, N is the number of molecules illuminated.
The total scattered power is given by the relation.
 (13)
(13)
If P is number of molecules per cm3, A is Cross sectional area of the illuminated volume cm2,  is length of the illuminated volume cm. We have few relations as
 (14)
(14)
and
 (15)
(15)
Equation (15) shows total power of the incident beam. This Equation is simply Beer’s Law.
Now a Raman band extends over a range of frequentcies so that we can define a differential cross scattering section.
 (16)
(16)
or
 (17)
(17)
Now angular dependence of scattering into account
 (18)
(18)
or
 (19)
(19)
Here  is an element of solid angle.
The ratio of antistokes to stokes intensities is given by
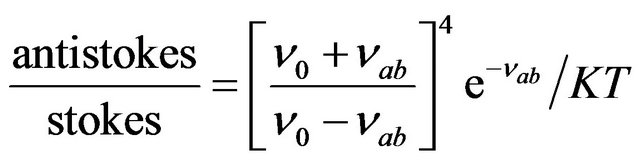 (20)
(20)
Here  is the frequency of Raman shift.
3. Review of the Literature
Raman spectra can be used to elicit some informations on excited lifetime in heme proteins. Spiro, T.G. et al. [4] have covered all the possibilities related to heme proteins in detail with an exclusive well defined approach. Adar, F. et al. [5] have studied Raman intensities in ferrocytochrome b5, ferricytochrome b5, oxyhemoglobin, deoxyhemoglobin and methemoglobin. They have also measured the decay times.
It was found in the range (3 - 100) × 10−5 sec.
Friedman, J.M. et al. [6] have also studied the excited state life time in cytochrome C. They have pointed out that the life time in cytocrome C is longer than cytocrome b5. The relaxation of the 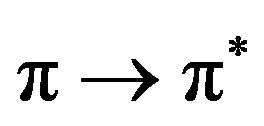 excited state of the porphyrin ring in cytochrome b5 was found quite different in both the X and Y axis of Cartesian coordinate system.
Strekas, T.C. et al. [7,8] have studied cytochrome C and hemoglobin using Raman spectroscopy. Brunner, H. et al. [9] have also studied hemoglobin and developed an interest in this spectroscopy for biomolecule aspects.
Spiro, T.G. et al. [10] have studied this spectroscopy for additional impetus on inverse polarization. Raman spectroscopy is also used to study hemes in healthy and diseased red blood cells.
Wood, B.R. et al. [11] have applied this technique to study single red blood cell in vivo to record the spectra under physiological conditions. The study confirms the functional erythrocytes using 488 nm, 514 nm, 568 nm and 633 nm excitation.
Fabian, H. et al. [12] have reviewed and given new developments in Raman spectroscopy of biological systems. It has been written some where that heme proteins are coloured due to this feature they absorb visible light.
Spiro, T.G. [13] has also provided review on this issue in detail. We would like to add here that the function of heme proteins is consider to transport the molecular oxygen (the globins) or to transport the electrons (cytochromes) or to act as the enzymes ,i.e to catalyze chemical reactions (cytochromes P-450, peroxydase, catalases ). Active sites of heme proteins contain hemes, which are derivatives of porphyrine. Spectra of porphyrine and hemes are very well known and given by some of the authors [14-16]. Many authors [13,17,18] have studied the positions of some of the definite bands, which are known to reflect geometry of the heme ,heme iron coordination, spin and oxidation states. There was a definite uncertainity in the assignment of the ligand-heme iron atom vibrations. The heme-iron-imidazole nitrogen, which was originated from histidine mode of bonding is the most common in globins and in cytochromes of b type. Some of the authors [19,20] have predicted and accepted that this band vibrates at 210 - 290 cm−1. Anzenbacher, P. et al. [21] have studied the nature of the fifth ligand of heme iron appeared to be crucial for understanding the mechanism of action oxygen activation and of activation of peroxides in heme enzymes. The heme enzymes posses same prosthetic group as the globins (oxygen carrier hemoglobin and myoglobin) or the cytochromes (transporting of the electrons), are able to activate the Fe-O-O moiety for chemical reactions as hydroxylations or splitting of peroxides. Some of the authors [22-25] have studied the strong electron donating effect of the heme iron fifth ligand, which is known as thiolate sulfer in cytochromes P-450, ionized histidine in peroxidases and ionized tyrosine in calalases ,which is necessary for the reactions of heme enzymes.
Hu, S. et al. [26,27] have studied a weakening of the Fe-O and O-O bonds for cytochrome P-450 and peroxidase. A splitting of the Fe-O-O band and formation of the products were also seen. For the rest of hemoproteins, including the globins, or cytochromes. Some of the researchers [28,29] expected that the weaker the Fe-sixth ligand bond ,the stronger is the internal bond of the sixth ligand e.g. O-O and C-O. The heme enzymes apparently an exception as the Fe-O bond as well as the O-O bond must be broken during the enzyme reaction.
Bangcharoenpaurpone, O. et al. [30] have also argued about the importance of determination of the nature of the fifth heme iron ligand and it was confirmed with chloroperoxidase. This exhibits similar properties to cytochrome P-450. Resonance Raman spectrum have shown it is the thiolate sulfur. The fifth heme iron-ligand bond plays a key role in modulating the affinity of molecular oxygen to the hemoglobin molecule.
Matsukawa, S. et al. [31] have presented a continuous strain model, which relates the oxygen affinity to the strain imposed by the protein to the Fe-N histidine band. Wells, A.V. et al. [32] have examined iron-histidine modes in globin. It has been found that at least one further vibration at about 250 cm−1 is affected by isotropic substitution. An interaction between the heme and histidine and also the difference in the heme, his geometries play a key role in determining the Raman activity of these modes. The sixth ligand of the heme iron is under physiological conditions often the oxygen atom. This is the case of globins, where the molecular oxygen is transported being bound (as the sixth ligand) to the heme iron. It may be bound to the heme enzymes. Proniewicz, L.M. et al. [33] have found Fe-O vibrations in some of the model compounds such as cobalt porphyrins. Mizutani, Y. et al. [34] and Oertling, W.A. et al. [35] have examined ferrous porphyrins with the aim to understand the properties of the heme iron-oxy (Fe-O2) and hemeferryl (Fe=O) structures. There are appeared as the biproduct of enzymes. The position of Fe=O vibration reflects the properties of the heme. It has been established that the penta coordinated system [36,37] in which the heme iron is bound to heme pyrrols and than to one atom of oxygen only exhibit the highest values of Fe=O vibration. It shows strongest Fe-O band. The presence of the secondary iron axial ligand under the hemeplane tries to weak this band. If the axial ligand is strongest the Fe=O band will be weaker. Hashimoto, S. et al. [36] and Anzenbacner P. et al. [37] have shown Fe=O vibraton is found lower. Several authers [38-40] have studied the spectra of reaction intermediates of cytochrome C oxidases or of peroxidases, which was found at about 760 cm−1 - 780 cm−1. Babcock, G.T. et al. [41] have shown the spectra of myoglobin at 797 cm−1 Sitter, A.T. et al. [42] have studied the spectra of N-methylimidazole (heme) Fe=O compound at 820 cm−1. It has been assumed that the heme enzymes, weaker Fe=O bond, which reflect strong fifth ligand-iron bond. Cytochrome oxidase is most complicated. It comprises two hemes of the types and at least two copper atoms per heme. Varotis, C. et al. [43] have studied Raman spectroscopy and verified the existence of primary oxy intermediate. Some of the authors [38,44,45] have studied Raman spectral data for the presence of ferryl [Fe (IV = 0)] species. Han, S. et al. [46] given assignment of formyl C=O vibration. Ray, G.B. et al. [47] have studied the presence of a low spin-high spin eqilibria in the oxidase heme. Paula, J.C. et al. [48] have studied protein environment is both hemes. It is easily can be stated that cytochrome C may be an example of cytochromes. It works as heme proteins transporting electrons.
Hildebrandt, P. et al. [49,50] have applied Raman spectroscopy to study the conformation of heme protein. Hildebrandt, P. et al. [51] have studied changes of heme protein upon interaction with other proteins as cytochrome C oxidase Hildebrandt, P. et al. [52] have studied cytochrome C peroxidase also with the help of Raman spectroscopy.
A selective structural probe of the prosthetic group of hemoproteins can be studied by this technique. The vibrational normal modes of the heme can be observed in aqueous solution at high dilution without interference of the modes of the protein.
It has been seen that if the excitation occurs in the Q bands region, porphyrin in-plane skeletal modes may be received on enhancement. Spiro T.G. et al. [53] have shown that the vibrations of a bound ligand may be enhanced via resonance with a charge transfer transition. Heme geometry and the nature of the excited electronic state via excitation profiles have also studied.
The investigations of hemoproteins, which were made earlier to find structural correlations among different derivatives Bruner, et al. [9] have suggested that the polarized Raman line at 1370 cm−1 could be correlated with the out-of plane movement of the iron atom because it shifts from 1378 cm−1 to 1355 cm−1 between in-plane oxy and out-of-plane deoxyhemoglobin. A contradictory statement is found in the study related to Fe(III) horse radish peroxidase (high spin, out-of-plane), Fe(II) cytochrome C (low spin, in-plane) and Fe(III) octaethyloporphyrin chloride (high spin, out-of-plane), which were appeared at 1375 cm−1, 1362 cm−1 and 1376 cm−1 respectively, which were reported by Spaulding, L.D. et al. [54]. The polarized line at 1370 cm−1 has been considered by so many investigatiors [55-57] as an oxidation state marker.
It has been supported by the researchers that the frequency for ferric hemoproteins (1370 cm−1 to 1380 cm−1) is higher than the ferrous states i.e. 1355 cm−1 to 1365 cm−1. It was suggested by [55,56] that oxy hemoglobin contained an Fe(III) (low spin) O2 complexes. It has been seen that perhaps the polarized line at 1370 cm−1 indicates the extent of π back donation, but not the total charge on the iron [54]. Ogoshi, H. et al. [58] have analysed the metalloporphyrins was confined to infrared active modes. The informations, received by this study does not help in correlating the data with Raman spectral data of hemopreteins.
Felton, R.H. et al. [59] have provided a comparative Raman spectral data of oxidized hydro-peroxidases (horseradish peroxidase, horse blood catalyse, and cytochrome C peroxidases. The ap line found at 1587 cm−1 to 1950 cm−1 region. It indicates in plane iron. Rousseau, D.L. et al. [60] have studied resonance Raman spectra of heme in leghemoglobin. Leghemoglobin is a monomeric oxygen binding hemoprotein isolated from root modules of legumes. The porphyrin modes in Raman spectrum may show a sensitivity towards the heme electron density, spin state of the central iron atom and the size of the porphyrin core. Resonance Raman scattering has also been applied to the differentiation of different hemoproteins.
Yu, N.T. et al. [61] have studied resonance Raman spectroscopy of heme proteins and extended this approach to cytochrome C and hemoglobin. They have applied this technique in Soret and Q regions of band. It has neen reported in the article that the Soret-excited Raman spectrum of oxy hemoglobin can be obtained without photodissociation. They have intensity 41 weak Raman lines below 85 cm−1 in the ferrocytochrome C spectrum.
Polomska, M. et al. [62] have given stress on Fourier transform near infrared Raman spectroscopy on connective tissue studies. They have measured major bands associated with vibrational modes of collagen and elastien and found amide I band at 1665 cm−1 amide II band at 1255 cm−1 and CH3 stretching symmetric vibration at 2936 cm−1. Raman studies of vein walls normal and vericose have also been made and found that phospholipids vibrations appear at 1065 cm−1 and 1097 cm−1 respectively.
Kitazawa, T. et al. [63] have studied Resonance Raman Scattering from hemoprotein. They have also pointed out the effects of ligands upon Raman spectra of different C-type cytochrome. It was found that a Raman line sensitive to a replacement of an axial ligand of heme iron at 1540 cm−1 for ferrous alkylated cytochrom C.
Bocian, D.F. et al. [64] have studied resonance Raman spectra of cytochrome C oxidase. They have provided excitation in the 600 nm region. They have observed few bands, which are associated with two heme A moieties in the enzyme.
Ye, X. et al. [65] have applied Raman spectroscopy to the heme protein. They have investigated the flow of photo excitation energy in biomolecules. The transient absorption spectra of different oxidation and ligation states of myoglobin display an initially broad and red-shifted photoproduct absorption spectrum. They have also reported a vibrational relaxation path also through the vander walls contacts at the heme periphery was more important than through the single Fe—His covalent bond between heme and proteins matrix.
Tu, A.T. [66] studied the use of Raman spectroscopy in biological compounds such as gallstones, kidney stones, cystine type gallstone, uric acid type kidney stone and calcium oxalate type kidney stones. It was also reported that monohydrate calcium oxalate has a clear cut double peaks at 1492 cm−1 and 1465 cm−1. Dehydrate calcium oxalate has shown a peak at 1477 cm−1. The kidney stone has two peaks at 898 cm−1 and 912 cm−1. Kidney stone is a mixture of mono and dehydrates of calcium oxalate.
Bangacharoenpaurpong, O. et al. [67] have studied resonance Raman findings for myoglobin and hemoglobin. They have reported that a coupling strength for Fe-N. His vibration of myoglobin was many times larger than the heme vibrational modes coupled to the  transitions of heme group.
Verma, A.L. et al. [68] have studied metalloporphyrins by using this technique of spectroscopy. They have mentioned in their article porphyrins and metalloporphyrins are very important for physioal and chemical interest. These have a different and curicial role in many biological reactions. Porphyrins and metalloporphyrins can serve as catalytic sites and control the reactivity of heme related enzymes.
Friedman, J.M. et al. [69] have studied time resolved resonance Raman studies of hemoglobin and mentioned in the article as the binding of small molecular ligands to the hemes in hemoglobin was a highly localized perturbbation. It can initiate a sequence of propagating structural events that culminates in a change in quaternary structure.
Callahan, P.H. et al. [70] have applied this technique to study heme structure from Soret excitation. They have made a correlation between the observed frequency of a polarized mode in 1560 cm−1 to 1600 cm−1 region and the heme iron spin and coordination geometry.
Stein, P. et al. [71] have studied the structural interpretation of heme protein resonance Raman frequencies with preliminary normal coordinate analysis. They have pointed out the low spin hemes are planar but high spin hems has iorn atom outside the plane. They have measured three Raman bands at 1640 cm−1, 1580 cm−1 and 1500 cm−1.
Spaulding, L.D. et al. [72] have applied resonance Raman spectroscopy in studing the metalloctaethyloporphyrins. They have demonstrated an empirical correlation between 1590 cm−1 frequency and distance from the centre of the porphyrin core to the pyrole nitrogen atoms.
Spiro, T.G. [73] has used this spectroscopy as a new structuere probe for biological chromophores. Author reported that heme protein has an iron porphyrin chromophore. Raman spectra were found to be dominated by the porphyrin vibrational modes, which are enhanced by resonance with the allowed electronic transition in the visible and near ultravidet region.
These are  transitions which are polarized in the porphyrin plance. The strong Raman bands are found in the region form 1000 cm−1 to 1700 cm−1. This region is suitable for in-plane stretching vibrations of the ring. A typical structure of heme protein is shown in Figure 3.
Bulkin, B.J. [74] has applied this spectroscopy to study human erythrocyte membranes. He has shown that Raman spectrum of a suspension of erythrocyte membrance was found in the range of frequency as 1000 cm−1 to 1500 cm−1. It has been examined and found of four Raman lines at 1110 cm−1, 1340 cm−1, 1420 cm−1 and 1445 cm−1. He has also reported that these bands were attributed to the hydrocarbon chains of fatty acids, with a small. Contribution from CH2 groups of cholesterol. The Raman spectrum at 1100 cm−1 is a good diagnostic for fluidity of fatty acid chains in phospholipids.
Shelnutt, J.A. et al. [75] have studied protein heme interaction in hemoglobin and reported that the heme protein Ramn spectra obtained due to resonance enhancement with visible excitation frequencies contains only
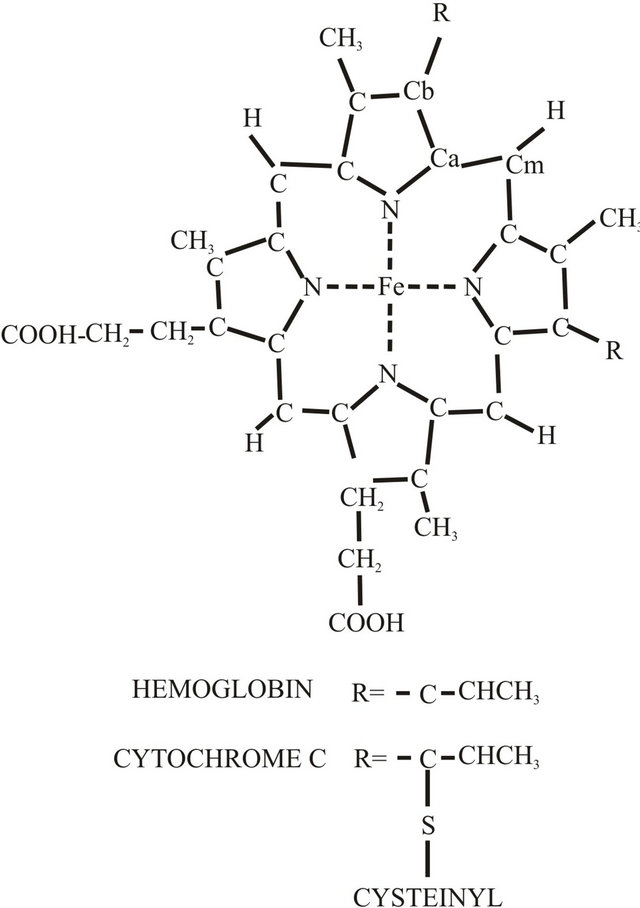
Figure 3. Structure of heme shows pyrrole substituents which occur in hemoglobin and cytochrome C.
those vibrational modes associated with the porphyrin macrocycle.
Tomkova, A. et al. [76] have studied cytochrome C, with help of Raman spectroscopy. Cytochrome C is hemoprotein, which acts as an electron carrier in the mitochondrial respiratory chain. It prosthetic group i.e. heme is covalently attached to the polypeptide chain through thio ether linkage with two cysteine residues, cyst-14 and cys-17. They have reported that Raman spectra of cyst C with thiols, bands at 1616 cm−1 and 1632 cm−1 were assigned to normal vibration in acidic and neutral form of heme C molecules.
Wood, B.R. et al. [77,78] have applied this technique to monitor cellular respiration and red cell hemoproteins. It has been found and measured some of the bands for sickle cell spectrum as 1398 cm−1, 1366 cm−1, 1250 cm−1 and 972 cm−1. Sickle cell disease is caused by a mutant form (B6 glu Val) of hemoglobin.
Burner, H. et al. [79] have studied hemoglobin with the resonance Raman scattering. They have studied oxy, deoxy, met, and cyanomethaemoglobin and found prominent bands in the range 300 cm−1 to 1700 cm−1. They have also tried chlorohaemin and found few Raman lines in the region below 500 cm−1. It was due to Fe-N, vibration. Raman lines at 572 cm−1 corresponds to vibration of the ligand against the iron.
Wood, B.R. et al. [80] have studied resonance Raman spectroscopy for red blood cells and point out that the enhancement of a band at 567 cm−1 in the spectra of oxygenated cells was also observed. This band was as- signed to the Fe-O(II) stretching mode. The band, which was appeared at 419 cm−1 was also assigned to Fe-O-O bending mode.
Mishra, S. et al. [81] have applied this spectroscopy to leprology, neurology, bacteriology and traumatology and reported their main findings as four Raman lines were found at 1110 cm−1, 1340 cm−1, 1410 cm−1 and 1445 cm−1. These lines may have contributions from CH2 group of cholesterol.
Ramser, K. et al. [82] have studied the combination of resonance Raman spectroscopy, optical tweezers and microfluidic system applied to the study of various heme containing a single cell and developed a method and tested on several globin containing cells hemoglobin within single red blood cells.
Sikirzhytski, V. et al. [83] have applied Raman spectroscopy to the body fluids with special reference to forensic study for determining the traces of semen, blood, saliva, sweat and vaginal fluid. They have also expanded this technique to include mixtures of body fluids. It is very easy to differentiate body fluid traces of human and animal origins for the forensic point of view.
Yu, N.T. et al. [61] have applied this technique to heme proteins and they have reported finding related to hemoglobin and cytochrome also. They have also detected weak lines below 850 cm−1 in ferro cytochrome C. Soret excited Raman spectrum of oxyhemoglobin can be obtained with the help of laser Raman spectroscopy. The weaker O-O intensity was reported for cytchrome C with the application of strong O-O Raman intensity.
Ozaki, V. [84] has studied this spectroscopy in the field of medical application. Different forms of samples like semen, blood, saliva sweat and vaginal fluid were also taken to find some specific changes in all the blood samples.
4. Materials and Methods
The blood samples were collected from epileptic and normal children in the department of Neurology, Safdarjang Hospital New Delhi. Five ml of freshly drawn blood was collected in screw capped test tube containing 0.1ml of 0.5 M EDTA and was shaken nicely by inverting two or three times. Then freshly prepared solution of Dextran was added to half volume of the sample. The tube was kept in slanting position for 45 minutes and then in vertical position for 15 minutes. The plasma was decanted and centrifuged for twenty minutes at 1500 r.p.m in T-8 Remi centrifuge. After centrifugation of blood, buffy coat as well as some red blood cells at the top were removed along with plasma to get rid of any contamination of leucocytes. The remaining cells were washed three times with cold normal saline to wash out the plasma. The red blood cells were lypholized. The sample was prepared in powder form by grinding. The samples were prepared for Laser Raman spectroscopic measurements by taking about 1mg of the dehydrated red blood cell.
Raman spectra of heme proteins, were recorded in the 500 - 3000 cm−1 region with a laser Raman Spectrophotometer (Model NR-1000) consisting of photomultiplier unit (R-464) including Argon ion laser at 514.5 nm having scanning speed of 20 cm−1 min. A block diagram of laser Raman spectrophotometor is shown in Figure 4. A ray diagram of laser Raman spectroscopy is shown in Figures 4 and 5.
5. Results
Experimental findings are tabulated in Tables 1 and 2.
Experimental findings are reported in the form of a combined graph of all the diseased and normal children in Figures 6 and 7.

Figure 4. Block diagram of laser Raman spectrophotometer.

Figure 5. Ray diagram of laser Raman spectrophotometer.
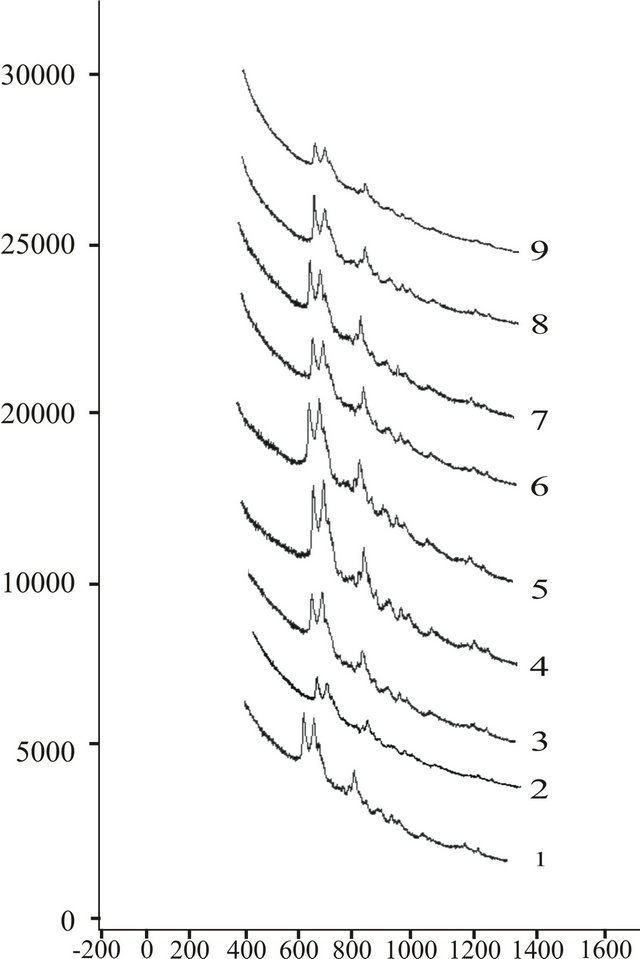
Figure 6. Combined laser Raman view of hemoproteins of all the spectra of hemoproteins normal children.
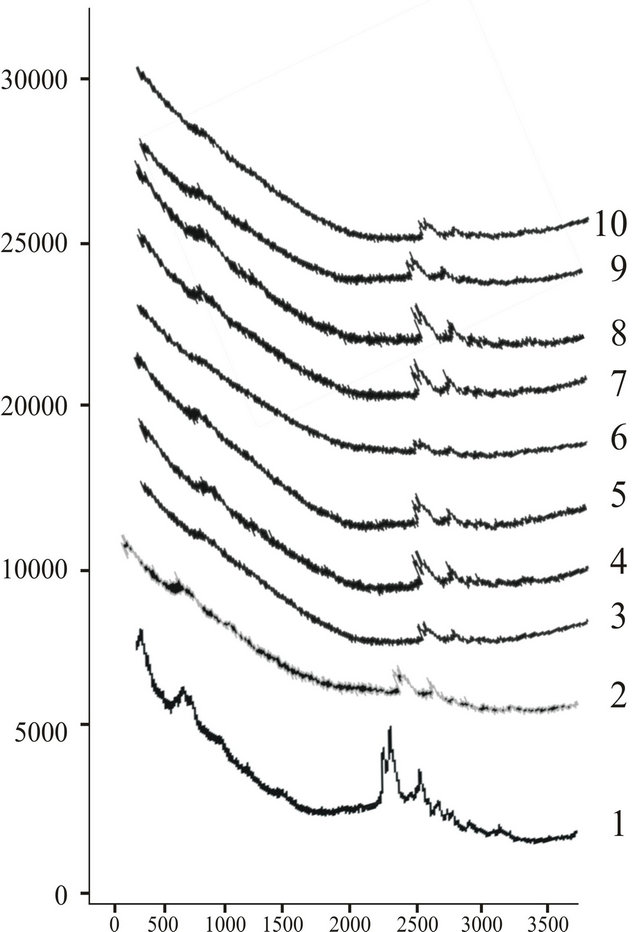
Figure 7. Combined laser Raman view of hemoproteins of all the spectra of dieased children.
Table 1. Different peak positions of Raman lines in the blood samples of normal children.
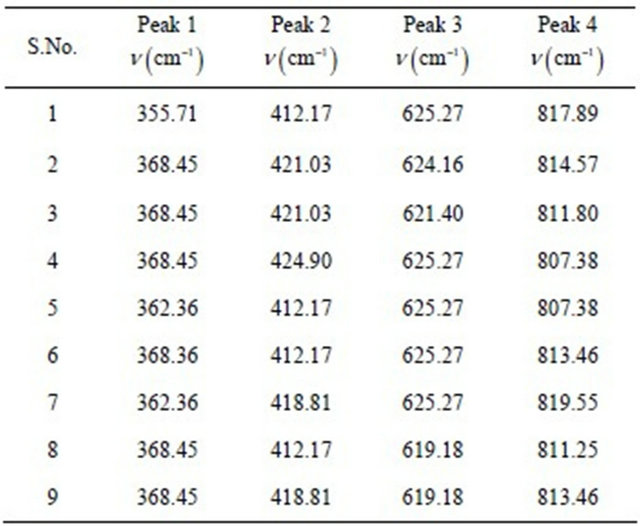
Table 2. Different peak positions of Raman lines in the blood samples of epileptic children.

Experimental findings for epileptic and normal children are very sensitive and remarkable to understand the causative mechanism of epilepsy at atomic level.
We have found a cluster of four peaks in all the samples. We have given name to the Raman lines at v1 (cm–1), v2 (cm–1), v3 (cm–1) and v4 (cm–1) related to first, second, third and fourth peak of spectrum.
It has been seen that in epileptic children v1 (cm–1) lies in the range (362.36 cm−1 to 368.45 cm−1), v2 (cm–1) in (362.36 cm−1 to 368.45 cm−1), v3 (cm–1) in (619.18 cm−1 to 625.27 cm−1 and final peak in the area of 362.36 cm−1 to 368.45 cm−1).
A difference of peak positions of Raman lines was also found in case of normal children. We have found a trend of four peak positions v1 (cm–1) in the range (317.34 cm−1 to 339.25 cm−1), v2 (cm–1) in the area of range (1736.39 cm−1 to 1792.20 cm−1) v3 (cm–1) in the range (1788.74 cm−1 to 1994.00 cm−1) and finally v4 (cm–1) have a position in the range (1987.05 to 2000.12 cm−1).
6. Discussion
Raman spectroscopy has for a long time been one of the best informative tools for probing insight into the structures of biological molecules. It has been also applied particularly to hemes and metalloporphyrins. Hemes and metalloporphyrins have a high symmetry and chromorphoric structure. Due to this fact strong Raman scattering arises.
Water is a weak Raman scatterer. This spectroscopy can effectively be used for the structural, chemical and vibrational analysis of materials. Every scattering species gives its own characteristic vibrational spectrum. The spectrum can be used for its qualitative identification. If the system has chemical interaction the new Raman lines may help in detecting the new molecular spices. The procedure can not disturb the chemical equilibrium and gives information asout labile species, which could not be apprehended by simple chemical analyser. This spectroscopy gives distinct information about individual species, present. Raman method is a powerful tool to measure only some property of the system as a whole. Intensity of a characteristic Raman line is to a fair approximation proportional to the volume concentrations of the species. Raman intensity measurements provide a basis for quantitative analysis. Raman spectroscopy is an information rich technique analysis. It can be applied to any biomolecule without labeling.
We have applied this sophisticated tool of spectroscopy to study the heme compounds in the form of red blood cells, which were derived from the blood of epileptic children and compare our data with healthy children. Heme proteins are known to be coloured. They can absorb visible light. Raman spectroscopy has been used to study the composition of heme proteins early by many scientist and reported in different articles. We are in a position to demarcate the changes, which were found at the molecular level. Active sites of heme proteins contain hemes, which are derivatives of porphyrins.
The spectra of porphyrin and hemes are known and vibrations have already been calculated and given in the literature nicely. The positions of few definite bands are known to refleet geometry of the heme. These positions can also reflect the heme iron coordination, spin and axidation states directly.
It has been seen that there is uncertainity in assignments of the ligand heme iron atoms vibrations. In the case histidine the heme iron imidazole nitrogen mode of bonding is very common in globins as well as cytochromes of b type. This band vibrates and found in the region form 210 cm−1 - 290 cm−1. The iron histidine modes in globulins were also studied and one further vibration is found at about 250 cm−1. The interation between histidine and heme play a role in differentiating the Raman activity of these interesting modes. It has been reported that in globins there is a sixth ligand of the heme iron termed as oxygen atom under some physiological conditions. Molecular oxygen is transported being bound to heme iron. The Fe-O-O vibrations in ferrous and cobalt porphyrins have also been examined with special reference to Fe-O2 and Fe=O structure. The position of Fe=O vibrations depicts the actural properties of heme.
The presence of myoglobin adduct has been reported and found at 797 cm−1 and N-methylimidazole (heme) Fe =O compound shows a band at 820 cm−1. Some of the Rman bands disappear in epileptic cases in comparison to healthy controls.
Raman bands were found approximately at 368.45 cm−1, 424.90 cm−1, 625.27 and 807.38 cm−1 in case of normal children. Raman bands in epilepsy have been found approximately at 1749.00 cm−1, 1795 cm−1 and 2000 cm−1. The band on the lower frequency sides is not found in epileptic cases. Although these bands are very far from the data available in the literature so far, a clear cut picture of the hemoproteins has already given in the literature and very interesting bands were found in the range from 300 cm−1 to 1800 cm−1. Our Raman lines are very effective and peculiar. We did not say anything about the detailing of these bands at this juncture. More extensive work is required to give some information.
7. Acknowledgements
The authors are thankful to Dr. P. K. Saxena, Principal, D. A. V. (P. G.) College, Muzaffarnagar for providing the facility of doing work. We are also thankful to Medical Supdt. of Safdarjang Hospital, New Delhi, for arranging the blood samples of the diseased and healthy controls. We are grateful to Dr. Manju Chauhan, Head, Department of Biosciences, D.A.V. (P.G.) College, Muzaffarnagar, for providing the facility of purification of IgG.
REFERENCES
- C. N. Banwell and E. M. Mc Cash, “Raman Spectroscopy,” In: Fundamentals of Molecular Spectroscopy, Tata McGraw-Hill Publishing. Co. Ltd., New Delhi, 1990, pp. 100-126.
- C. V. Raman and K. S. Krishnan, “A New Type of Secondary Radiation,” Nature, Vol. 121, No. 3048, 1928, pp. 501-502. doi:10.1038/121501c0
- M. C. Tobin, “Laser Raman Spectroscopy,” In: P. J. Elving and I. M. Kolthoff, Eds., Chemical Analysis, a Series of Monographs on Analytical Chemistry and Its Application, Vol. 35, Wiley-Interscience, New York; London, 1971, pp. 1-30.
- T. G. Spiro and T. M. Loehr, “Resonance Raman Spectra of Inorganic Molecules and Ions,” In: R. J. H. Clark and R. E. Hester, Eds., Advances in Infrared and Raman Spectroscopy, Vol. I, Heyden and Sons, London, 1975, pp. 1-58.
- F. Adar, M. Gouterman and S. Aronowitz, “Fluorescence, Resonance Raman, and Radiationless Decay in Several Hemoproteins,” Journal of Chemical Physics, Vol. 80, 1976, pp. 2184-2191.
- J. M. Friedman, D. L. Rousseau and F. Adar, “Excited State Lifetimes in Cytochromes Measured from Raman Scattering Data: Evidence for Iron-Porphyrin Interactions,” Proceedings of the National Academy of Sciences of the United States of America, Vol. 74, No. 7, 1977, pp. 2607-2611. doi:10.1073/pnas.74.7.2607
- T. C. Strekas and T. G. Spiro, “Hemoglobin: Resonance Raman Spectra,” Biochimica et Biophysica Acta (BBA)— Protein Structure, Vol. 263, No. 3, 1972, pp. 830-833. doi:10.1016/0005-2795(72)90072-4
- T. C. Strekas and T. G. Spiro, “Cytochrome C: Resonance Raman Spectra,” Biochimica et Biophysica Acta (BBA)—Protein Structure, Vol. 278, No. 1, 1972, pp. 188-192. doi:10.1016/0005-2795(72)90121-3
- H. Brunner, A. Mayer and H. Sussner, “Resonance Raman Scattering on the Haem Group of Oxyand DeoxyHemoglobin,” Journal of Molecular Biology, Vol. 70, No. 1, 1972, pp. 153-156. doi:10.1016/0022-2836(72)90169-6
- T. G. Spiro and T. C. Streaks, “Resonance Raman Spectra of Hemoglobin and Cytochrome C: Inverse Polarization and Vibronic Scattering,” Proceedings of the National Academy of Sciences of the United States of America, Vol. 69, No. 9, 1972, pp. 2622-2626. doi:10.1073/pnas.69.9.2622
- B. R. Wood and Mc. D. Naughton, “Raman Excitation Wavelength Investigation of Single Red Blood Cell in Vivo,” Journal Raman Spectroscopy, Vol. 33, No. 7, 2002, pp. 517-523. doi:10.1002/jrs.870
- H. Fabian and P. Anzenbacher, “New Developments in Raman Spectroscopy of Biological Systems,” Vibrational Spectroscopy, Vol. 4, No. 2, 1993, pp. 125-148. doi:10.1016/0924-2031(93)87032-O
- T. G. Spiro, “Biological Applications of Raman Spectroscopy,” Vol. 1-3, Wiley, New York, 1987, p. 16.
- S. Choi, T. G. Spiro, K. C. Langry, K. M. Smith, D. L. Budand and G. N. La Mar, “Structural Correlations and Vinyl Influences in Resonance Raman Spectra of Protoheme Complexes and Proteins,” Journal of the American Chemical Society, Vol. 104, No. 16, 1982, pp. 4345-4351. doi:10.1021/ja00380a006
- S. Choi and T. G. Spiro, “Out-of-Plane Deformation Modes in the Resonance Raman Spectra of Metalloporphyrin and Heme Proteins,” Journal of the American Chemical Society, Vol. 105, No. 11, 1983, pp. 3683-3692. doi:10.1021/ja00349a056
- H. Lee, T. Kitagawa, M. Abe, R. K. Pandey, H. K. Leung and K. M. Smith, “Characterization of Low Frequency Resonance Raman Bands of Metallo-Protoporphyrin IX. Observations of Isotpopes Shift and Normal Coordinate Treatments,” Journal of Molecular Structure, Vol. 146, 1986, pp. 329-347. doi:10.1016/0022-2860(86)80302-7
- T. G. Spiro, “The Resonance Raman Spectroscopy of Metalloporphyrins and Heme Proteins,” In: A. B. P. Lever and H. B. Gray, Eds., Iron Porphyrins, Vol. II, Addition-Wisley, Reading, M. A., 1983, pp. 89-160.
- N. Patasarathi, C. Hansen, S. Yamaguchi and T. G. Spiro, “Metalloporphyrin Core Size Resonance Raman Marker Bands Revisited, Implications for the Interpretation of Hemoglobin Photoproduct Raman Frequencies,” Journal of the American Chemical Society, Vol. 109, No. 13, 1987, pp. 3865-3871. doi:10.1021/ja00247a009
- N. T. Yu, “Resonance Raman Studies of Ligand Binding,” Methods in Enzymology, Vol. 130, 1986, pp. 350- 409. doi:10.1016/0076-6879(86)30018-1
- K. Nagai, T. Kitagawa and H. Morimoto, “Quaternary Structures and Low Frequency Molecular Vibrations of Haems of Deoxy and Oxy Hemoglobin Studied by Resonance Raman Scattering,” Journal of Molecular Biology, Vol. 136, No. 3, 1980, pp. 271-289. doi:10.1016/0022-2836(80)90374-5
- P. Anzenbacher, J. H. Dawson and T. Kitagawa, “Towards a Unified Concept of Oxygen Activation by Hemoproteins,” Journal of Molecular Structure, Vol. 214, 1989, pp. 149-158. doi:10.1016/0022-2860(89)80011-0
- P. Anzenbacher, R. Evangelista-Kirkup, J. Schenkman and T. G. Spiro, “Influence of Thiolate Ligation on the Heme Electronic Structure in Microsomal Cytochrome P-450 and Model Compounds Resonance Raman Spectroscopic Evidence,” Inorganic Chemistry, Vol. 28, No. 25, 1989, pp. 4491-4995. doi:10.1021/ic00324a013
- O. Bangcharoenpaurpong, A. K. Rizos, P. M. Champion, D. Jollie and S. G. Sligar, “Resonance Raman Detection of Bound Dioxygen in Cytochrome P-450 Cam,” Journal of Biological Chemistry, Vol. 261, 1986, pp. 8089-8092.
- H. E. Van Wart and J. Zimmer, “Resonance Raman Evidence for the Activation of Dioxygen in Horseradish Oxyperoxidase,” Journal of Biological Chemistry, Vol. 260, 1985, pp. 8372-8377.
- P. Anzenbacher, J. Hudecek, P. Mojes, J. Stepanek and V. Baumruk, “Resonance Raman Study of the Reduction of Catalase. Evidence for Strong Electron Donation to the Heme,” Studia Biophysica, Vol. 123, 1988, pp. 53-58.
- S. Hu, A. J. Schneider and J. R. Kincaid, “Resonance Raman Study of oxycytochrome P450cam: Effect of Substrate Structure on .nu.(O-O ) and .nu.(Fe-O2),” Journal of the American Chemical Society, Vol. 113, No. 13, 1991, pp. 4815-4822. doi:10.1021/ja00013a016
- S. Hu and J. R. Kincaid, “Resonance Raman Structural Characterization and the Mechanism of Formation of Lactoperoxidase Compound III,” Journal of the American Chemical Society, Vol. 113 No. 19, 1991, pp. 7189-7194. doi:10.1021/ja00019a015
- X. Y. Li and T. G. Spiro, “Is Band Collinear or Bent in Heme Proteins-Evidence from Resonance Raman and Infrared Spectroscopic Data,” Journal of the American Chemical Society, Vol. 110, No. 18, 1988, pp. 6024-6033. doi:10.1021/ja00226a017
- K. D. Park, K. Go, F. Adebodun, M. L. Chiu, S. G. Sligar and E. Oldfield, “Distal and Proximal Ligand Interaction in Heme Proteins: Correlations between C-O and Fe-C Vibration al Frequencies, Oxygen-17 and Carbon-13 Nuclear Magnetic Resonance Chemical Shifts and Oxygen-17 Nuclear Quadrupole Coupling Constants in C17Oand 13CO-Labeled Speices,” Biochemistry, Vol. 30, No. 9, 1991, pp. 2333-2347. doi:10.1021/bi00223a007
- O. Bangcharoenpaurpong, P. M. Champion, K. S. Hall and L. P. Hager, “Resonance Raman Studies of Isotopically Labeled Chloroperoxidase,” Biochemistry, Vol. 25, No. 9, 1986, pp. 2374-2378. doi:10.1021/bi00357a011
- S. Matsukawa, K. Mawatari, Y. Yoneyama and T. Kitagawa, “Correlation between the Iron-Histidine Stretching Frequencies and Oxygen Affinity of Hemoglobins. A Continuous Strain Model,” Journal of the American Chemical Society, Vol. 107, No. 5, 1985, pp. 1108-1113. doi:10.1021/ja00291a004
- A. V. Wells, J. T. Sage, D. Morikis, P. M. Champion, M. L. Chiu and S. Sligar, “The Iron-Histidine Mode of Myoglobin Revisited : Resonance Raman Studies of Isotopically Labeled Eschrichia Coli-Expressed Myoglobin,” Journal of the American Chemical Society, Vol. 113, No. 25, 1991, pp. 9655-9660. doi:10.1021/ja00025a034
- L. M. Proniewicz, A. Bruha, K. Nakamoto, Y. Uemori, E. Kyuno and J. R. Kincaid, “Resonance Raman Spectroscopic Detection of Steric-Induced Distortions of Axial Ligand Binding for Dioxygen Adducts of Superstructured Cobalt-Porphyrin Complexes,” Journal of the American Chemical Society, Vol. 113, No. 24, 1991, pp. 9100-9104. doi:10.1021/ja00024a011
- Y. Mizutani, S. Hanshimoto, Y. Tatsuno and T. Kitagawa, “Resonance Raman Persuit of the Change from Iron (II)-Oxygen (FeII-O2) to Iron (III)-Hydroxyl (FeIII-OH) via Iron (IV): Oxygen (FeIV:O) in the Autoxidation of Ferrous Iron Porphyrin,” Journal of the American Chemical Society, Vol. 112, No. 19, 1990, pp. 6809-6814. doi:10.1021/ja00175a011
- W. A. Oertling, R. T. Kean, R. Wever and G. T. Babcock, “Factors Affecting the Iron-Oxygen Vibrations of Ferrous Oxy and Ferryl Oxo Heme Proteins and Model Compounds,” Inorganic Chemistry, Vol. 29, No. 14, 1990, pp. 2633-2645. doi:10.1021/ic00339a021
- S. Hashimoto, Y. Mizutani, Y. Tatsuno and T. Kitagawa, “Resonance Raman Characterization of Ferric and Ferryl Porphyrin. Pication Radicals and the FeIV:O Stretching Frequency,” Journal of the American Chemical Society, Vol. 113, No. 17, 1991, pp. 6542-6549. doi:10.1021/ja00017a027
- P. Anzenbacher, J. H. Dawson, T. Kitagawa and K. Österlund, “State of the Art,” In: A. Bertoluzza, C. Fagnano and P. Monti, Eds., Spectroscopy of Biological Molecules, Esculapio, Bologna, 1989, p. 101.
- T. Ogura, S. Takahashi, K. Shinzawa-Itoh, S. Yoshikawa and T. Kitagawa, “Observation of the Fe4+=O Stretching Raman Band for Cytochrome Oxidase Compound B at Ambient Temperature,” Journal of Biological Chemistry, Vol. 265, No. 19, 1990, pp. 14721-14723.
- W. A. Oertling, H. Hogland, G. T. Babcock and R. Weber, “Identification and Properties of an Oxoferryl Structure in Myeloperoxidase Compound II,” Biochemistry, Vol. 27, No. 15, 1988, pp. 5395-5400. doi:10.1021/bi00415a002
- J. Terner, A. J. Sitter and C. M. Reczek, “Resonance Raman Spectroscopic Characterization of Horseradish Oxyperoxidase Observations of the Fe4+=O Stretching Vibration of Compounds,” Biochimica et Biophysica Acta (BBA)—Protein Structure and Molecular Enzymology, Vol. 828, No. 12, 1985, pp. 73-80. doi:10.1016/0167-4838(85)90011-1
- G. T. Babcock, J. M. Jean, L. N. Johnston, W. H. Woodruff and G. J. Palmer, “Flow-Flash Time-Resolved Raman Spectroscopy of the Qxidation of Reduced and of Mixed Valence Cytochrome Oxidase by Dioxygen,” Inorganic Chemistry, Vol. 23, No. 3-4, 1985, pp. 243-251.
- A. J. Sitter, C. M. Reczek and J. Terner, “Heme-Linked Ionization of Horseradish Oxyperoxidase Compound II Monitored by Resonance Raman Fe4+=O Stretching Vibration,” Journal of Biological Chemistry, Vol. 260, No. 12, 1985, pp. 7515-7522.
- C. Varotis, W. H. Woodruff and G. T. Babcock, “Direct Detection of a Dioxygen Adduct of Cytochrome a3 in the Mixed Valence Cytochrome Oxidase/Dioxygen Reaction,” Journal of Biological Chemistry, Vol. 265, No. 19, 1990, pp. 11131-11136.
- S. Han, Y. C. Ching and D. L. Rousseau, “Ferryl and Hydroxyl Inter Mediates in the Reaction of Oxygen with Reduced Cytochrome C Oxidase,” Nature, Vol. 348, 1990, pp. 89-90. doi:10.1038/348089a0
- C. Varotis and G. T. Babcock, “Appearance of the v (Fe IV:O) Vibration from a Ferryl-Oxo Intermediate in the Cytochrome Oxidase/Dioxygen Reaction,” Biochemistry, Vol. 29, No. 32, 1990, pp. 7359-7362.
- S. W. Han, Y. C. Ching, S. L. Hammes and D. L. Rousseau, “Vibrational Structure of the Formyl Group on Heme a. Implications on the Properties of Cytochrome C Oxidase,” Biophysical Journal, Vol. 60, No. 1, 1991, pp. 45-52. doi:10.1016/S0006-3495(91)82029-X
- G. B. Ray, R. A. Copeland, C. P. Lee and T. G. Spiro, “Resonance Raman Evidence for Low Spin Iron (2+) Heme a3 in Energized Cytochrome C Oxidase: Implications for the Inhibition of Oxygen Reduction,” Biochemistry, Vol. 29, No. 3, 1990, pp. 3208-3213. doi:10.1021/bi00465a009
- J. C. de Paula, W. E. Pfeiffer, R. T. Ingle, J. A. Centeno, S. Ferguson-Miller and G. T. Babcock, “Heme a and Heme a3 Environments of Plant Cytochrome C Oxidase,” Biochemistry, Vol. 29, No. 37, 1990, pp. 8702-8703.
- P. Hildebrandt and M. Stockburger, “Cytochrome C at Charged Interface. 1. Conformational and Redox Equilibria at the Electrode/Electrolyte Interface Probed by Surface Enhanced Resonance Raman Spectroscopy” Biochemistry, Vol. 28, No. 16, 1989, pp. 6710-6721. doi:10.1021/bi00442a026
- P. Hildebrandt and M.Stockburger, “Cytochrome C at Charged Interface. 2. Complexes with Negatively Charged Macromolecular Systems Studied by Resonance Raman Spectroscopy,” Biochemistry, Vol. 28, No. 16, 1989, pp. 6722-6728.
- P. Hildebrandt, T. Heimburg, D. Marsh and G. L. Powell, “Conformational Changes in Cytochrome C and Cytochrome Oxidase upon Complex Formation: A Resonance Raman Study,” Biochemistry, Vol. 29, No. 6, 1990, pp. 1661-1668. doi:10.1021/bi00458a044
- P. Hildebrandt, A. M. English and G. Smuievich, “Cytochrome C and Cytochrome C peroxidase Complex as Studied by Resonance Raman Spectroscopy,” Biochemistry, Vol. 31, No. 8, 1992, pp. 2384-2392. doi:10.1021/bi00123a025
- T. G. Spiro and J. M. Burke, “Protein Control of Porphyrin Conformation: Comparison of Resonance Raman Spectra of Hemeproteins with Mesoporphyrin (IX) Analogues,” Journal of the American Chemical Society, Vol. 98, No. 18, 1976, pp. 5482-5489. doi:10.1021/ja00434a013
- L. D. Spaulding, R. C. C. Chang, N. T. Yu and R. H. Felton, “Resonance Raman Spectra of Metallooctaethylporphyrins. A Structural Probe of Metal Displacement, Journal of the American Chemical Society, Vol. 97, 1975, pp. 2517-2525.
- T. Yamamoto, G. Palmer, D. Gill, I. T. Salmeen and L. Rimai, “The Valence and Spin State of Iron in Oxyhemoglobin as Inferred from Resonance Raman Spectroscopy,” Journal of Biological Chemistry, Vol. 248, 1973, pp. 5211-5214.
- T. C. Spiro and T. C. Strekas, “Resonance Raman Spectra of Heme Proteins: Effects of Oxidation and Spin State,” Journal of the American Chemical Society, Vol. 96, No. 2, 1974, pp. 338-345. doi:10.1021/ja00809a004
- T. M. Loehr and J. S. Loehr, “Determination of Oxidation and Spin States of Heme Iron. Resonance Raman Spectroscopy of Cytochrome C, Microperoxidase and Horseradish Peroxidase,” Biochemical and Biophysical Research Communications, Vol. 55, 1973, pp. 218-223. doi:10.1016/S0006-291X(73)80082-8
- H. Ogoshi, Y. Saito and K. Nakamoto, “Infrared Spectra and Normal Coordinate Analysis of Metalloporphyrins,” Journal of Chemical Physics, Vol. 57, 1972, pp. 4194- 4202.
- R. H. Felton, A. Y. Romans, N. T. Yu and C. R. Schonbaum, “Laser Raman Spectra of Oxidized Hydroperoxidases,” Biochimica et Biophysica Acta (BBA)—Protein Structure, Vol. 434, No. 1, 1976, pp. 82-89. doi:10.1016/0005-2795(76)90037-4
- [61] D. L. Rousseau and M. R. Ordrias, “Resonance Raman Spectra of the Heme in Leghemeglobin Evidence for the Absence of Ruffling and the Influence of the Vingl Groups”, Journal of Biological Chemistry, Vol. 258, No. 3, 1983, pp. 1740-1746.
- [62] N. T. Yu and R. D. Srivastava, “Resonance Raman Spectroscopy of Heme Proteins with Intensified Vidicon Detectors: Studies of Low Frequency Modes and Excitation Profiles in Cytomchrome C and Hemoglobin,” Journal of Raman Spectroscopy, Vol. 9, No. 3, 1980, pp. 166-171.
- [63] M. Polomska, L. Kubisz, R. Kalawski, G. Oszkinis, R. Filipiak and A. Mazerek, “Fourier Transform Near Infrared Raman Spectroscopy in Studies on Connective Tissue,” Acta Physica, Rolanica A, Vol. 118, No. 1, 2010, pp. 136-140.
- [64] T. Kitajawa, Y. Kyogoku, T. Iizuka, M. I. Saito and T. Yamanaka, “Resaonance Raman Scattering from Hemoproteins Effects of Ligands upon the Raman Spectra of Various C Type Cytochromes”, Journal of Biological Chemistry, Vol. 78, No. 4, 1975, pp. 719-728.
- [65] D. F. Bocian, A. T. Lamley, N. O. Peterson, G. W. Brudvig and S. I. Chan, “Resonance Raman Spectra of Cytochrome C Oxidase. Excitation in the 600-nm Region,” Biochemistry, Vol. 18, No. 20, 1979, pp. 43396-4402. doi:10.1021/bi00587a020
- [66] X. Ye, A. Demidov, F. Rosca, W. Wang, A. Kumar, D. Ionascu, L. Zhu, D. Barrick, D. Wharton and P. M. Champion, “Investigations of Heme Protein Absorption Line Shapes, Vibratoinal Relaxation and Resonance Raman Scattering on Ultrafast Time Scates,” Journal of Physical Chemistry A, Vol. 107, No. 40, 2003, pp. 8156- 8165. doi:10.1021/jp0276799
- [67] A. T. Tu, “Use of Raman Spectroscopy in Biological Compounds,” Journal of the Chinese Chemical Society, Vol. 50, 2003, pp. 1-10.
- [68] O. Bangcharoenpaurpong, K. T. Schomacker and P. M. Champion, “A Resonance Raman Investigation of Myeglobin and Hemoglobin,” Journal of the American Chemical Society, Vol. 106, No. 19, 1984, pp. 5688-5698. doi:10.1021/ja00331a045
- [69] A. L. Verma, G. S. S. Saini and N. K. Chaudhory, “Resonance Raman Studies of Netalloporphyrins,” Proceedings of Indian Academic Science (Chemistry Science), Vol. 102, No. 3, 1990, pp. 291-306.
- [70] J. M. Friedman, D. L. Rousseau and M. R. Ordrias, “Time Resolved Resonance Raman Studies of Hemoglobin,” Annual Review of Physical Chemistry, Vol. 33, 1982, pp. 471-491. doi:10.1146/annurev.pc.33.100182.002351
- [71] P. M. Callahan and G. T. Babcock, “Insights into Heme Structure from Soret Excitation Ramanspectroscopy,” Biochemistry, Vol. 20, No. 4, 1981, pp. 952-958. doi:10.1021/bi00507a048
- [72] P. Stein, J. M. Bruke and T. G. Spiros, “Structural Interpretation of Heme Protein Resonance Raman Frequencies. Preliminary Normal Coordinate Analysis Results,” Journal of the American Chemical Society, Vol. 7, No. 8, 1975, pp. 2304-2305. doi:10.1021/ja00841a070
- [73] L. D. Spaulding, C. C. Chang, N. T. Yu and R. M. Felton, “Resonance Raman Spectra of Metallo Octaethyporphyrins. A Structural Probe of Metal Displacement,” Journal of the American Chemical Society, Vol. 97, No. 9, 1974, pp. 2511-2525.
- [74] T. G. Spiro, “Resonance Raman Spectroscopy: A New Structure Probe for Biological Chromophores,” Accounts of Chemical Research, Vol. 7, No. 10, 1974, pp. 339-334. doi:10.1021/ar50082a004
- [75] B. J. Bulkin, “Raman Spectroscopic Study of Human Erythrocyte Membranes,” Biochimica et Biophysica Acta (BBA)—Biomembranes, Vol. 274, No. 2, 1972, pp. 649- 651. doi:10.1016/0005-2736(72)90214-3
- [76] J. A. Shelnutt, D. L. Rousseau, J. M. Friedman and S. R. Siman, “Protein-Heme Interaction in Hemoglobin: Evidence from Raman Difference Spectroscopy,” Proceedings of the National Academy of Sciences of the United States of America, Vol. 76, No. 9, 1979, pp. 4409-4413. doi:10.1073/pnas.76.9.4409
- [77] A. Tomkova, M. Antalik, J. Bagelova, P. Miškovsky and J. Ulincný, “Absorption and Raman Spectroscopy Study of Cty C-Thiol Complexes in Acidic Solutions,” General Physiology and Biophysics, Vol. 11, 1992, pp. 273-286.
- [78] B. R. Wood, B. Tait and D. McNaughton, “Micro-Raman Characterization of the R to T State Transition of Hemoglobin within a Single Living Erythrocyte,” Biochimica et Biophysica Acta, Vol. 1539, No. 1-2, 2001, pp. 58-70.
- [79] B. R. Wood and D. McNaughton, “Micro Raman Characterization of High and Low-Spin Heme Moieties within Single Living Erythrocytes,” Biopolymers, Vol. 67, No. 4-5, 2007, pp. 259-262. doi:10.1002/bip.10120
- [80] H. Burner and H. Sussner, “Resonance Raman Scattering on Hemoglobin,” Biochimica et Biophysica Acta, Vol. 310, No. 1, 1972, pp. 20-31.
- [81] B. R. Wood, P. Caspers, G. J. Puppels, S. Pandiancherri and D. McNaughton, “Resonance Raman Spectroscopy of Red Blood Cells Using near—Infrared Laser Excitation,” Bioanal Chemistry, Vol. 367, No. 5, 2007, pp. 1691-1703.
- [82] S. Mishra, R. Kumar, S. K. Arya, S. Kumar, R. Kumar and M. M. Bajaj, “Applications of Laser Raman and FT-IR Techniques to Leprology, Neurology, Bacteriology and Traumatology,” Proceedings of Indian Academic Science (Chemistry Science), Vol. 102, No. 5, 1990, pp. 713- 720.
- [83] K. Ramser, W. Wenseleers, S. Dewilde, V. S. Docrslaer and L. Moens, “The Combination of Resonance Raman Spectroscopy, Optical Tweezers and Microfluidic System Applied to the Study of Various Heme-Containingsingle Cells,” Spectroscopyan, International Journal, Vol. 22, No. 4, 2008, pp. 287-295. doi:10.1155/2008/463191
- [84] V. Sikirzhytski, A. Sikirzhytskaya and I. K. Lednev, “Spectroscopy/Forensics CSI: Multidimensional Raman Spectroscopy,” Applied Spectroscopy, Vol. 65, No. 11, 2011, pp. 1223-1232. doi:10.1366/11-06455
- [85] Y. Ozaki, “Medical Applications of Raman Spectroscopy,” Applied Spectroscopy Review, Vol. 24, No. 3-4, 1988, pp. 259-312.
NOTES
*Corresponding author.