 Psychology 2012. Vol.3, No.3, 257-264 Published Online March 2012 in SciRes (http://www.SciRP.org/journal/psych) http://dx.doi.org/10.4236/psych.2012.33036 Copyright © 2012 SciRes. 257 Inconstancy and Inconsistency of Visual Illusory Phenomena? The Case of the Poggendorff Figure Alberto Gal l ace1, Marialuisa Martelli2, Roberta Daini1 1Department of Psychology, Università degli Studi di Milano-Bicocca, Milan, Italy 2Department of Psychology, Università di Roma “La Sapienza”, Rome, Italy Email: rober ta.daini@unimib.it Received November 22nd, 2011; re v is e d D e cember 19th, 2011; accepted January 14th, 2012 Since its conception, the Poggendorff Figure has always been studied by considering the absolute role of the variables involved in determining the illusion (e.g. the angle or the distance between the inducer and the test stimuli). By contrast, we suggest that the role of such variables is relative to the specific condi- tions in which the illusory configuration is presented; in particular, we propose that multiple variables en- ter the computation leading to the Poggendorff Illusion, but that their relative weight varies as a function of the specific experimental conditions adopted. Here, we measured the point of subjective collinearity between the oblique lines of the Poggendorff Figure as a function of the orientation of the inducer (a square), the orientation of the test stimuli (changing the linear distance between them) and the size of the whole configuration. We found that when the inducer square was upright the illusory effect varied ac- cording to the distance between the test segments, while when the square was tilted the effect was deter- mined only by its orientation. Critically, the latter condition led to a reversal of the “classic” illusory ef- fect. Leveling the playing field in terms of the information available to the observer, the results indicate that the illusory effect is determined by different types of processing in different conditions of stimulus presentation. Keywords: Visual Illusion; Perception; Psychophysics; Behavioral Introduction Visual illusions, with the insights they provide into visual processing by breaking it into separate mechanisms (e.g. Gre- gory, 1968), have attracted the attention of psychologists and cognitive scientists since the last century (e.g., Gillam, 1980, 1998). It has also been suggested that the study of the mecha- nisms underlying visual illusions may play an important role in understanding the nature of human spatial representations (Printzmetal & Beck, 2001). However, despite the large body of research dedicated to exploring this domain of perception, the computations underlying many visual illusions are still unclear (e.g. Coren & Girgus, 1978; Eagleman, 2001; Purves & Lotto, 2002). One of the oldest and most widely studied perceptual illu- sions is the figure of Poggendorff (Poggendorff, 1860; see also Burmester, 1896; Day & Dickenson, 1976; Fineman, 1996): when two oblique collinear lines are separated by an area de- fined by two vertical (or horizontal) bars, a visual illusion of two unaligned lines will result (see Figure 1(a)). Different in- terpretations have been proposed to account for this illusory effect; most of which fall into two main categories: 1) “length distortion” hypotheses; and 2) “angle distortion” hypotheses. Interpretations in the first category su stain that the perceived displacement of the two oblique lines is determined by the per- ceptual shrinkage of the space between the two parallel lines (e.g., Zanuttini, 1976). In fact, if the distance separating the two segments along the horizontal meridian is perceived as being smaller than it really is, then the test lines must be moved closer along the vertical meridian in order to appear collinear. The shrinkage theory is based on two observations: 1) that the space upon which a figure is amodally completed is perceived as being shorter than it really is (e.g., Kanizsa, 1972, 1974); and 2) that a particular linear distance extending across an empty space is underestimated (Tong & Weintraub, 1974). Within this category of interpretation, the Poggendorff Illusion can be con- sidered to be similar to the Muller-Lyer Illusion (e.g., Judd, 1902; Porac, 1994; Predebon, 2001), in which the positioning of four lines forming two arrowheads (inward pointing or out- ward pointing) at the extremities of a line modifies the percep- tion of its length (see Figure 1(b)). An interpretation common to both the Poggendorff and the Muller-Lyer Illusions holds that the distortion is a consequence of a compulsory computa- tion of the “veridical” distance between the parallel lines in addition to the computation of the distance between the oblique segments (e.g., Judd, 1902; Porac , 1994; Predebon, 2001; Greist - Bousquet & Schiffman, 1981, 1985; Pressey, 1988). This is called the assimilation theory (Pressey, 1974; 1988). All of these models share the observation that the perceived distance between the parallel lines strongly affects the bias in the Pog- gendorff figure (e.g., Bazzeo, Vicario, & Zambianchi, 1993; Masini, Costa, Ferraro, & De Marco, 1994; Zanuttini, 1973, 1976; but see Vezzani, 1999). This has been taken as evidence of the validity of the length distortion interpretation of this illu- sion (e.g., Buxton, 2001; Masini, Costa, Ferraro, & De Marco, 1997; Masini, Sciaky, & Pascarella, 1992; Wilson, 1983; but see Finlay & Caelli, 1976). Interpretations in the second category sustain that the illusory effect is the consequence of an overestimation of the acute an- gle between the oblique and the parallel lines composing the figure (Hering, 1861). If the acute angle is perceived as greater  A. GALLACE ET AL. than it really is, then the lines need to be moved closer along the vertical meridian in order to appear collinear. The fact that the illusory effect increases as the angle between the oblique and parallel lines decreases has been taken as evidence for this interpretation (e.g., Hotopf & Ollerearnshaw, 1973; Weintraub, Krantz, & Olson, 1981). The mutual inhibition of the neurons responding to different orientations in brain Area V1 has been suggested as a possible physiological basis for the overestima- tion of the acute angle in this and other illusions (e.g., Black- more, Carpenter, & Georgeson, 1970). In other words, each line activates a population of neurons responding to a specific ori- entation. Orientation tuning in Area V1 is approximately 30 degrees in width (e.g., De Valois, De Valois, 1990; De Valois, De Valois, & Yund, 1979) thus, when the angle in the illusion is less than 30 degrees the two lines activate almost the same population of neurons. These cells inhibit each other due to proximity, thus the maximum response is related to the activity of cells tuned to adjacent orientations, away from the tilt of the lines. However, this effect does not fully explain the illusion as the illusory effect is reduced, but not absent, when the angle is larger than 30 degrees. Recently, Prinzmetal and Beck (2001) made a thorough in- vestigation that attempted to explain several illusions within the same framework. On the basis of the results obtained from their examination of the Rod-and-frame Illusion (Witkin & Asch, 1948), they suggested that the tilt of the body affects the mag- nitude of certain illusory phenomena such as the Poggendorff, Zollner, Ponzo and Wundt-Hering Illusions, but not others (Muller-Lyer and size constancy effect). Tilting the body re- duces the gravitational input while keeping the visual input constant. The magnitude of the Poggendorff Illusion increases as gravitational input weakens. The vestibular system plays a fundamental role in the computation of orientation and the fact that the gravitational cue modulates the Poggendorff Illusion would seem to indicate that this is an “orientation illusion” just like the Tilt illusion and the Rod and Frame Illusion. In these configurations a vertical test stimulus is perceived as tilted when surrounded by a tilted inducer (see Figure 1(c)). A global model of orientation analysis has been proposed to account for the orientational effects obtained with these illusions, according to which the axis of symmetry of the inducing figure closer to the vertical meridian exerts attraction or repulsion over the test figure, generating misperception of the orientation (Wenderoth & Beth, 1977; Zoccolotti et al., 1993; Wenderoth & van der Zwan, 1991). The literature about the Poggendorff Figure, including the study by Prinzmetal and Beck (2001), has considered the abso- lute role of one or more variables involved in determining the illusion. So, for example, mechanisms of length processing affect some illusions and those of orientation processing affect other illusions. By contrast, we suggest that the perceptual processing that leads to the specific illusory phenomena depends on the spe- cific conditions of stimulus presentation. That is, exactly the same configuration activates different mechanisms as a func- tion of the available and relevant information. According to this view the computations regarding the length and the orientation of the inducer are not relevant per se, but can be differently weighted under different c o nditions of stimulus presentation. In order to demonstrate this hypothesis we chose to manipu- late two main features of the global configuration of the Pog- gendorff Figure: the length and the orientation of the inducer (a a) b)c) (a) (b)(c) Figure 1. Standard versions of: (a) Poggendorff illusion; (b) Müller-Lyer illusion; (c) Rod and frame illusion. square). This choice is justified by the fact that length has been the most studied variable in this domain, while global orienta- tion is directly related to the interpretation of the Poggendorff Illusory effect in terms of orientation illusion (Prizmetal & Beck, 2001). As far as the length distortion hypothesis is con- cerned, we manipulated the orientation of the test segments with respect to the inducer, which affects the distance connect- ing the two segments, but not the distance between the parallel lines (side length). In order to test for the role of global orientation distortion we varied the orientation of the whole figure. A square figure was used instead of the classical parallel lines or rectangle so as to maintain all other variables constant while varying global ori- entation. In order to avoid lateral inhibition effects, the angles between the test lines and the inducer were always greater than 30 degrees (Carpenter & Blackmore, 1973). We hypothesized that the role of length or orientation on the computation leading to the illusory effect might vary despite the fact that the relative physical dimensions of these variables were kept constant. In the first experiment the main axis of the inducer figure was laid on the horizontal and vertical spatial axes, while in the second experiment the square was tilted and the two segments were either vertical or horizontal. Note that in both conditions the physical parameters of the stimulus re- mained unchanged. Experiment 1 Methods Participants. 14 right-handed participants (5 males and 9 females) took part in this experiment as volunteers (mean age of 27 years, range of 21 - 33 years; mean education of 16.4 years, range 15 - 17 years). All of the participants had normal or corrected to normal vision. Apparatus and materials. Stimuli were drawn and pre- sented with the Matlab program on a PC platform. A modifica- tion of the Poggendorff Figure was used as a stimulus, consist- ing of a black line drawing on a white background of an upright square and two abutting oblique line segments (see Figure 2). Two different sizes of square were used covering a visual angle of 9 degrees and 15 degrees. The length of the line segments was 1/6 of the length of the side of the square. The two oblique lines could either be placed to the left and right (vertical ar- rangement condition) or to the top and bottom (horizontal ar- rangement condition) of the square. Two orientations of the oblique segments with respect to the connecting side of the square were used, producing angles of 60 degrees and 75 de- grees. Different positions of the test lines relative to their veridical collinearity were used: the position of the right obli- que line (in the vertical arrangement condition) and of the top oblique line (in the horizontal arrangement condition; hereafter Copyright © 2012 SciRes. 258  A. GALLACE ET AL. Figure 2. Figures used in Experiment 1 for each orientation of the test lines (60 and 75 degrees) and for each position of the inducing figure (horizontal and vertical). The dotted lines represent the axes of symmetry of the inducing figure. “match lines”) were maintained constant during the experiment. The position of the left (or the bottom; hereafter “test lines”) was varied between trials achieving 11 different possible posi- tions. In the 9 degree square size condition, the test line was moved in steps of 0.3 degrees from –0.3 to 2.7 degrees from true collinearity with respect to the match line. In the 15 degree square figure condition the range of distances varied from –0.5 to 4.5 degrees in steps of 0.5 degrees. The steps were chosen in a preliminary experiment so as to be able to capture the size of the illusion (the preliminary data are not included in the re- sults). Each position for the 3 conditions (square size, arrangement, and angle of the oblique lines) was repeated 8 times for a total of 704 trials. The vertical and horizontal arrangement condi- tions were always presented in separate blocks of 352 trials each, in a counterbalanced order across observers. All the other conditions were completely randomized within each block of trials. Procedure. The experiment was conducted in a totally dark room. The participants were seated comfortably on a chair at a distance of 57 cm from a 17’’ PC monitor; they viewed the stimuli through a circular window (23.5 degrees in diameter) in a 45 degree diameter cardboard mask placed over the screen frame to cover the monitor. The stimuli were presented for 700 msec and then replaced by a random dot mask (the color of the dots in the mask varied from light grey to black) that filled the screen until a response was given. A two alternatives forced choice method was used to measure the perceived collinearity between the test and the match line. Participants were asked whether the test line should be moved up or down (or left or right) to appear collinear with the match line; they gave their answer by pressing one of two keys on a PC keyboard (arrow pointing up or down in the vertical arrangement condition, and left or right arrow in the horizontal arrangement condition). At the beginning of the experiment the participants received writ- ten instructions on how to proceed and at the beginning of each block of trials they were told about the arrangement of the two lines (vertical and horizontal) and of the two keys to be used for their responses. The participants chose when to start each block of trials by pressing a key on the keyboard. They were asked to be as accurate as possible in their judgments and no time limit was given. The experiment took approximately 25 minutes to complete. Data Analysis Figure 3(b) shows hypothetical functions representing how collinearity judgments change as a function of line displace- ment relative to true collinearity. The dashed line represents the absence of the illusory effect. The displacement (solid line) along the horizontal axis indicates the magnitude of the illusion. For each participant, the probability of judging the test line to be above or below (or to the left or right of) the point of per- ceived collinearity with the match line was measured as a func- tion of distance from true alignment. Distance from alignment was measured as a percentage displacement relative to the size of the square. A logistic model was applied to the data to calculate the (a) (b) Figure 3. Methods adopted to calculate the illusory effect in Ex- periment 1 and 2. The variant of the Poggendorff Illu- sion used in the present experiment is illustrated on the left (a). The upper and lower segments appear mis- aligned. To achieve perceived collinearity the upper line is usually moved toward the right. On the right, two hypothetical psychometric functions relate proportion of “right” responses as a function of the distance of the line from true alignment (b). The dashed line indicates the absence of an illusory effect, the solid line repre- sents the illusory effect that can be obtained using the display on the left. The magnitude of the illusion is the horizontal shift of the function, i.e. how far the line needs to be moved away from true alignment in order to be perceived as collinear. This is calculated at p = .5. Copyright © 2012 SciRes. 259  A. GALLACE ET AL. Copyright © 2012 SciRes. 260 point of subjective equivalence (PSE) for each observer in each condition. The PSE is the percentage displacement at which the function representing the participants’ responses crosses the 0.5 value (i.e. the point at which the participants judged equally often that the test line had to be moved u p or down (right or left) in order to be aligned with the match line). These values were then submitted to a repeated measures ANOVA. Results and Discussion Figure 4 shows the psychometric functions for each indi- vidual observer (dashed lines) and their average (solid line) for the vertical alignment condition. A greater illusory effect was observed when the angle between the lines and the side of the square measured 60 degrees for both the 9 degree and the 15 degree square sizes (Figure 4 top row), but diminished when the angle increased for both sizes (Figure 4 bottom row). A repeated measures ANOVA was applied to the PSEs cal- culated on the data of each individual observer in each condi- tion: arrangement (horizontal and vertical), size of the test fig- ure (9 and 15 deg of visual angle) and angle (60 degrees and 75 degrees) as factors. This analysis revealed a significant main effect of angle [F(1,10) = 82.05; p < .0001], but not of size [F(1,10) < 1; n.s.], nor of arrangement [F(1,10) < 1; n.s.]. None of the interactions were significant [All F(1,10) <1; n.s.]. The illusory effect was greater for the 60 degrees angle than for the 75 degrees angle between the test stimulus and the inducing figure (see Figure 5). Given that the PSEs were calculated as a percentage dis- placement of relative to the square size, the absence of the main effect of size indicates that the computation was invariant along the size dimension. Experiment 1 showed a significant difference between the two angles adopted, suggesting a role for the linear distance between the parallels and the distance between the two seg- ments. In fact, changing the orientation changes the veridical linear distance between the test line. As a consequence, the effect of angle indicates that this measure enters the length computation responsible for the illusory effect (e.g. assimilation theory), at least under these conditions of stimulus presentation. Experiment 2 As previously stated, tilting the participants’ position by 30 degrees while they observe the Poggendorff, Zollner and Ponzo Illusions, increases the strength of the illusory effects (e.g., Prin- (a) (b) (c) (d) Figure 4. Psychometric functions for each observer (dashed line) and their mean (solid line) for four condi- tions. Individual observers’ data are fitted using a logistic function. The upper row shows the data obtained with an angle of 60 degrees between the test lines and the side of the square for both a 9 degree (a) and a 15 degree wide square (b). The lower row shows the psychometric functions ob- tained with an angle of 75 degrees for squares with a width of 9 degrees (c) and 15 degrees (d). Distance from alignment is expressed as a percentage difference from the point of collinearity which scales with size. Psychometric functions for the 9 and the 15 degree wide squares are closely matched, while the 75 degree angle cur ves look shallower tha n tho se for 60 degree angles. 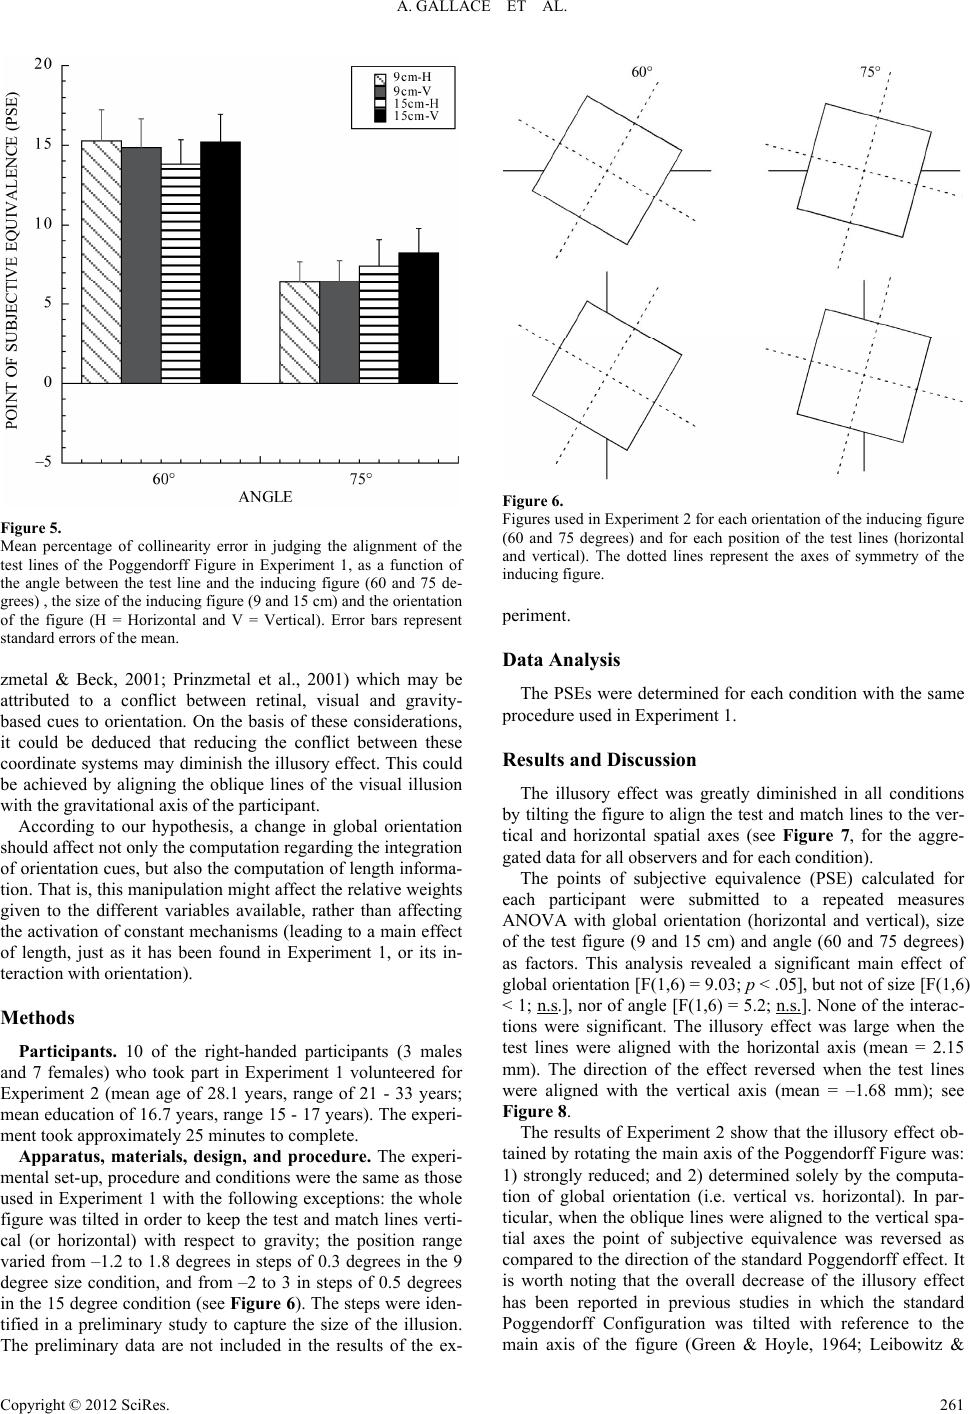 A. GALLACE ET AL. Figure 5. Mean percentage of collinearity error in judging the alignment of the test lines of the Poggendorff Figure in Experiment 1, as a function of the angle between the test line and the inducing figure (60 and 75 de- grees) , the size of the inducing figure (9 and 15 cm) and the orientation of the figure (H = Horizontal and V = Vertical). Error bars represent standard errors of the mean. zmetal & Beck, 2001; Prinzmetal et al., 2001) which may be attributed to a conflict between retinal, visual and gravity- based cues to orientation. On the basis of these considerations, it could be deduced that reducing the conflict between these coordinate systems may diminish the illusory effect. This could be achieved by aligning the oblique lines of the visual illusion with the gravitational axis of the participant. According to our hypothesis, a change in global orientation should affect not only the computation regarding the integration of orientation cues, but also the computation of length informa- tion. That is, this manipulation might affect the relative weights given to the different variables available, rather than affecting the activation of constant mechanisms (leading to a main effect of length, just as it has been found in Experiment 1, or its in- teraction with orientation). Methods Participants. 10 of the right-handed participants (3 males and 7 females) who took part in Experiment 1 volunteered for Experiment 2 (mean age of 28.1 years, range of 21 - 33 years; mean education of 16.7 years, range 15 - 17 years). The experi- ment took approximately 25 minutes to complete. Apparatus, materials, design, and procedure. The experi- mental set-up, procedure and conditions were the same as those used in Experiment 1 with the following exceptions: the whole figure was tilted in order to keep the test and match lines verti- cal (or horizontal) with respect to gravity; the position range varied from –1.2 to 1.8 degrees in steps of 0.3 degrees in the 9 degree size condition, and from –2 to 3 in steps of 0.5 degrees in the 15 degree condition (see Figure 6). The steps were iden- tified in a preliminary study to capture the size of the illusion. The preliminary data are not included in the results of the ex- Figure 6. Figures used in Experiment 2 for each orientation of the inducing figure (60 and 75 degrees) and for each position of the test lines (horizontal and vertical). The dotted lines represent the axes of symmetry of the inducing figure. periment. Data Analysis The PSEs were determined for each condition with the same procedure used in Experiment 1. Results and Discussion The illusory effect was greatly diminished in all conditions by tilting the figure to align the test and match lines to the ver- tical and horizontal spatial axes (see Figure 7, for the aggre- gated data for all observers and for each condition). The points of subjective equivalence (PSE) calculated for each participant were submitted to a repeated measures ANOVA with global orientation (horizontal and vertical), size of the test figure (9 and 15 cm) and angle (60 and 75 degrees) as factors. This analysis revealed a significant main effect of global orientation [F(1,6) = 9.03; p < .05], but not of size [F(1,6) < 1; n.s.], nor of angle [F(1,6) = 5.2; n.s.]. None of the interac- tions were significant. The illusory effect was large when the test lines were aligned with the horizontal axis (mean = 2.15 mm). The direction of the effect reversed when the test lines were aligned with the vertical axis (mean = –1.68 mm); see Figure 8. The results of Experiment 2 show that the illusory effect ob- tained by rotating the main axis of the Poggendorff Figure was: 1) strongly reduced; and 2) determined solely by the computa- tion of global orientation (i.e. vertical vs. horizontal). In par- ticular, when the oblique lines were aligned to the vertical spa- tial axes the point of subjective equivalence was reversed as compared to the direction of the standard Poggendorff effect. It is worth noting that the overall decrease of the illusory effect has been reported in previous studies in which the standard Poggendorff Configuration was tilted with reference to the main axis of the figure (Green & Hoyle, 1964; Leibowitz & Copyright © 2012 SciRes. 261 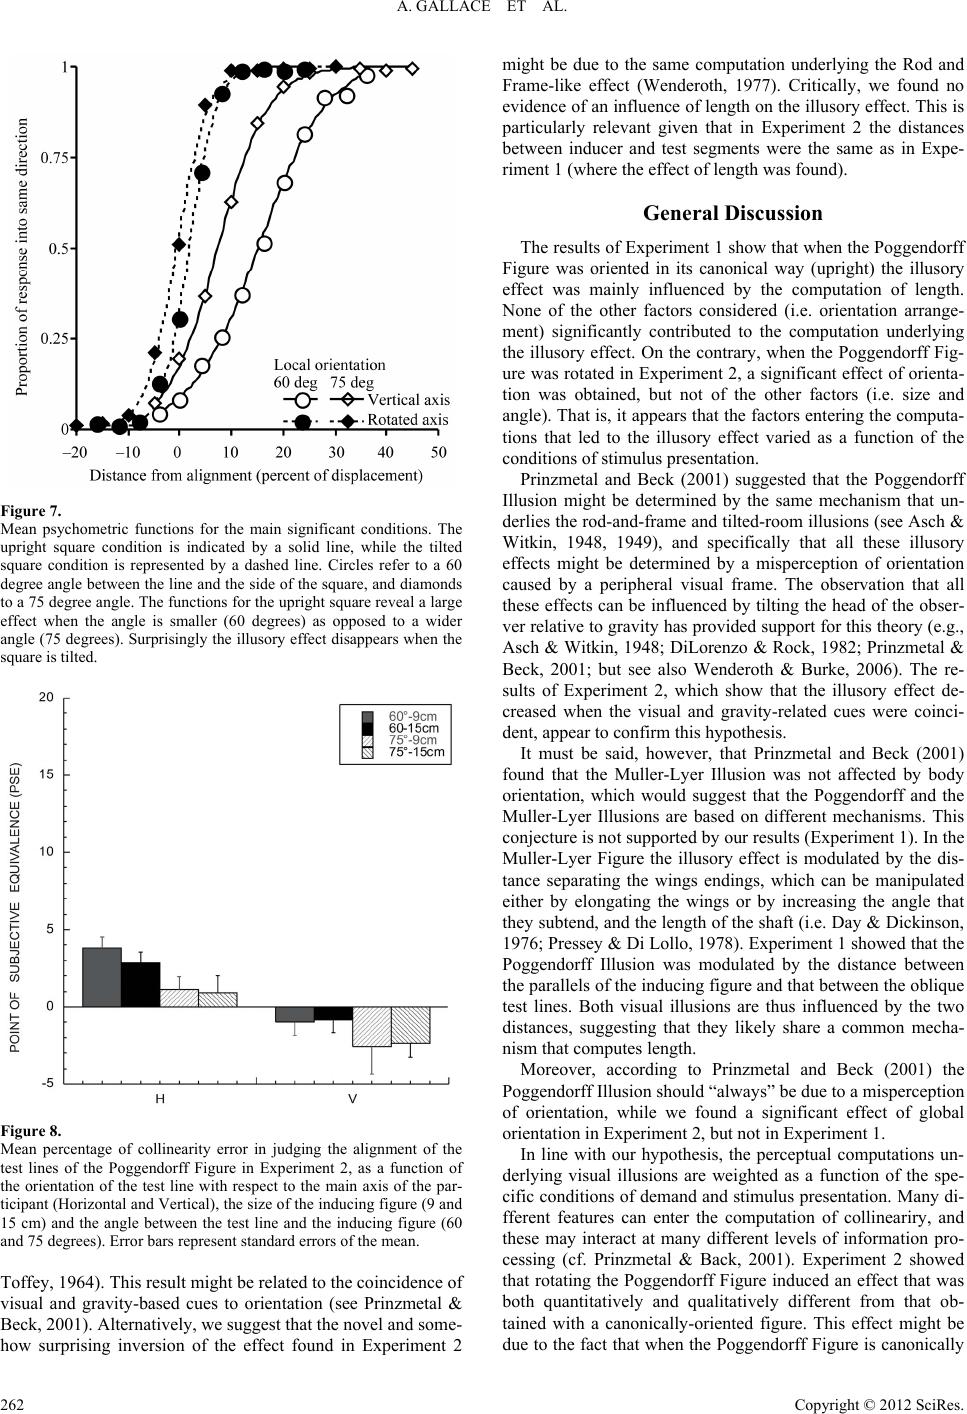 A. GALLACE ET AL. Figure 7. Mean psychometric functions for the main significant conditions. The upright square condition is indicated by a solid line, while the tilted square condition is represented by a dashed line. Circles refer to a 60 degree angle between the line and the side of the square, and diamonds to a 75 degree angle. The functions for the upright square reveal a large effect when the angle is smaller (60 degrees) as opposed to a wider angle (75 degrees). Surprisingly the illusory effect disappears when the square is tilted. Figure 8. Mean percentage of collinearity error in judging the alignment of the test lines of the Poggendorff Figure in Experiment 2, as a function of the orientation of the test line with respect to the main axis of the par- ticipant (Horizontal and Vertical), the size of the inducing figure (9 and 15 cm) and the angle between the test line and the inducing figure (60 and 75 degrees). Error bars represent standard errors of the m ea n. Toffey, 1964). This result might be related to the coincidence of visual and gravity-based cues to orientation (see Prinzmetal & Beck, 2001). Alternatively, we suggest that the novel and some- how surprising inversion of the effect found in Experiment 2 might be due to the same computation underlying the Rod and Frame-like effect (Wenderoth, 1977). Critically, we found no evidence of an influence of length on the illusory effect. This is particularly relevant given that in Experiment 2 the distances between inducer and test segments were the same as in Expe- riment 1 (where the effect of length was found). General Discussion The results of Experiment 1 show that when the Poggendorff Figure was oriented in its canonical way (upright) the illusory effect was mainly influenced by the computation of length. None of the other factors considered (i.e. orientation arrange- ment) significantly contributed to the computation underlying the illusory effect. On the contrary, when the Poggendorff Fig- ure was rotated in Experiment 2, a significant effect of orienta- tion was obtained, but not of the other factors (i.e. size and angle). That is, it appears that the factors entering the computa- tions that led to the illusory effect varied as a function of the conditions of stimulus presentation. Prinzmetal and Beck (2001) suggested that the Poggendorff Illusion might be determined by the same mechanism that un- derlies the rod-and-frame and tilted-room illusions (see Asch & Witkin, 1948, 1949), and specifically that all these illusory effects might be determined by a misperception of orientation caused by a peripheral visual frame. The observation that all these effects can be influenced by tilting the head of the obser- ver relative to gravity has provided support for this theory (e.g., Asch & Witkin, 1948; DiLorenzo & Rock, 1982; Prinzmetal & Beck, 2001; but see also Wenderoth & Burke, 2006). The re- sults of Experiment 2, which show that the illusory effect de- creased when the visual and gravity-related cues were coinci- dent, appear to confirm this hypothesis. It must be said, however, that Prinzmetal and Beck (2001) found that the Muller-Lyer Illusion was not affected by body orientation, which would suggest that the Poggendorff and the Muller-Lyer Illusions are based on different mechanisms. This conjecture is not supported by our results (Experiment 1). In the Muller-Lyer Figure the illusory effect is modulated by the dis- tance separating the wings endings, which can be manipulated either by elongating the wings or by increasing the angle that they subtend, and the length of the shaft (i.e. Day & Dickinson, 1976; Pressey & Di Lollo, 1978). Experiment 1 showed that the Poggendorff Illusion was modulated by the distance between the parallels of the inducing figure and that between the oblique test lines. Both visual illusions are thus influenced by the two distances, suggesting that they likely share a common mecha- nism that computes length. Moreover, according to Prinzmetal and Beck (2001) the Poggendorff Illusion should “always” be due to a misperception of orientation, while we found a significant effect of global orientation in Experiment 2, but not in Experiment 1. In line with our hypothesis, the perceptual computations un- derlying visual illusions are weighted as a function of the spe- cific conditions of demand and stimulus presentation. Many di- fferent features can enter the computation of collineariry, and these may interact at many different levels of information pro- cessing (cf. Prinzmetal & Back, 2001). Experiment 2 showed that rotating the Poggendorff Figure induced an effect that was both quantitatively and qualitatively different from that ob- tained with a canonically-oriented figure. This effect might be due to the fact that when the Poggendorff Figure is canonically Copyright © 2012 SciRes. 262  A. GALLACE ET AL. oriented the square can be used to define the spatial “frame of reference” for the judgment of collinearity. This does not occur when the figure is rotated (note that in this case the main axes of the square are no more aligned with the main visual and gravitational axes), requiring the participant to use another source of information for the collinearity judgment (or to change the relative weights given to any source of information available). That is, the information that is available to the participant at any given time modifies the type of processing that leads to the collinearity judgment. Studies of the Rod and Frame Illusion have shown that the perceived orientation of a rod is an angular function of the ori- entation of the frame that surrounds it (e.g. Gibson & Radner, 1937). This effect has been explained in terms of both the re- pulsion and attraction of the rod towards the axis of symmetry of the frame (e.g. Gibson, 1937; Gibson & Radner, 1937; Wen- deroth, 1977; Wenderoth & van der Zwan, 1991). Specifically, for frame orientations of between 60 and 90 degrees the rod is subjectively perceived as tilted in the direction opposite to that of the frame, with the greatest effect at around 75 degrees (see Wenderoth, 1977). In the vertical condition of Experiment 2 the closest symmetry axis to the vertical is the diagonal of the square, which is taken as the reference for judging the orienta- tion of the test lines. Therefore, in this condition the orientation of the test line is misperceived in the direction opposite to that of the diagonal, resulting in the inversion of the illusory effect. In other words, when the square is considered as the equivalent of a frame and the oblique lines as the equivalents of a rod, the rod-and-frame angular function can accurately predict the di- rection of the Poggendorff Illusory Effect. In our opinion, the Poggendorff Illusion (and probably other illusions) is not the consequence of one or a few specific me- chanisms, but the result of ordinary processing by the general purpose structure/functions of the visual system. Thus it can be assumed that in the Poggendorff Illusion, collinearity judg- ments require both length and orientation computations, but that the presence of gravitational cues: 1) can modify which of the various inputs (visual, gravitational, or proprioceptive) are included in the computation; and 2) can determine the relevance of each input for the computation itself (cf. Ernst & Banks, 2002). On the basis of these observations, we suggest that approa- ches based on single mechanisms or unified theories (Parks, 2009) might not be effective in accounting for visual illusions. We propose instead that the Gestalt approach of explaining visual perception by general perceptual grouping laws can be more useful for this purpose. For example, the concept of “frame of reference”, which refers to the influence of one ob- ject on the perception of the characteristics of another (see Gregory, 1972; Hochberg, 1987; Rock, 1990) is coherent with our results. That is, in the case of our experiments, the inducer, represented by a square, might be considered the main frame of reference on the basis of which the judgments of test lines col- linearity are performed. This frame of reference affects the weight of those variables (length and orientation) which enter the computation at the basis of the Poggendorff Effect. This explanation is not necessarily limited to the Poggen- dorff Configuration. Indeed, our experiments showed that when the square of the Poggendorff Figure was oriented in the up- right position the illusory effect was determined by the compu- tation of length, just as in the Müller-Lyer Illusion (e.g., Coren, 1986). On the other hand, when the square was tilted so that the obliq ue lines were aligned wi th the vert ical and hor izontal a xis, the figure behaved like the Rod-and-Frame Illusion (e.g., Wit- kin & Asch, 1948; Wenderoth, 1977), revealing that orientation computation plays a main role. This result is congruent with the idea that the Muller-Lyer, Poggendorff and Rod and Frame Figures are likely computed on the basis of the same principles of perceptual organization. Acknowledgements R. D. and A. G. were supported by grants from the MIUR to Giuseppe Vallar; M. M. was supported by grants fr om the MIUR to Pierluigi Zoccolotti. Correspondence regarding this article should be addressed to: Roberta Daini, University of Milano- Bicocca, Department of Psychology, Piazza dell’Ateneo Nuovo 1, 20126 Milano, Italy. REFERENCES Asch, S. E., & Witkin, H. A. (1948). Studies in space orientation: II. Perception of the upright with displaced visual fields and with body tilted. Journal of Experimental Psychology, 38, 455-477. doi:10.1037/h0054121 Behrmann, M., & Tipper, S. P. (1999). Attention accesses multiple reference frames: Evidence from visual neglect. Journal of Experi- mental Psychology: Human Perception and Performance, 25, 83-101. doi:10.1037/0096-1523.25.1.83 Blackmore, C., & Carpenter, R. H., & Georgeson, M. A. (1970). Lat- eral inhibition between orientation detectors in the human visual system. Nature, 228, 37-39. doi:10.1038/228037a0 Carlson-Radvansky, L. A., & Logan, G. D. (1997). The influence of reference frame selection on spatial template construction. Journal of Memory and Language, 37, 411-437. doi:10.1006/jmla.1997.2519 Carpenter, R. H. S., & Blakemore, C. (1973). Interactions between orientations in human vision. Experimental Brain Research, 18, 287-303. doi:10.1007/BF00234599 Coren, S., & Girgus, J. S. (1978). Seeing is deceiving: The psychology of visual illusions. Hillsdale, NJ: Lawrence Erlbaum. Day, R. H., & Dickinson, R. G. (1976). Apparent length of the arms of acute and obtuse angles, and the components of the Muller-Lyer illu- sion. Australian Journal of Psychology, 28, 137- 148. doi:10.1080/00049537608254638 Day, R. H., & Jolly, W. J. (1987). A note on apparent displacement of lines and dots on oblique parallels. Perception & Psychophysics, 41, 187-189. doi:10.3758/BF03204880 Day, R. H., Watson, W. L., & Jolly, W. J. (1986). The Poggendorff dis- placement effect with only three dots. Perception & Psychophysics, 39, 351-354. doi:10.3758/BF03203003 De Valois, R. L., & De Valois, K. K. (1990). Spatial vision. Oxford, UK: Oxford University Press. De Valois, K. K., De Valois, R. L., & Yund, E. W. (1979). Responses of striate cortex cells to grating and checkerboard patterns. The Journal of Physiology, 291, 483-505. DiLorenzo, J., & Rock, I. (1982). The rod and frame effect as a func- tion of the righting of the frame. Journal of Experimental Psychology: Human Perception and Performance, 8, 536-546. doi:10.1037/0096-1523.8.4.536 Eagleman, D. M. (2001). Visual illusions and neurobiology. Nature Re- views Neuroscience, 2 , 920-926. doi:10.1038/35104092 Ernst, M. O., & Banks, M. S. (2002). Humans integrate visual and ha- ptic information in a statistically o ptimal way. Nature, 415, 429-433. doi:10.1038/415429a Fineman, M. (1996) Poggendorff’s illusion. In M. Fineman (Ed.), The nature of visual illusi o n ( pp. 151-159). New York: Dover. Gallace, A., & Spence, C. (2005). Examining the crossmodal conse- quences of viewing the Müller-Lyer illusion. Experimental Brain Research, 162, 490-496. doi:10.1007/s00221-004-2130-8 Copyright © 2012 SciRes. 263  A. GALLACE ET AL. Copyright © 2012 SciRes. 264 Gibson, J. J. (1937). Adaptation, after effect and contrast in the percep- tion of the tilted lines: II. Simultaneous contrast and the areal restric- tion of the after effect. Journal of Experimental Psychology, 20, 553- 569. doi:10.1037/h0057585 Gibson, J. J., & Radner, M. (1937). Adaptation, aftereffect and contrast in the perception of the tilted lines: I. Quantitative studies. Journal of Experimental Psychology, 20, 453-467. doi:10.1037/h0059826 Gregory, R. L. (1968). Visual illusions. Scientific American, 219, 66-76. doi:10.1038/scientificamerican1168-66 Hering, E. (1861 ). Beitrage zur psychologie . Leipzig: Engleman. Judd, C. H. (1902). Practice and its effect on the perception of illusions. Psychological Review, 9, 27-39. doi:10.1037/h0073071 Kanizsa, G. (1972). Schrumpfung von visuellen Feldern bei amodaler Erganzung. Studia Psych ologica, 14, 208-210. Kanizsa, G. (1975). Amodal completion and phenomenal shrinkage of surfaces in the visual field. Italian Journal of Psychology, 2, 187- 195. Masini, R., Costa, T., Ferraro, M., & De Marco, A. (1994). Modifica- tions of the Poggendorff effect as a function of random dot textures between the verticals. Perception and Psychophysics, 55, 505-512. doi:10.3758/BF03205308 Matin, L., & Fox, C. R. (1989). Visually perceived eye level and per- ceived elevation of objects: Linerly additive influences from visual field pitch and from gravity. Vision Research, 29, 315-324. doi:10.1016/0042-6989(89)90080-1 Millar, S., & Al-Attar, Z. (2002). The Müller-Lyer illusion in touch and vision: Implications for multisensory processes. Perception & Psy- chophysics, 64, 353-365. doi:10.3758/BF03194709 Parks, T. E. (2009). Demystifying the Poggendorff: A start. Perception, 38, 142-144. doi:10.1068/p5512 Porac, C. (1994). Comparison of the wings-in, wings-out, and Brentano variants of the Müller-Lyer illusion. American Journal of Psychology, 107, 69-83. doi:10.2307/1423290 Predebon, J. (2001). Spatial range of illusory effects in Müller-Lyer figures. Psychologic al Research, 65, 226-234. doi:10.1007/s004260100066 Pressey, A. W., & Sweeney, O. (1972). Acute angles and the Poggen- dorff illusion. Quarterly Journal of Experimental Psychology, 24, 169-174. doi:10.1080/00335557243000049 Pressey, A. W., & Di Lollo, V. (1978). Effects of distance between standard and comparison lines on the Muller-Lyer Illusion. Percep- tion & Psychophysics, 24, 415-419. doi:10.3758/BF03199738 Prinzmetal, W., Shimamura, A. P., & Mikolinski, M. (2001). The Pon- zo illusion and the Tilt-Constancy theory. Perception & Psychophy- sics, 63, 99-114. doi:10.3758/BF03200506 Prinzmetal, W., & Beck, D. M. (2001). The tilt constancy theory of visual illusions. Journal of Experimental Psychology: Human Per- ception and Performance, 27, 206-217. doi:10.1037/0096-1523.27.1.206 Purves, D., & Lotto, B. (2002). Why we see what we do: An empirical theory of vision. Sunder land, MA: Sinauer Associa t es . Rock, I. (1990). The frame of reference. In R. Irvin (Ed.), The legacy of Solomon Asch: Essays in cognition and social psychology (pp. 243- 268). Hillsdale, NJ: Lawrence Erlbaum Associates. Spence, C., & Driver J. (Eds.) (2004). Crossmodal space and crossmo- dal attention. Oxford, UK: Oxford University Press. Weintraub, D., Krantz, D., & Olson , T. (1980). The Poggendorff illus ion: Consider all angles. Journal of Experimental Psychology, 6, 718-725. doi:10.1037/0096-1523.6.4.718 Wenderoth, P. (1974). The distinction between the rod-and-frame illu- sion and the rod-and-frame test. Perception, 3, 205-212. doi:10.1068/p030205 Wenderoth, P. (1977). An analysis of the rod-and-frame illusion and its variants. In R. H. Day, & G. V. Stanley ( Eds.), Studies in perception. Perth: University of Western Australia Press. Wenderoth, P., & Beh, H. (1977). Component analysis of orientation illusions. Perception, 6, 57-75. doi:10.1068/p060057 Wenderoth, P., & van der Zwan, R. (1991). Local and global mecha- nisms of one- and two-dimensional orientation illusions. Perception & Psychophysics, 50, 321-332. doi:10.3758/BF03212224 Wilson, A. E., & Pressey, A. W. (1976). The role of apparent distance in the Poggendoff illusion. Perception and Psychophysics, 20, 309- 316. doi:10.3758/BF03199458 Zanuttini, L. (1973). Una nuova spiegazione dell'illusione di Poggen- dorff. (A new explanation for the Poggendorff illusion). Rivista di Psicologia, 67, 295-314. Zanuttini, L. (1976). A new explanation for the Poggendorff illusion. Perception & Psychophysics, 20, 29-32. doi:10.3758/BF03198700 Zoccolotti, P., Antonucci, G., & Spinelli, D. (1993). The gap between the rod and the frame influences the rod-and-frame effect with small and large inducing displays. Perception & Psychophysics, 4, 14-19.
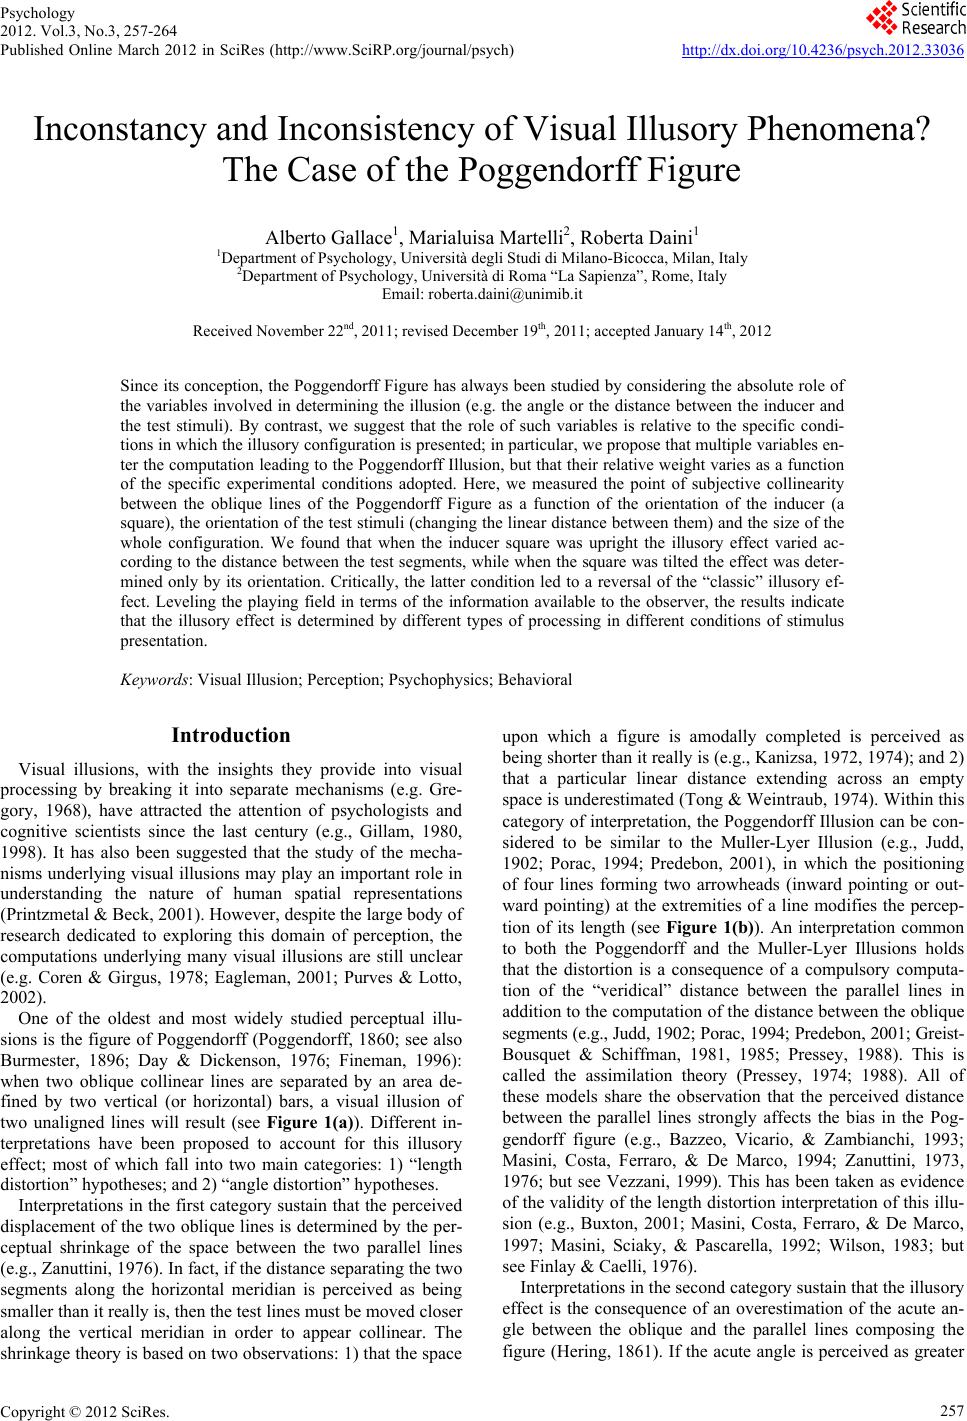
|