Advances in Remote Sensing
Vol.2 No.2(2013), Article ID:33227,12 pages DOI:10.4236/ars.2013.22022
Investigating the Use of Remote Sensing and GIS Techniques to Detect Land Use and Land Cover Change: A Review
1School of Environmental and Rural Science, University of New England, Armidale, Australia
2Department of Geography, Umm Al-Qura University, Makkah, Saudi Arabia
Email: aalquras@myune.edu.au, lkumar@une.edu.au
Copyright © 2013 Abdullah F. Alqurashi, Lalit Kumar. This is an open access article distributed under the Creative Commons Attribution License, which permits unrestricted use, distribution, and reproduction in any medium, provided the original work is properly cited.
Received February 21, 2013; revised March 24, 2013; accepted April 1, 2013
Keywords: Change Detection Techniques; Remote Sensing; GIS; Land Use and Land Cover Change
ABSTRACT
The accuracy of change detection on the earth’s surface is important for understanding the relationships and interactions between human and natural phenomena. Remote Sensing and Geographic Information Systems (GIS) have the potential to provide accurate information regarding land use and land cover changes. In this paper, we investigate the major techniques that are utilized to detect land use and land cover changes. Eleven change detection techniques are reviewed. An analysis of the related literature shows that the most used techniques are post-classification comparison and principle component analysis. Post-classification comparison can minimize the impacts of atmospheric and sensor differences between two dates. Image differencing and image ratioing are easy to implement, but at times they do not provide accurate results. Hybrid change detection is a useful technique that makes full use of the benefits of many techniques, but it is complex and depends on the characteristics of the other techniques such as supervised and unsupervised classifications. Change vector analysis is complicated to implement, but it is useful for providing the direction and magnitude of change. Recently, artificial neural networks, chi-square, decision tree and image fusion have been frequently used in change detection. Research on integrating remote sensing data and GIS into change detection has also increased.
1. Introduction
Change detection is the process of identifying differences in the state of an object or phenomenon by observing it at different times [1]. The time and accuracy of change detection on the earth’s surface can provide a better understanding of the relationships and interactions between human and natural phenomena and can provide guidance in the management of the use of resources. In change detection applications, it is necessary to use multi-temporal datasets to analyze the temporal effects of the object or phenomenon [2]. Currently, with increased computer capability and data availability, Remote Sensing and Geographic Information Systems (GIS) have become effective tools for detecting objects and phenomena change.
Remote Sensing means the ability to detect change on the earth’s surface through space-borne sensors [3]. The repetitive coverage of satellite images and the improvement of image quality can provide valuable assistance in the identification of changes [4]. Temporal and spatial resolutions allow scientists to monitor and detect changes over a broad scale and help planners to obtain or maintain information on various phenomena, such as shifting agricultural patterns, crop stress, disaster monitoring, land use and land cover changes [5].
Geographic Information System is a useful tool for measuring the change between two or more time periods. It has the ability to incorporate multi-sources of data into a change detection platform [2]. For example, the use of multiple layers, such as classified images, topographical maps, soil maps and hydrological maps, provides a greater ability to extract useful information about the changes over a particular area. Moreover, GIS can measure the trends in these changes by modeling the available data and using statistical and analytical functions. The benefit of GIS is the provision of different outputs in different formats (e.g. maps or tables), which allows users to select the appropriate output for extracting the desired information.
Remotely sensed data and GIS are widely used for detecting land use and land cover changes. Many studies have attempted to use remotely sensed data and GIS to address land use change detection e.g. [6-9]. A variety of procedures or methods of Remote Sensing technologies are used to detect land use and land cover changes. Some studies have actually utilized Remote Sensing techniques; others have integrated remotely sensed data with GIS data e.g. [10-12]. In addition, many studies have reviewed and summarized the various change detection techniques [1,2,5,13-15]. The articles reviewed here consider these change detection techniques in many applications, including land use and land cover changes, vegetation and forest changes, urban changes, environmental changes, crop monitoring, forest fires, deforestation and other applications. Table 1 shows examples of applications that are investigated using change detection techniques.
In this paper, we firstly review the major land use and land cover change detection techniques, including image differencing, image ratioing, change vector analysis (CVA), principal component analysis (PCA), chi-square, post-classification comparison, decision trees, image fusion, hybrid change detection, artificial neural networks (ANN) and Geographic Information Systems (GIS), by giving overview about the characteristics, strengths and weaknesses of each technique. Second, we discuss the importance of accuracy assessment in change detection and the use of different matrices in previous studies. Finally, we evaluate the change detection techniques according to the analysis of related literature.
2. Land Use and Land Cover Change Techniques
2.1. Image Differencing
Image differencing, also referred to as image delta [16], is a simple, easy-to-use technique for implementing and interpreting change detection [17]. It divides the image pixels into two results: change or no change. The process by which these results are obtained involves subtracting a pixel’s digital number on the image for date one from the corresponding pixel’s digital number on the image for date two. The general process for detecting the change in two dates in image differencing is extracting the change of the image of date 2 from the image of date 1 (e.g. image of date 1—image of date 2) [18]. In this technique, it is necessary to select thresholds for determining the changed area [16,19]. However, the image differencing technique cannot provide sufficient information about the change itself. Atmospheric and other non-surface radiance characteristics can affect the results of image differencing [20].
Image differencing is widely utilized for change detection in the geographical environment [16,21-23]. It has been used either as a single-band difference [24] or as a color composite of three bands [25]. Sohl [22] examined five change detection techniques, including univariate image differencing, “enhanced” image differencing, vegetation index differencing, post-classification differencing and change vector analysis, to detect the landscape change in the Abu Dhabi Emirate using Landsat Thematic Mapper (TM) data. He found that the “enhanced” image differencing technique provided the most accurate values of change when compared to other techniques, while change vector analysis was a useful technique for providing rich qualitative detail about the nature of the change. Ridd and Liu [26] compared four techniques for change detection in an urban environment; image differencing, image regression, tasseled cap transformation and chi-square were used. The results showed that the most accurate technique for detecting change was the regression of TM band 3, whereas the image differencing of TM 4 was found to be the least accurate.
In arid and semi-arid environments, red band image differencing is more effective than using the Normalized Difference Vegetation Index (NDVI) for vegetation change detection [27]. Also, Pilon, Howarth [28] concluded that visible red band data provided the most accurate identification of spectral change for their semi-arid

Table 1. Examples of the applications that can be investigated using change detection techniques.
study area in north-western Nigeria in Sub-Sahelian Africa.
2.2. Image Ratioing
Image ratioing is extracting the information between two or more different images by using the same bands of two or more images. For example, to compute changes between two times using band 2, the simple process of image ratioing could be: (Band 2 of t1 divided by Band 2 of t2). It is used to highlight subtle variations between the pixels of the various land covers. In image ratioing, the unchanged pixel takes the same number for both dates with a grey level. The changed pixel takes a different value and is displayed at a lighter or darker level. To display the different changes between two or more images, selecting the appropriate threshold value is important in image ratioing. The image ratioing technique is useful for extracting vegetation cover information. The advantage of this technique is that the effect of shadows, the radiation change, image noise and the sun angle can be reduced [29]. However, there are two major disadvantages: it is difficult to select the threshold value, and the types of changes cannot be analyzed [2].
Image ratioing was used by Howarth and Wickware [30] to generate three different color enhancements—an overlay of band 5, ratios of bands 5 and 7 and a vegetation index. The results showed that the major change was emphasized by using band ratioing and band 5 overlay, which gave additional information about the change, while the vegetation index enhancement results showed less information about the change. Nelson [31] tested three change detection techniques, including image differencing, image ratioing and vegetation index differencing, to determine the most appropriate technique for detecting changes due to gypsy moth defoliation. The results indicated that the vegetation index difference and the band 5 ratio were more accurate for delineation of forest canopy changes than other single bands or band combinations. Prakash and Gupta [32] used image ratioing and the normalized difference vegetation index image and they found that image ratioing provided very useful land use mapping information.
2.3. Change Vector Analysis (CVA)
Change vector analysis can represent both the direction and magnitude of a change. The total change magnitude per pixel  can be computed by determining the Euclidean distance between end points through n-dimensional change space [58]:
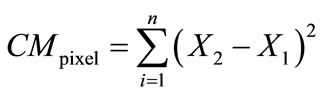 (1)
(1)
where X1 and X2 are date one and date two pixel values in i band.
CVA is complicated to implement, but it is useful for providing information about the change. Change vector analysis was used by Schoppmann and Tyler [46] to monitor changes in and around the Chernobyl nuclear power plant. They concluded that CVA was able to isolate a number of phenomena, including construction and excavation, water level variations, changes in agricultural cover type and riparian vegetation. In addition, change vectors were consistent across both change images. Allen and Kupfer [36] used change vector analysis to examine spruce-fir ecosystems. The results showed the ability of change vectors in multiple biophysical dimensions to differentiate forest disturbance and regeneration trends as an alternative to nominal forest or land cover classifications. Berberoglu and Akin [59] used four change detection techniques, including image differencing, image ratioing, image regression and CVA to detect land use and land cover change in a Mediterranean environment. The results showed that CVA was the most accurate technique for handling the variability present in Mediterranean land use and land cover change.
Combining CVA with other techniques provides more information than either technique alone. For example, Silapaswan, Verbyla [37] used CVA, unsupervised classification and visual interpretation of aerial photographs to detect land cover changes on the Seward Peninsula. They found that, in a transitional region between tundra and boreal forest, the use of CVA and unsupervised classification together provided a more powerful interpretation of change than either method alone.
2.4. Principle Component Analysis (PCA)
Principle component analysis, also referred to as eigenvector transformation, Hotelling transformation and Karhunen Loeve transformation in remote sensing, is a multivariate technique [60] that is used to reduce dataset dimensionality. In this technique, the original remote sensing dataset, which is a correlated variable, is transformed into a simpler dataset for interpretation. This allows the dataset to be uncorrelated variables representing the most important information from the original [15]. The calculation of the variance-covariance matrix (C) of multiband images is expressed as:
 (2)
(2)
where M and X are the multiband image mean and individual pixel value vectors respectively, and n is the number of pixels.
In change detection, there are two ways to apply PCA. The first method is adding two image dates to a single file, and the second methods is subtracting the second image date from the corresponding image of the first date after performing PCA separately. The disadvantages of PCA can be grouped into three issues: 1) it requires the selection of thresholds for identifying the change; 2) PCA results are difficult to interpret and label; and 3) it does not provide a complete matrix of change class [2].
Principal components analysis has been used in the case of land use and land cover change detection using standardized methods. For example, Baronti, Carla [33] applied PCA to investigate the changes occurring in multi-temporal polarimetric synthetic aperture radar (SAR) images. They used correlation instead of a covariance matrix in the transformation to reduce gain variations that are introduced by the imaging system and that give weight to each polarization. In another example, Liu, Nishiyama [43] compared four techniques, including image differencing, image ratioing, image regression and PCA, from a mathematical perspective. They recognized that standardized PCA achieved the best performance for change detection. Standardized PCA is better than unstandardized PCA for change detection because, if the images subjected to PCA are not measured in the same scale, the correlation matrix normalizes the data onto the same scale [61].
2.5. Chi-Square Transformation
Chi-square transformation uses multi-bands together to produce a single change image. The original chi-square test, also referred to as Pearson’s chi-square, was presented by Karl Pearson in early 1990s [62]. Ridd and Liu [26] introduced the chi-square formula that is currently used in change detection:
 (3)
(3)
where Y is the digital value of the changed image; X is the vector of the difference of the six digital values between the two dates; M is the vector of the mean residuals of each band; T is the transverse of the matrix; and  is the inverse covariance matrix of the six bands [2]. Y is distributed as a chi-square random variable with P degrees of freedom, where P is the number of bands when
 , meaning no change. Chi-square can produce a single change image from multiple bands. However, it is not true that
  represents an unchanged pixel when a large portion of the image is changed. In addition, a change related to a specific spectral direction is difficult to identify [2].
The chi-square transformation change detection technique was introduced by Ridd and Liu [26]. They also used other digital change detection techniques, including image differencing, image regression, and tasseled cap transformation. Chi-square was used with six reflective bands to create a single band change image.
2.6. Post-Classification Comparison
Post-classification comparison is a useful technique for extracting land use and land cover information. It is a common method in change detection. Post-classification requires the comparison of independently produced classified changes. It could be that the produced map shows the complete matrix of changes by coding the classification results for time 1 and time 2. Moreover, the subset of changes is observed by selective grouping of the classification results. In post-classification comparison, the images are classified separately, pixel by pixel, on two dates, minimizing the atmospheric and sensor differences between the two dates. In addition, the accurate registration problem of multi-date images is reduced in this technique [1]. However, a great deal of time and expertise is required for the performance of post-classification comparison and the quality of the classified image for each date affects the final accuracy.
Post-classification comparison includes two scheme classification and unsupervised classification algorithms. Supervised classification is a process when the analyst selects a number of areas for an image and then identifies the type of each phenomenon on the computer screen. In accordance with the phenomenon identified by the analyst, the computer identifies the characteristics of the data that comprise each type, and classifies the most similar remaining image pixels [14]. Supervised classification usually requires training data and prior knowledge of the objects that are selected for classification.
Unsupervised classification is a process by which the computer partitions the data without prior knowledge and then applies thematic labels [14]. Unsupervised classification does not normally require training data nor further initial input from the analyst [15].
Post-classification comparison is the most commonly used technique in change detection. [6,21,41,63-69]. The advantage of post-classification was recognized by Mas [70], who compared six change detection techniques to monitor land cover change. These techniques included image differencing, vegetative index differencing, selective PCA, direct multi-date unsupervised classification, post-classification differencing and a combination of image enhancement and post-classification comparison. He concluded that post-classification comparison was the most accurate procedure and presented the advantage of indicating the nature of the changes. Schulz, Cayuela [71] utilized post-classification for investigating land cover changes in dry-land forest landscapes in Central Chile. The maximum likelihood algorithm was used to provide a consistent classifier for multi-date classification. They indicated that the classification accuracy increased, especially after applying the post-classification procedure.
Combining classification with other techniques, such as classification with NDVI, or classification with PCA and CVA, has also been used in some studies to increase classification accuracy as well as to avoid the leak of training sample sets for image classification. For example, Li and Yeh [72] combined interactive supervised maximum likelihood classification with combined PCA to prevent over-estimation of the amount of change. Abd El-Kawy, Rød [73] also used map interpretation to improve classification accuracy and to identify areas with effective use of water for irrigation and areas of private land reclamation.
Unsupervised classification was performed to determine the change in eelgrass meadows with Landsat TM data by Macleod and Congalton [74]. They used three techniques including post-classification, image differencing and PCA. Classification was separately performed for each image using both supervised and unsupervised methods. Brink and Eva [75] also used an unsupervised classification algorithm to monitor 25 years of land cover change dynamics in Africa.
2.7. Artificial Neural Networks (ANNs)
A neural network is a computing process that provides a solution through an unstructured approach founded on the adjustment of the weights connecting the neurons in a network. The concept of a neuron was inspired by the study of biological neural processing [76].
There are three types of layers-an input layer, a hidden layer and an output layer-in which an artificial neural network (ANN) is typically contained. In the input layer, the neurons can be the multispectral reflectance values for each pixel with their texture, e.g. elevation, slope and aspect. In the hidden layers, the use of neurons enables the simulation of nonlinear patterns in the input data. And lastly, in the output layer, the neuron represents a single thematic map for each individual land cover class e.g. agricultural or urban. Each one of these layers consists of interconnected nodes. That interconnection allows the different information to flow in multiple directions [15]. The back-propagation algorithm is used to train the multi-layer perceptron neural model [2].
To extract useful information from the remotely sensed data and ancillary data, the ANN requires training and testing classifications [15]. However, an ANN is sensitive to the amount of training data that is used and requires a long training time. Moreover, ANNs are not common in remote sensing software [2].
Using ANNs in remote sensing has been widely recognized by many researchers [34,35,77-80]. They have also been used to detect changes in many applications. For example, Foody, McCULLOCH [34] utilized a feedforward ANN using a variant of the back-propagation algorithm to classify agricultural crops from synthetic aperture radar data and found that the ANN was able to characterize classes better than discriminant analysis. The ANN was used to classify image data into from-to classes for detecting urban change. Principle component analysis was also applied to extract the salient features and reduce the dimensionality of the input data prior to the ANN-based change detection. By using an ANN, the accuracy increased more than with post-classification comparison. Principle component analysis also improved change detection accuracy [38]. Artificial neural networks have been used to map land use and land cover change with a combination of satellite sensor data and GIS. The ANN approach was used to generate land use and land cover classes from ancillary and spectral data [81]. This combination increased the accuracy of classification compared with spectral classification alone and established relationships between land use and land cover and environmental variables specific to the mapped area.
2.8. Hybrid Change Detection
A hybrid technique uses two or more techniques (e.g. supervised and unsupervised classification, PCA and CVA) to detect a change. There are two types of hybrid techniques. The first type is procedure-based hybrid analysis, which involves the use of different detection techniques in different detection procedures. The second type is result-based hybrid analysis, which means using different change detection techniques successively and then analyzing the results. This technique makes full use of the benefits of many techniques to obtain significant change detection results. On the other hand, the hybrid change detection technique is complex, difficult to perform and not very effective because it depends on the characteristics of other techniques [82].
Hybrid change detection, combining the advantages of supervised and unsupervised classification, was used to derive a land cover map from three Landsat Thematic Mapper Plus (ETM+) images from the year 2000 in three Eastern Europe countries (Slovakia, Poland and the Ukraine). The results were more accurate than using individual techniques [7]. The same results were obtained by Zhang, Ma [83], who used hybrid change detection and a decision tree classifier based on a data mining algorithm. The results showed better accuracy than using individual change detection techniques.
2.9. Image Fusion
Image fusion is a technology that merges two or more images from the same area in different sensors and wavelengths [61,84]. In general, different spectral and spatial resolutions are helpful when high spectral resolution is used in discriminating land use and land cover type, whereas high spatial resolution holds advantages in identifying terrain features and the earth’s structure. The purpose of using image fusion is to provide additional information to help users detect and identify targets on the earth’s surface. Image fusion can be implemented along with PCA, the intensity hue-saturation (HIS) transform, Brovey’s methods and wavelet transformation to provide more accurate information and at high resolution [61].
The advantage of using image fusion in change detection is that fusion techniques can provide high spatial and spectral resolution, which can easily and effectively allow users to extract land use and land cover information. However, it is obvious that resized and registered images, which are obtained from different sensors, may be difficult to implement. For example, in a fusion image from Landsat TM and a SPOT-5 image, the TM image is resampled at the SPOT size, and then the two images have the same size and are registered before image fusion [61]. Therefore, users should take this point into account before performing fusion technique activities.
In a change detection context, image fusion has been used to detect land use and land cover change over urban areas. For example, Zhou, Huang [40] compared three methods for land cover classification of shaded areas from high spatial resolution imagery in an urban environment, including combined spectral information, linear-correlation correction and multisource data fusion. The results indicated that data fusion achieved better accuracy when compared with combined spectral information and linear-correlation correction. Zeng, Zhang [85] presented the results of different temporal SAR and optical image fusion algorithms for land cover change detection. The data used in their research were from SPOT-5 imagery and RADARSAT-1. Peijun, Sicong [44] used feature and decision level fusion to combine simple change detectors and to build an automatic change detection procedure. This method was tested with multi-temporal CBERS and HJ-1 images. The results were satisfactory and more effective than other methods.
2.10. Decision Tree
A decision tree classifier is an algorithm for the labeling of an unknown pattern using a sequence of decisions [61]. The structure of a decision tree is organized with rules, conditions and hypotheses, where rules and conditions are evaluated in order to test the hypotheses. The concept of a hierarchical (or top-down) decision tree is referred to when each hypothesis appears as the trunk of the tree, each rule is a limb of the tree and each condition is a leaf [15]. A decision tree splits a complex decision into many simpler decisions to obtain a solution that is easier to interpret [86].
There are two approaches in the design of a decision tree. The first one is called the manual design approach; it is based on the user’s knowledge and relies solely on user interaction. The second approach is based on an automatic procedure. The manual design approach is time-consuming and it does not provide satisfactory results, especially when the number of classes is large and there is spectral overlap between classes [61].
Hansen, Defries [87] used decision tree to classify land cover using data for 1992-1993 from the Advanced Very High Resolution Radiometer (AVHRR). Yang, Ren [88] used a comparison of post-classification and knowledgebased decision tree (K-DT) classification to quantify land use and land cover changes in the watershed of the Inner Mongolia Autonomic Region of China using Landsat TM and ETM+ images from 1987 to 2007. The results showed significant modification and conversion of land use and land cover of the watershed over the course of 20 years.
2.11. Geographic Information Systems (GIS)
All the techniques discussed above are based on pixel by pixel change detection analysis of satellite images as well as being based on images only. It is important to use the benefit of collateral information, such as digital elevation models, hydrology and soil maps [15], which can be provided with the extracted information from remotely sensed images into GIS platforms. Thus, the integration of remotely sensed data with GIS data has the potential to improve the accuracy of results. The main advantage of GIS is that changes can be detected more clearly than with other techniques using multi-source data. However, using different source data with different formats and accuracies may affect the change detection results [2].
In recent years, remote sensing and GIS have been commonly integrated for analyzing and mapping land use and land cover changes [9,11,12,89]. Driving land use and land cover change maps into GIS applications has been done using supervised classification algorithms through remotely sensed software [90,91]. Utilizing ancillary data with satellite imagery, (e.g. digital elevation models and soil maps) provides more accuracy in the detection of change [92]. The use of GIS has also been recognized for detecting and mapping land use and land cover changes. Spatial statistical analysis and advanced functions (e.g. hotspots) have been used for change detection [93]. In addition, screen digitizing of satellite images and previous land use and land cover maps have been used to detect land use and land cover change [94, 95].
3. Change Detection Accuracy Assessment
Accuracy assessment is very important for understanding the obtained results and making good decisions. Accuracy is determined by the quality of the thematic information and maps that are obtained from remotely sensed data. Accuracy assessment is required to minimize the common sources of error in remotely sensed data (e.g. sensor systems errors such as detectors and cameras, the movement of spacecraft platforms, ground control errors and classification errors). The statistical methods used to assess the accuracy of land cover maps include overall accuracy, user’s accuracy, producer’s accuracy and the Kappa coefficient.
The consideration of classification errors is common in previous studies and reviews [96-102]. Image classification is subject to a variety of errors that occur during the classification process. The difference between the class label assigned by the classification and objects in the real field is significant error. In this case, an error matrix provides an appropriate summary of the omission and commission errors [98]. An error matrix or a confusion matrix and its measures, such as user’s accuracy and producer’s accuracy, is the most common approach for determining the accuracy of remote sensing image classification [96,103].
Change detection accuracy assessment is particularly difficult and requires a large amount of work [104]. The matrices that are most commonly used are single date error matrices, binary change/no change error matrices and the transition error matrix. However, the transition error matrix is less commonly reported than single date error matrices and binary change/no change error matrices [105]. The single date classification error matrix needs to be adapted to a change detection error matrix. The characteristics of the new matrix are the same as the single date classification error matrix and assesses errors in changes between two time periods (time 1 and time 2) [104].
Many previous studies on change detection failed to provide the required information to produce a stratified estimator of change area and construct confidence intervals [106]. It is not possible to check whole mapped areas; sampling is the means from which accuracy from land cover maps can be derived [107]. Thematic map accuracy assessment begins with the generation of an error matrix. The factors that should be considered in the generation of an error matrix include ground data collection, classification and sample scheme, sample size and sample unit, and spatial autocorrelation [108]. It is sometimes possible to reduce or remove ground data errors or to derive accurate estimates of change detection without ground data [109].
4. Evaluation of Change Detection Techniques
Providing details and determining the direction of change is important. Some change detection techniques, such as image differencing, image ratioing, and PCA, do not provide sufficient change trend information. These techniques only provide change or no change results, therefore, the trend and direction of the change is difficult to determine. Other techniques, such as post-classification comparison, provide more detail about the objects that are selected and provide more information about change trends (Table 2).
In addition, some change detection techniques, such as image differencing, image ratioing, PCA, chi-square, hybrid change detection and CVA, require the selection of a threshold (Table 2) [19]. In this case, selecting an appropriate threshold is important for obtaining good change detection results; however, selecting a suitable threshold is difficult and time-consuming. On the other hand, some techniques are affected by errors and require more time and effort to reduce such errors in order to produce high-quality thematic change detection maps. For example, post-classification comparison always contains omission and commission errors and needs the selection of a confusion matrix and its measures (e.g. user’s and producer’s accuracy) to minimize these errors.
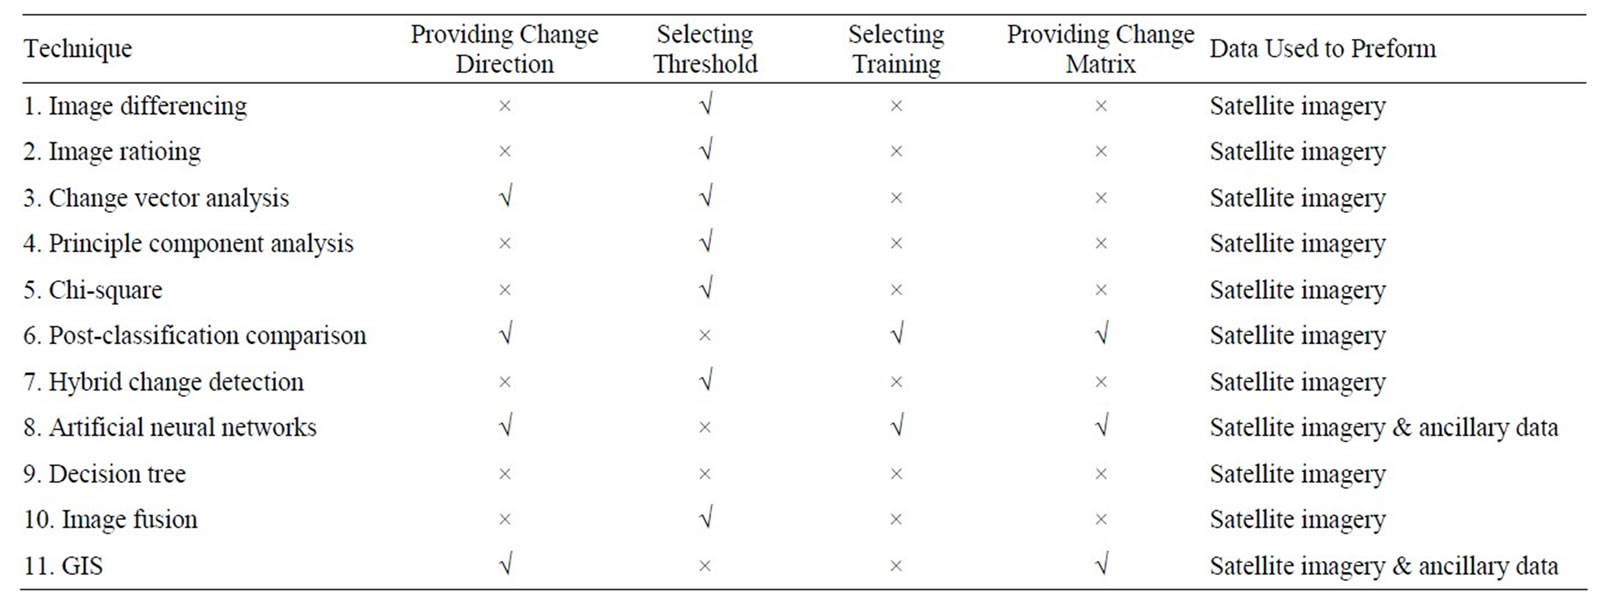
Table 2. Characteristics of change detection techniques.
Furthermore, the strengths and limitations of individual change detection techniques should be taken into account. For example, post-classification comparison minimizes the impacts of atmospheric, sensor and environmental differences between multi-temporal images; image differencing is affected by these elements. Also, image ratioing can reduce the impact of sun angle, shadow and topography. Image differencing and image ratioing allow for easy interpretation of change detection results, whereas the results of principle component analysis are difficult to interpret. The use of additional data, such as digital elevation models, soil and hydrology maps, with satellite imagery may provide additional information about a change. However, the accuracy of different data may affect the quality of land use and land cover change results. It is also important to consider the level of difficulty in dealing with the various functions and software. For example, the limitation of ANNs could be in their functions, which are not common in image processing software [2].
5. Summary
By analyzing the related literature, it seems that no one technique is suitable for all cases. Selection of an appropriate method for detecting change in an object or a phenomenon on the earth’s surface depends on a number of elements, including the characteristics of the study area, the spatial resolution of the sensor, atmospheric effects and sun angle, which should be taken into account before applying a suitable technique for the detector. Furthermore, the characteristics objects themselves should be considered before selecting a method because some of these techniques showed more powerful in some cases than others. For instance, for detecting vegetation cover in arid environments, image differencing is more effective than Normalized Difference Vegetation Index. Also, post-classification comparison is useful in two ways. It provides details of changes, and avoids selecting appropriate thresholds. The accuracy of change detection results can be affected by these elements, as well as the resolution of spatial and spectral images.
Research using change detection techniques should consider the elements that may affect the results. Moreover, researchers should provide a quantitative analysis of the results with their conclusions. Many of the studies reviewed failed to do this; as these studies compare the performance of change detection techniques, there was no ground reference for accuracy assessment. It is necessary to link the results obtained using change detection techniques with the real changes occurring on the ground. Some of the previous studies failed to consider the real changes.
Most of the change detection studies considered the impact of urban expansion on tropical and temperate environments; however, unfortunately, few studies addressed changes in desert environments. Certain elements, including urban expansion and natural factors, may lead to changes in a desert environment. These changes are sometimes challenging to detect using satellite imagery. Vegetation cover, for example, can be easily determined from satellite images in a forested area, but not in a desert area. Therefore, further studies are warranted to apply change detection techniques to desert environments.
REFERENCES
- A. Singh, “Review Article Digital Change Detection Techniques Using Remotely-Sensed Data,” International Journal of Remote Sensing, Vol. 10, No. 6, 1989, pp. 989- 1003. doi:10.1080/01431168908903939
- D. Lu, et al., “Change Detection Techniques,” International Journal of Remote Sensing, Vol. 25, No. 12, 2004, pp. 2365-2401. doi:10.1080/0143116031000139863
- T. Ramachandra and U. Kumar, “Geographic Resources Decision Support System for Land Use, Land Cover Dynamics Analysis,” Proceedings of the FOSS/GRASS Users Conference, Bangkok, September 2004.
- J. R. E. Jensen, “Urban/Suburban Land Use Analysis,” American Society of Photogrammetry, Falls Church, Virginia, Vol. 2, 1983, pp. 1571-1666.
- J. Rogan and D. M. Chen, “Remote Sensing Technology for Mapping and Monitoring Land-Cover and Land-Use Change,” Progress in Planning, Vol. 61, No. 4, 2004, pp. 301-325. doi:10.1016/S0305-9006(03)00066-7
- E. Brondizio, et al., “Land Use Change in the Amazon Estuary: Patterns of Caboclo Settlement and Landscape Management,” Human Ecology, Vol. 22, No. 3, 1994, pp. 249-278. doi:10.1007/BF02168853
- T. Kuemmerle, et al., “Cross-Border Comparison of Land Cover and Landscape Pattern in Eastern Europe Using a Hybrid Classification Technique,” Remote Sensing of Environment, Vol. 103, No. 4, 2006, pp. 449-464. doi:10.1016/j.rse.2006.04.015
- R. Pelorosso, et al., “Land Cover and Land Use Change in the Italian Central Apennines: A Comparison of Assessment Methods,” Applied Geography, Vol. 29, No. 1, 2009, pp. 35-48. doi:10.1016/j.apgeog.2008.07.003
- R. B. Thapa and Y. Murayama, “Urban Mapping, Accuracy, & Image Classification: A Comparison of Multiple Approaches in Tsukuba City, Japan,” Applied Geography, Vol. 29, No. 1, 2009, pp. 135-144. doi:10.1016/j.apgeog.2008.08.001
- W. Z. Michalak, “GIS in Land Use Change Analysis: Integration of Remotely Sensed Data into GIS,” Applied Geography, Vol. 13, No. 1, 1993, pp. 28-44. doi:10.1016/0143-6228(93)90078-F
- Q. Weng, “A Remote Sensing GIS Evaluation of Urban Expansion and Its Impact on Surface Temperature in the Zhujiang Delta, China,” International Journal of Remote Sensing, Vol. 22, No. 10, 2001, pp. 1999-2014. doi:10.1080/01431160118847
- J. Rogan, et al., “Integrating GIS and Remotely Sensed Data for Mapping Forest Disturbance and Change,” In: M. A. Wulder and S. E. Franklin, Eds., Understanding Forest Disturbance and Spatial Pattern: Remote Sensing and GIS Approaches, 2007, pp. 133-171.
- D. A. Mouat, et al., “Remote Sensing Techniques in the Analysis of Change Detection,” Geocarto International, Vol. 8, No. 2, 1993, pp. 39-50. doi:10.1080/10106049309354407
- P. Deer, “Digital Change Detection Techniques in Remote Sensing,” DTIC Document, 1995.
- J. R. Jensen, “Introductory Digital Image Processing: A Remote Sensing Perspective,” In: K. C. Clarke, Ed., 3rd Edition, Prentice Hall, The United States of America, 2005.
- D. M. Muchoney and B. N. Haack, “Change Detection for Monitoring Forest Defoliation,” Photogrammetric Engineering and Remote Sensing, Vol. 60, No. 10, 1994, pp. 1243-1251.
- S. S. Podeh, et al., “Forest Change Detection in the North of Iran Using TM/ETM+ Imagery,” Asian Journal of Applied Sciences, Vol. 2, No. 6, 2009, pp. 464-474. doi:10.3923/ajaps.2009.464.474
- M. Jahari, et al., “Change Detection Studies in Matang Mangrove Forest Area, Perak,” Pertanika Journal of Science and Technology, Vol. 19, No. 2, 2011, pp. 307-327.
- P. L. Rosin and T. Ellis, “Image Difference Threshold Strategies and Shadow Detection,” Proceedings of the 6th British Machine Vision Conference, Citeseer, 1995.
- P. A. Rogerson, “Change Detection Thresholds for Remotely Sensed Images,” Journal of Geographical Systems, Vol. 4, No. 1, 2002, pp. 85-97. doi:10.1007/s101090100076
- R. Weismiller, et al., “Change Detection in Coastal Zone Environments,” Photogrammetric Engineering and Remote Sensing, Vol. 43, No. 12, 1977, pp. 1533-1539.
- T. L. Sohl, “Change Analysis in the United Arab Emirates: An Investigation of Techniques,” Photogrammetric Engineering and Remote Sensing, Vol. 65, No. 4, 1999, pp. 475-484.
- H. A. Afify, “Evaluation of Change Detection Techniques for Monitoring Land-Cover Changes: A Case Study in New Burg El-Arab Area,” Alexandria Engineering Journal, Vol. 50, No. 2, 2011, pp. 187-195. doi:10.1016/j.aej.2011.06.001
- J. R. Jensen and D. Toll, “Detecting Residential Land-Use Development at the Urban Fringe,” Photogrammetric Engineering & Remote Sensing, Vol. 48, No. 4, 1982, pp. 629-643.
- D. Williams and M. Stauffer, “Monitoring Gypsy Moth Defoliation by Applying Change Detection Techniques to Landsat Imagery,” Proceeding of the Sympsium on Vegetation Damage Assessment, American Society of Photogammetry, Falls Church, 1978, pp. 221-229.
- M. K. Ridd and J. Liu, “A Comparison of Four Algorithms for Change Detection in an Urban Environment,” Remote Sensing of Environment, Vol. 63, No. 2, 1998, pp. 95-100. doi:10.1016/S0034-4257(97)00112-0
- P. S. Chavez and D. J. MacKinnon, “Automatic Detection of Vegetation Changes in the Southwestern United States Using Remotely Sensed Images,” Photogrammetric Engineering and Remote Sensing, Vol. 60, No. 5, 1994, pp. 571-583.
- P. Pilon, et al., “An Enhanced Classification Approach to Change Detection in Semi-Arid Environments,” Photogrammetric Engineering and Remote Sensing, Vol. 54, No. 12, 1988, pp. 1709-1716.
- H. Alphan, “Comparing the Utility of Image Algebra Operations for Characterizing Landscape Changes: The Case of the Mediterranean Coast,” Journal of Environmental Management, Vol. 92, No. 11, 2011, pp. 2961- 2971. doi:10.1016/j.jenvman.2011.07.009
- P. J. Howarth and G. M. Wickware, “Procedures for Change Detection Using Landsat Digital Data,” International Journal of Remote Sensing, Vol. 2, No. 3, 1981, p. 277-291. doi:10.1080/01431168108948362
- R. Nelson, “Detecting Forest Canopy Change Due to Insect Activity Using Landsat MSS,” Photogrammetric Engineering and Remote Sensing, Vol. 49, 1983, pp. 1303- 1314.
- A. Prakash and R. Gupta, “Land-Use Mapping and Change Detection in a Coal Mining Area—A Case Study in the Jharia Coalfield, India,” International Journal of Remote Sensing, Vol. 19, No. 3, 1998, pp. 391-410. doi:10.1080/014311698216053
- S. Baronti, et al. “Principal Component Analysis for Change Detection on Polarimetric Multitemporal SAR Data,” Geoscience and Remote Sensing Symposium, Surface and Atmospheric Remote Sensing: Technologies, Data Analysis and Interpretation, 1994.
- G. M. Foody, et al., “Classification of Remotely Sensed Data by an Artificial Neural Network: Issues Related to Training Data Characteristics,” Photogrammetric Engineering and Remote Sensing, Vol. 61, No. 4, 1995, pp. 391-401.
- J. Jensen, et al., “Predictive Modelling of Coniferous Forest Age Using Statistical and Artificial Neural Network Approaches Applied to Remote Sensor Data,” International Journal of Remote Sensing, Vol. 20, No. 14, 1999, pp. 2805-2822. doi:10.1080/014311699211804
- T. R. Allen and J. A. Kupfer, “Application of Spherical Statistics to Change Vector Analysis of Landsat Data: Southern Appalachian Spruce-Fir Forests,” Remote Sensing of Environment, Vol. 74, No. 3, 2000, pp. 482-493. doi:10.1016/S0034-4257(00)00140-1
- C. Silapaswan, et al., “Land Cover Change on the Seward Peninsula: The Use of Remote Sensing to Evaluate the Potential Influences of Climate Warming on Historical Vegetation Dynamics,” Canadian Journal of Remote Sensing, Vol. 27, No. 5, 2001, pp. 542- 554.
- X. Liu and R. G. Lathrop, “Urban Change Detection Based on an Artificial Neural Network,” International Journal of Remote Sensing, Vol. 23, No. 12, 2002, pp. 2513-2518. doi:10.1080/01431160110097240
- L. Castellana, A. d’Addabbo and G. Pasquariello, “A Composed Supervised/Unsupervised Approach to Improve Change Detection from Remote Sensing,” Pattern Recognition Letters, Vol. 28, No. 4, 2007, pp. 405-413. doi:10.1016/j.patrec.2006.08.010
- W. Zhou, et al., “Object-Based Land Cover Classification of Shaded Areas in High Spatial Resolution Imagery of Urban Areas: A Comparison Study,” Remote Sensing of Environment, Vol. 113, No. 8, 2009, pp. 1769-1777. doi:10.1016/j.rse.2009.04.007
- J. Miettinen, et al., “2010 Land Cover Map of Insular Southeast Asia in 250-m Spatial Resolution,” Remote Sensing Letters, Vol. 3, No. 1, 2011, pp. 11-20. doi:10.1080/01431161.2010.526971
- Q. Zhang, et al., “Urban Built-Up Land Change Detection with Road Density and Spectral Information from MultiTemporal Landsat TM Data,” International Journal of Remote Sensing, Vol. 23, No. 15, 2002, pp. 3057-3078. doi:10.1080/01431160110104728
- Y. Liu, et al., “Analysis of Four Change Detection Algorithms in Bi-Temporal Space with a Case Study,” International Journal of Remote Sensing, Vol. 25, No. 11, 2004, pp. 2121-2139. doi:10.1080/01431160310001606647
- D. Peijun, et al., “Fusion of Difference Images for Change Detection over Urban Areas,” IEEE Journal of Selected Topics in Applied Earth Observations and Remote Sensing, Vol. 5, No. 4, 2012, pp. 1076-1086. doi:10.1109/JSTARS.2012.2200879
- A. J. Peters, et al., “Drought Monitoring with NDVIBased Standardized Vegetation Index,” Photogrammetric Engineering and Remote Sensing, Vol. 68, No. 1, 2002, pp. 71-75.
- M. W. Schoppmann and W. A. Tyler, “Chernobyl Revisited: Monitoring Change with Change Vector Analysis,” Geocarto International, Vol. 11, No. 1, 1996, pp. 13-27. doi:10.1080/10106049609354520
- S. E. Franklin and B. Wilson, “Vegetation Mapping and Change Detection Using SPOT MLA and Landsat Imagery in Kluane National Park,” Canadian Journal of Remote Sensing, Vol. 17, No. 1, 1991, pp. 2-22.
- J. B. Thayn, “Assessing Vegetation Cover on the Date of Satellite-Derived Start of Spring,” Remote Sensing Letters, Vol. 3, No. 8, 2012, pp. 721-728. doi:10.1080/2150704X.2012.674227
- D. Zheng, et al., “Rates and Patterns of Landscape Change between 1972 and 1988 in the Changbai Mountain Area of China and North Korea,” Landscape Ecology, Vol. 12, No. 4, 1997, pp. 241-254. doi:10.1023/A:1007963324520
- W. G. Kepner, et al., “A Landscape Approach for Detecting and Evaluating Change in a Semi-Arid Environment,” Environmental Monitoring and Assessment, Vol. 64, No. 1, 2000, pp. 179-195. doi:10.1023/A:1006427909616
- J. Taylor, et al., “Monitoring Landscape Change in the National Parks of England and Wales Using Aerial Photo Interpretation and GIS,” International Journal of Remote Sensing, Vol. 21, No. 13-14, 2000, pp. 2737-2752. doi:10.1080/01431160050110269
- R. M. Lucas, et al., “Characterizing Tropical Secondary Forests Using Multi-Temporal Landsat Sensor Imagery,” International Journal of Remote Sensing, Vol. 14, No. 16, 1993, pp. 3061-3067. doi:10.1080/01431169308904419
- D. J. Hayes and S. A. Sader, “Comparison of ChangeDetection Techniques for Monitoring Tropical Forest Clearing and Vegetation Regrowth in a Time Series,” Photogrammetric Engineering and Remote Sensing, Vol. 67, No. 9, 2001, pp. 1067-1075.
- E. H. Wilson and S. A. Sader, “Detection of Forest Harvest Type Using Multiple Dates of Landsat TM Imagery,” Remote Sensing of Environment, Vol. 80, No. 3, 2002, pp. 385-396. doi:10.1016/S0034-4257(01)00318-2
- E. J. Christensen, et al., “Aircraft MSS Data Registration and Vegetation Classification for Wetland Change Detection,” International Journal of Remote Sensing, Vol. 9, No. 1, 1988, pp. 23-38. doi:10.1080/01431168808954834
- J. Jensen, et al., “An Evaluation of the Coast Watch Change Detection Protocol in South Carolina,” Photogrammetric Engineering and Remote Sensing, Vol. 59, No. 6, 1993, pp. 1039-1044.
- C. Munyati, “Wetland Change Detection on the Kafue Flats, Zambia, by Classification of a Multitemporal Remote Sensing Image Dataset,” International Journal of Remote Sensing, Vol. 21, No. 9, 2000, pp. 1787-1806. doi:10.1080/014311600209742
- J. L. Michalek, et al., “Multispectral Change Vector Analysis for Monitoring Coastal Marine Environments,” Photogrammetric Engineering and Remote Sensing, Vol. 59, No. 3, 1993, pp. 635-641.
- S. Berberoglu and A. Akin, “Assessing Different Remote Sensing Techniques to Detect Land Use/Cover Changes in the Eastern Mediterranean,” International Journal of Applied Earth Observation and Geoinformation, Vol. 11, No. 1, 2009, pp. 46-53. doi:10.1016/j.jag.2008.06.002
- [61] A. Singh and A. Harrison, “Standardized Principal Components,” International Journal of Remote Sensing, Vol. 6, No. 6, 1985, pp. 883-896. doi:10.1080/01431168508948511
- [62] B. Tso and P. P. Mather, “Classification Methods for Remotely Sensed Data,” 2nd Edition, CRC Press, Boca Raton, 2009. doi:10.1201/9781420090741
- [63] D. C. Howell, “Chi-Square Test-Analysis of Contingency Tables,” Women, Vol. 35, No. 3, 2009, pp. 28-83.
- [64] S. I. Gordon, “Utilizing LANDSAT Imagery to Monitor Land-Use Change: A Case Study in Ohio,” Remote Sensing of Environment, Vol. 9, No. 3, 1980, pp. 189-196. doi:10.1016/0034-4257(80)90028-0
- [65] J. Jensen, et al., “Inland Wetland Change Detection Using Aircraft MSS Data,” Photogrammetric Engineering and Remote Sensing, Vol. 53, No. 5, 1987, pp. 521-529.
- [66] M. U. H. Dimyati, et al., “An Analysis of Land Use/Cover Change in Indonesia,” International Journal of Remote Sensing, Vol. 17, No. 5, 1996, pp. 931-944. doi:10.1080/01431169608949056
- [67] C. Song, et al., “Classification and Change Detection Using Landsat TM Data: When and How to Correct Atmospheric Effects?” Remote Sensing of Environment, Vol. 75, No. 2, 2001, pp. 230-244. doi:10.1016/S0034-4257(00)00169-3
- [68] D. L. Civco, et al., “A Comparison of Land Use and Land Cover Change Detection Methods,” Proceedings of the 2002 ASPRS Annual Convention, Washington DC, 22-26 April 2002.
- [69] J. Aguirre-Gutiérrez, et al., “Optimizing Land Cover Classification Accuracy for Change Detection, a Combined Pixel-Based and Object-Based Approach in a Mountainous Area in Mexico,” Applied Geography, Vol. 34, 2012, pp. 29-37. doi:10.1016/j.apgeog.2011.10.010
- [70] J. O. Sexton, et al., “Long-Term Land Cover Dynamics by Multi-Temporal Classification across the Landsat-5 Record,” Remote Sensing of Environment, Vol. 128, No. 21, 2013, pp. 246-258. doi:10.1016/j.rse.2012.10.010
- [71] J. F. Mas, “Monitoring Land-Cover Changes: A Comparison of Change Detection Techniques,” International Journal of Remote Sensing, Vol. 20, No. 1, 1999, pp. 139- 152. doi:10.1080/014311699213659
- [72] J. J. Schulz, et al., “Monitoring Land Cover Change of the Dryland Forest Landscape of Central Chile (1975- 2008),” Applied Geography, Vol. 30, No. 3, 2010, pp. 436-447. doi:10.1016/j.apgeog.2009.12.003
- [73] X. Li and A. Yeh, “Principal Component Analysis of Stacked Multi-Temporal Images for the Monitoring of Rapid Urban Expansion in the Pearl River Delta,” International Journal of Remote Sensing, Vol. 19, No. 8, 1998, pp. 1501-1518. doi:10.1080/014311698215315
- [74] O. R. Abd El-Kawy, et al., “Land Use and Land Cover Change Detection in the Western Nile Delta of Egypt Using Remote Sensing Data,” Applied Geography, Vol. 31, No. 2, 2011, pp. 483-494. doi:10.1016/j.apgeog.2010.10.012
- [75] R. D. Macleod and R. G. Congalton, “A Quantitative Comparison of Change-Detection Algorithms for Monitoring Eelgrass from Remotely Sensed Data,” Photogrammetric Engineering and Remote Sensing, Vol. 64, No. 3, 1998, pp. 207-216.
- [76] A. B. Brink and H. D. Eva, “Monitoring 25 Years of Land Cover Change Dynamics in Africa: A Sample Based Remote Sensing Approach,” Applied Geography, Vol. 29, No. 4, 2009, pp. 501-512. doi:10.1016/j.apgeog.2008.10.004
- [77] V. B. Rao and H. V. Rao, “C++ Neural Networks and Fuzzy Logic,” MIS-Press, New York, 1993.
- [78] G. Foody and M. Arora, “An Evaluation of Some Factors Affecting the Accuracy of Classification by an Artificial Neural Network,” International Journal of Remote Sensing, Vol. 18, No. 4, 1997, pp. 799-810. doi:10.1080/014311697218764
- [79] J. Benediktsson and J. Sveinsson, “Feature Extraction for Multisource Data Classification with Artificial Neural Networks,” International Journal of Remote Sensing, Vol. 18, No. 4, 1997, pp. 727-740. doi:10.1080/014311697218728
- [80] J. R. Jensen, F. Qiu and K. Patterson, “A Neural Network Image Interpretation System to Extract Rural and Urban Land Use and Land Cover Information from Remote Sensor Data,” Geocarto International, Vol. 16, No. 1, 2001, pp. 21-30. doi:10.1080/10106040108542179
- [81] F. Qiu and J. Jensen, “Opening the Black Box of Neural Networks for Remote Sensing Image Classification,” International Journal of Remote Sensing, Vol. 25, No. 9, 2004, pp. 1749-1768. doi:10.1080/01431160310001618798
- [82] J. F. Mas, “Mapping Land Use/Cover in a Tropical Coastal Area Using Satellite Sensor Data, GIS and Artificial Neural Networks,” Estuarine, Coastal and Shelf Science, Vol. 59, No. 2, 2004, pp. 219-230. doi:10.1016/j.ecss.2003.08.011
- [83] J. Y. G., et al., “A Review of Multi-Temporal Remote Sensing Data Change Detection Algorithms,” The International Archives of the Photogrammetry, Remote Sensing and Spatial Information Sciences, Vol. 37, No. B7, 2008, pp. 757-762.
- [84] Y. Zhang, et al., “Hybrid Change Detection for Watershed Impervious Surface Using Multi-Time Remotely Sensed Data,” IEEE International of Geoscience and Remote Sensing Symposium, Barcelona, 23-28 July 2007, pp. 1939-1942.
- [85] L. Wald, “Some Terms of Reference in Data Fusion,” IEEE Transactions on Geoscience and Remote Sensing, Vol. 37, No. 3, 1999, pp. 1190-1193. doi:10.1109/36.763269
- [86] Y. Zeng, et al., “Image Fusion for Land Cover Change Detection,” International Journal of Image and Data Fusion, Vol. 1, No. 2, 2010, pp. 193-215. doi:10.1080/19479831003802832
- [87] M. Xu, et al., “Decision Tree Regression for Soft Classification of Remote Sensing Data,” Remote Sensing of Environment, Vol. 97, No. 3, 2005, pp. 322-336. doi:10.1016/j.rse.2005.05.008
- [88] M. C. Hansen, et al., “Global Land Cover Classification at 1 km Spatial Resolution Using a Classification Tree Approach,” International Journal of Remote Sensing, Vol. 21, No. 6-7, 2000, pp. 1331-1364. doi:10.1080/014311600210209
- [89] X. Yang, et al., “Impacts of Land Use and Land Cover Changes on Evapotranspiration and Runoff at Shalamulun River Watershed, China,” Hydrology Research, Vol. 43, No. 1-2, 2012, pp. 23-37.
- [90] R. Efe, et al., “Land Use and Land Cover Change Detection in Karinca River Catchment (NW Turkey) Using GIS and RS Techniques,” Journal of Environmental Biology, Vol. 33, No. 2, 2012, pp. 439-447.
- [91] D. Tripathi and M. Kumar, “Remote Sensing Based Analysis of Land Use/Land Cover Dynamics in Takula Block, Almora District(Uttarakhand),” Journal of Human Ecology, Vol. 38, No. 3, 2012, pp. 207-212.
- [92] S. Gajbhiye and S. K. Sharma, “Land Use and Land Cover Change Detection of Indra River Watershed through Remote Sensing Using Multi-Temporal satellite Data,” International Journal of Geomatics and Geosciences, Vol. 3, No. 1, 2012, pp. 89-96.
- [93] S. Reis, “Analyzing Land Use/Land Cover Changes Using Remote Sensing and GIS in Rize, North-East Turkey,” Sensors, Vol. 8, No. 10, 2008, pp. 6188-6202. doi:10.3390/s8106188
- [94] P. P. Serra, et al., “Land-Cover and Land-Use Change in a Mediterranean Landscape: A Spatial Analysis of Driving Forces Integrating Biophysical and Human Factors,” Applied Geography, Vol. 28, No. 3, 2008, pp. 189-209. doi:10.1016/j.apgeog.2008.02.001
- [95] I. Abbas, et al., “Mapping Land Use-Land Cover and Change Detection in Kafur Local Government, Katsina, Nigeria (1995-2008) Using Remote Sensing and GIS,” Research Journal of Environmental and Earth Sciences, Vol. 2, No. 1, 2010, pp. 6-12.
- [96] N. Nagarajan and S. Poongothai, “Effect of Land Use/ Land Cover Change Detection of Ungauged Watershed,” World Applied Sciences Journal, Vol. 17, No. 6, 2012, pp. 718-723.
- [97] R. G. Congalton, “A Review of Assessing the Accuracy of Classifications of Remotely Sensed Data,” Remote Sensing of Environment, Vol. 37, No. 1, 1991, pp. 35-46. doi:10.1016/0034-4257(91)90048-B
- [98] C. Conese and F. Maselli, “Use of Error Matrices to Improve Area Estimates with Maximum Likelihood Classification Procedures,” Remote Sensing of Environment, Vol. 40, No. 2, 1992, pp. 113-124. doi:10.1016/0034-4257(92)90009-9
- [99] G. M. Foody, “Status of Land Cover Classification Accuracy Assessment,” Remote Sensing of Environment, Vol. 80, No. 1, 2002, pp. 185-201. doi:10.1016/S0034-4257(01)00295-4
- [100] R. Latifovic and I. Olthof, “Accuracy Assessment Using Sub-Pixel Fractional Error Matrices of Global Land Cover Products Derived from Satellite Data,” Remote Sensing of Environment, Vol. 90, No. 2, 2004, pp. 153-165. doi:10.1016/j.rse.2003.11.016
- [101] H. Liu and Q. Zhou, “Accuracy Analysis of Remote Sensing Change Detection by Rule-Based Rationality Evaluation with Post-Classification Comparison,” International Journal of Remote Sensing, Vol. 25, No. 5, 2004, pp. 1037-1050. doi:10.1080/0143116031000150004
- [102] C. Liu, et al., “Comparative Assessment of the Measures of Thematic Classification Accuracy,” Remote Sensing of Environment, Vol. 107, No. 4, 2007, pp. 606-616. doi:10.1016/j.rse.2006.10.010
- [103] P. P. L. Zimmerman, et al., “An Accuracy Assessment of Forest Disturbance Mapping in the Western Great Lakes,” Remote Sensing of Environment, Vol. 128, No. 21, 2013, pp. 176-185. doi:10.1016/j.rse.2012.09.017
- [104] A. Comber, et al., “Spatial Analysis of Remote Sensing Image Classification Accuracy,” Remote Sensing of Environment, Vo. 127, 2012, pp. 237-246. doi:10.1016/j.rse.2012.09.005
- [105] R. G. Congalton and K. Green, “Assessing the Accuracy of Remotely Sensed Data: Principles and Practices,” 2th Edition, CRC Press, Boca Raton, 2008. doi:10.1201/9781420055139
- [106] P. A. J. van Oort, “Interpreting the Change Detection Error Matrix,” Remote Sensing of Environment, Vol. 108, No. 1, 2007, pp. 1-8. doi:10.1016/j.rse.2006.10.012
- [107] P. P. Olofsson, et al., “Making Better Use of Accuracy Data in Land Change Studies: Estimating Accuracy and Area and Quantifying Uncertainty Using Stratified Estimation,” Remote Sensing of Environment, Vol. 129, No. 15, 2013, pp. 122-131. doi:10.1016/j.rse.2012.10.031
- [108] G. Banko, “A Review of Assessing the Accuracy of Classifications of Remotely Sensed Data and of Methods Including Remote Sensing Data in Forest Inventory,” International Institute for Applied Systems Analysis, Laxenburg, 1998.
- [109] R. G. Congalton, et al., “Quality Assurance and Accuracy Assessment of Information Derived from Remotely Sensed Data,” In: J. D. Bossler, Ed., Manual of Geospatial Science and Technology, CRC Press, London, 2001, pp. 349-361.
- [110] G. M. Foody, “Assessing the Accuracy of Land Cover Change with Imperfect Ground Reference Data,” Remote Sensing of Environment, Vol. 114, No. 10, 2010, pp. 2271-2285. doi:10.1016/j.rse.2010.05.003