Journal of Applied Mathematics and Physics
Vol.2 No.7(2014), Article
ID:47024,9
pages
DOI:10.4236/jamp.2014.27071
Control Schemes to Reduce Risk of Extinction in the Lotka-Volterra Predator-Prey Model
Jessica Li
Kent Place School, Summit, USA
Email: jessicali1997@gmail.com
Copyright © 2014 by author and Scientific Research Publishing Inc.
This work is licensed under the Creative Commons Attribution International License (CC BY).
http://creativecommons.org/licenses/by/4.0/


Received 24 March 2014; revised 26 April 2014; accepted 3 May 2014
ABSTRACT
The Lotka-Volterra predator-prey model is widely used in many disciplines such as ecology and economics. The model consists of a pair of first-order nonlinear differential equations. In this paper, we first analyze the dynamics, equilibria and steady state oscillation contours of the differential equations and study in particular a well-known problem of a high risk that the prey and/or predator may end up with extinction. We then introduce exogenous control to reduce the risk of extinction. We propose two control schemes. The first scheme, referred as convergence guaranteed scheme, achieves very fine granular control of the prey and predator populations, in terms of the final state and convergence dynamics, at the cost of sophisticated implementation. The second scheme, referred as on-off scheme, is very easy to implement and drive the populations to steady state oscillation that is far from the risk of extinction. Finally we investigate the robustness of these two schemes against parameter mismatch and observe that the on-off scheme is much more robust. Hence, we conclude that while the convergence guaranteed scheme achieves theoretically optimal performance, the on-off scheme is more attractive for practical applications.
Keywords:Lotka-Voterra, Predator-Prey Model, Extinction Control, Feedback Control, Stability

1. Introduction
Predator-prey population dynamics are often modeled with a set of nonlinear differential equations. The LotkaVolterra model [1] [2] is one of the simplest predator-prey models in which only two species interact. Yet the model represents a powerful paradigm that can be extended to more sophisticated ecological dynamics such as competition, disease and mutualism [3] and even economics [4] . Specifically, the Lotka-Volterra predator-prey model is a pair of first-order nonlinear differential equations
 (1)
(1)
where ![]() represent the numbers of the prey and predator respectively, and
represent the numbers of the prey and predator respectively, and  are positive parameters that describe the following dynamic interaction of the two species.
Ÿ Without the predator , the prey growth rate is directly proportional to the population size. Therefore the population will grow exponentially. However, the predator reduces the prey growth rate, and the reduction is jointly proportional to
 ![]() because the rate of predation upon the prey depends on the rate at which the two meet.
because the rate of predation upon the prey depends on the rate at which the two meet.
Ÿ Without the prey , the predator growth rate is negative and directly proportional to the population size. Therefore, the population will drop exponentially. However, the prey increases the predator growth rate, and the increase is jointly proportional to
 ![]() because the rate of predation upon the prey depends on the rate at which the two meet.
because the rate of predation upon the prey depends on the rate at which the two meet.
The above Lotka-Volterra model (1) describes the autonomous dynamics between the two species without an exogenous input. In this paper, we introduce exogenous control to change the dynamics so as to achieve certain desired characteristics. In particular, it is well known [5] [6] that there is a high risk that the prey and/or predator may end up with extinction in the Lotka-Volterra model. We introduce two control schemes to reduce the risk of extinction. The first control scheme guarantees that the dynamic system converges to a desired state according to any predefined trajectory. The second control scheme uses a simple on-off logic to reduce the predator growth rate when needed. The on-off control scheme is easy to implement. Finally we study the robustness of the two control schemes against parameter mismatch that often arises in practice.
2. Analysis of Lotka-Volterra Equation and Risk of Extinction
Figure 1 illustrates an example of the predator and prey population sizes varying with time. The population evolves in a periodic manner and there is a phase shift between the predator and prey populations. Initially, both the prey and predator populations are small. Without enough food, the predator population shrinks and the prey population grows rapidly. After a delay, the remaining predator enjoys sufficient food supply and its population grows rapidly. This results in equally rapid drop in the prey population, which in turn leads to rapid drop in the predator population with a delay. The whole cycle repeats.
We plot the predator and prey populations in the ![]() plane in Figure 2 and observe that they oscillate endlessly according to a fixed contour. Along the contour, the following quantity
plane in Figure 2 and observe that they oscillate endlessly according to a fixed contour. Along the contour, the following quantity ![]() remains the same
remains the same
 (2)
(2)
To see this, note that

It follows that


For comparison, Figure 2 plots the predator versus prey population contours of a variety of ![]() resulting from different initial conditions.
resulting from different initial conditions.
The equilibrium is obtained by solving
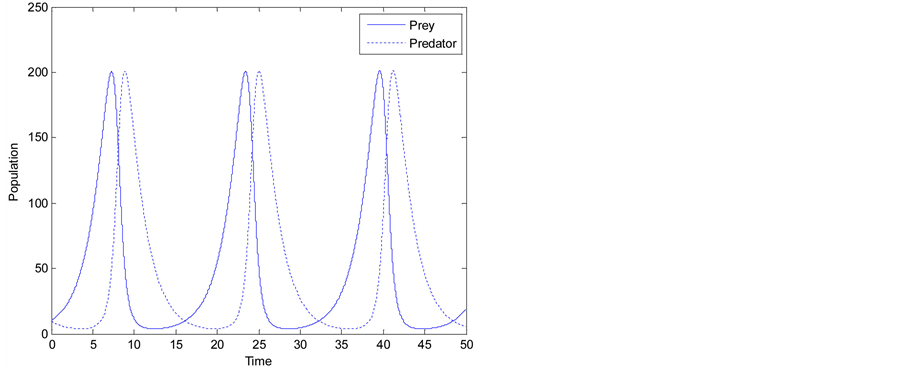
Figure 1. Plot of predator and prey populations varying with time .
.
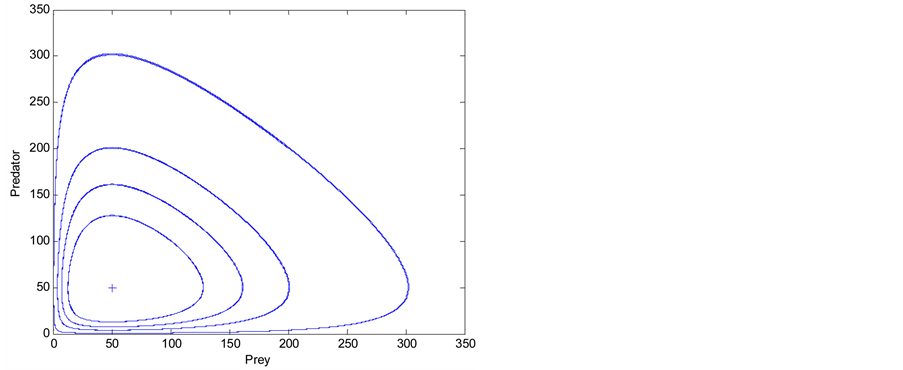
Figure 2. Plot of predator versus prey population contours. a = d = 0.5, b = c = 0.01. “+” represents one of the two equilibrium points .
.
 (3)
(3)
There are two solutions: , and
, and . The first equilibrium represents the scenario where both species becomes extinct. As shown in Figure 2, all of the contours oscillate around the second equilibrium.
An important observation from both Figure 1 and Figure 2 is that in each cycle the predator and prey populations drop to a very low level and then recover. In reality, other factors, such as disease and randomness, which have not been taken into account in the model, may affect the population dynamics and cause the population to drop to zero. In one scenario, the prey may become extinct first, which will then make the predator extinct too because of the lack of food source. Another possible scenario is that the predator may become extinct first. With no predator, the prey population will grow to infinite. Of course in a real world other factors, e.g., food supply for the prey, will eventually limit the growth.
While the particular dynamic pattern may appear to be an artifact of the Lotka-Volterra model, the above observation demonstrates certain phenomenon in some real world ecological environment where the predator-prey dynamics are so out-of-balance that the prey and/or predator end up extinction. In the following we will introduce a dynamic control mechanism to the Lotka-Volterra model so as to reduce the risk of extinction.
3. A Convergence Guaranteed Control Scheme
Exogenous control mechanisms have been studied in the literature [7] -[9] to alter the dynamics of the prey and predator populations for a variety of control goals. The control goal of this paper is to reduce the risk of extinction.
With exogenous control, the dynamic system is in general described as follows
 (4)
(4)
where  represent the control variables to be used. The first control scheme is to drive the population to a desired final state
 , with constant
 . Moreover, the trajectory toward the final state is also to be controlled. As an example, suppose that the control scheme is required to drive from any initial population
  to the final state
  according to the first-order linear differential equation
 (5)
(5)
Constant  specify how fast the population converges to the final state. Thus,
 (6)
(6)
Constants  are determined by the initial condition


The control scheme is thus given by


It follows that
 (7)
(7)
Because the population is guaranteed to converge to the final state, this control scheme is called convergence guaranteed scheme. The control scheme is expressed in a closed-loop feedback form. From the closed form expressions of , the trajectory of the control variables is given by
 (8)
(8)
Clearly the control is stable and converges to the steady state , and the convergence rate depends on
 .
.
Figure 3 shows the performance of the convergence guaranteed control scheme in order to drive the population to the desired final state. Figure 4 shows the control variables used to achieve the performance. We observe that with large , the convergence becomes quicker to the final population state at the cost of more drastic control required.
Note that in the convergence guaranteed control scheme the control variables  may be negative. For example, both
  are initially negative in Figure 4. In fact, the steady state itself is not necessarily positive for any
  A negative control variable means that one has to add prey or predator to the population, which is much harder to implement in a real world than removal of the species. We next propose an on-off control scheme to address this problem.
4. An On-Off Control Scheme
The above convergence guaranteed control scheme (7) achieves very precise control of the population—not only the final state but also the trajectory to the final state is precisely specified. In many real world scenarios, such a high precision may not be required. In the following, our objective is to control the population to be within a desired dynamic range that is far from the risk of extinction. By relaxing the control objective, we aim to greatly simplify the implementation of the control scheme.
Specifically, consider the following on-off control scheme
 (9)
(9)
 (10)
(10)
Here, ![]() is a positive constant and
is a positive constant and ![]() is a Boolean variable representing the control condition. The scheme applies only to the predator. When condition
is a Boolean variable representing the control condition. The scheme applies only to the predator. When condition ![]() is met, the exogenous control is to remove a faction
is met, the exogenous control is to remove a faction ![]() of the predator so as to help the prey population recover; otherwise, no control is exerted.
of the predator so as to help the prey population recover; otherwise, no control is exerted.
The key of the on-off control scheme is to design the control condition![]() . We consider two design choices. The first choice is based on the population of the prey
. We consider two design choices. The first choice is based on the population of the prey
 (11)
(11)
where ![]() is a constant threshold. The idea is that the control is exerted if the prey population drops below threshold
is a constant threshold. The idea is that the control is exerted if the prey population drops below threshold![]() . Figure 5 shows the performance of this choice with
. Figure 5 shows the performance of this choice with . Apparently, the prey population still drops well below
![]() , and more importantly, the predator population periodically gets close to zero.
, and more importantly, the predator population periodically gets close to zero.
One way to view this on-off control scheme is to plot the predator versus prey population. Recall that with no control, the predator and prey populations of the original autonomous dynamic system (1) oscillate along a contour. If the control is constantly exerted, i.e.,  , then the dynamic system would be the same as the original one except that
  is replaced by
 . When the control is turned on or off depending on the control condition
![]() , the predator and prey populations oscillate along a contour that switches between these two contours at
, the predator and prey populations oscillate along a contour that switches between these two contours at . That is, on the left side of line
 , the control is turned on and the contour follows the one with
 , and on the right side the control is turned off and the contour follows the one with
 . Figure 6 plots the three contours. Clearly, with the on-off control scheme, the prey population is moved slightly away from close to extinction. However, the predator is still near extinction periodically.
The second choice is based on the first-order derivative of the population of the prey
 (12)
(12)
where  is a constant threshold. The idea is that the control is exerted if the rate of decrease in the prey population drops below threshold
 . Compared with (11), the second choice (12) exhibits a predictive capability in the sense that as long as the rate of change drops below the threshold, the control is turned on proactively, even if the prey population itself may not be very low.
We examine the performance in Figure 7, which consists of four plots. The two plots in the left column correspond to ![]() and initial condition
and initial condition . Comparing with the population dynamics with no control in Figure 1, the dynamic range of fluctuation is much narrower and the prey and predator are both far from the risk of extinction. It is interesting to note that intensive control is needed to drive the population from the initial condition to a “desired” oscillation; however, once the population reaches the desired oscillation
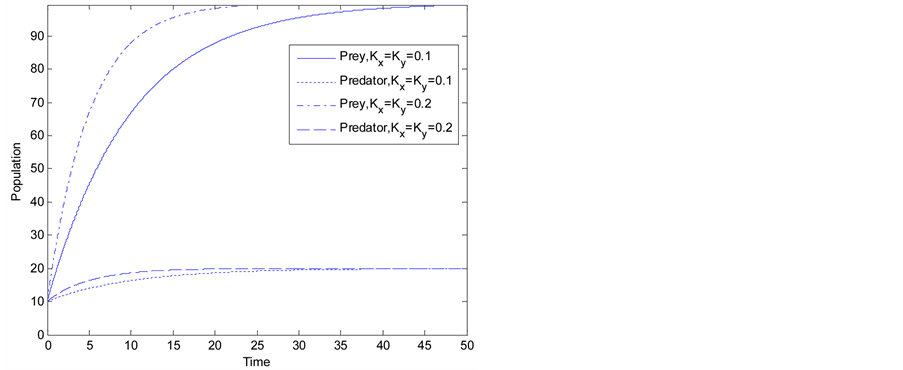
Figure 3. Performance of the convergence guaranteed control scheme. a = d = 0.5, b = c = 0.01. x(0) = y(0) = 10. xT = 100, yT = 20.

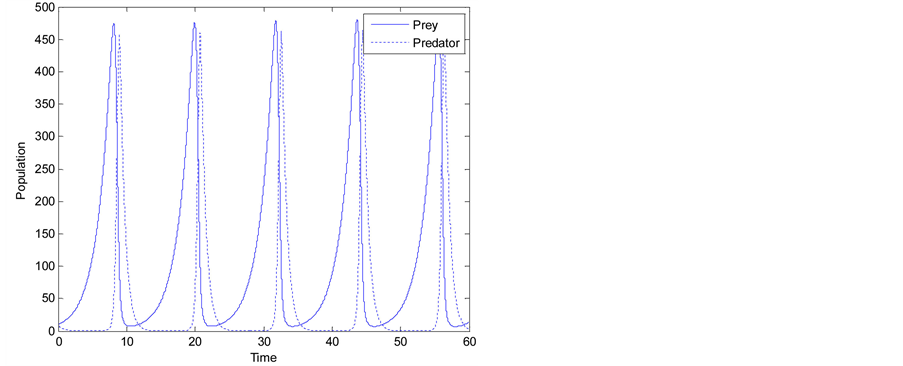
Figure 5. Performance of the on-off control scheme with control condition (11) and x0 = 100, g = 1.

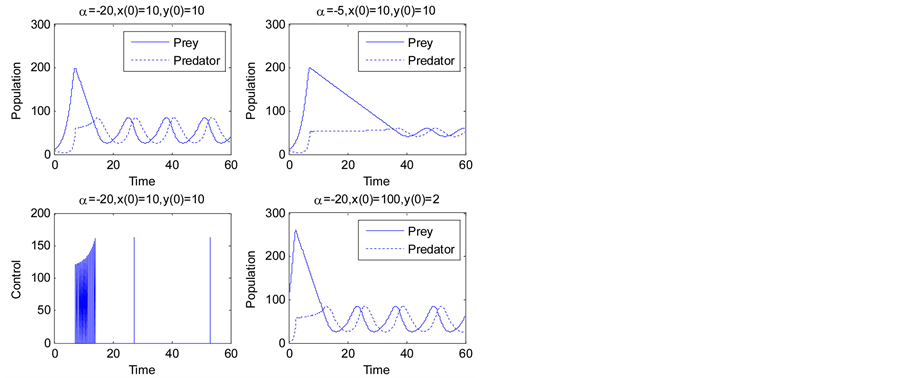
Figure 7. Performance of the on-off control scheme with control condition (12) and g = 2.
pattern, control is only exerted very occasionally. We make a similar observation for a different initial condition, e.g.,  as shown in the lower right plot. In the upper right plot, we change the threshold to
![]() . Compared with
. Compared with![]() , control is now more ready to be exerted. A comparison between these two thresholds of the upper two plots shows that with a smaller
, control is now more ready to be exerted. A comparison between these two thresholds of the upper two plots shows that with a smaller , the dynamic range of the desired oscillation is narrower but it takes longer to drive from the initial condition to the desired oscillation.
Figure 8 plots the predator versus prey population and shows the initial transition portion and the steady state oscillation contour. Comparison between Figure 8 and Figure 6 clearly shows that control condition (12) outperforms (11) to reduce the risk of extinction of both species.
5. Study of Robustness
In this section, we investigate the robustness of these two schemes against parameter mismatch. Specifically, so far we have assumed that the control scheme knows exactly the model parameters . In practice, however, the precise values of the parameters may not be available. Usually people have to monitor the prey and predator population dynamics to estimate the parameters. More importantly, the parameters may change over time, therefore causing parameter mismatch.
To study the robustness, we assume that the actual parameters are slightly different from those used in the control scheme. That is, the control scheme assumes the following set of parameters: .
.
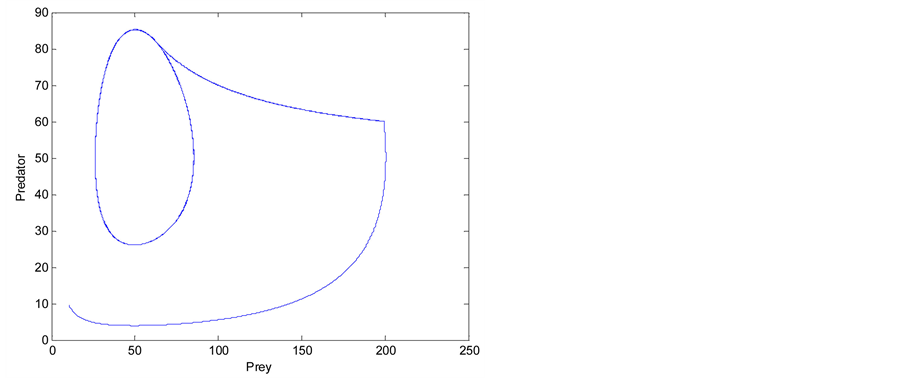
Figure 8. Plot of predator versus prey population of the case of α = −20, x(0) = y(0) = 10 in Figure 7.
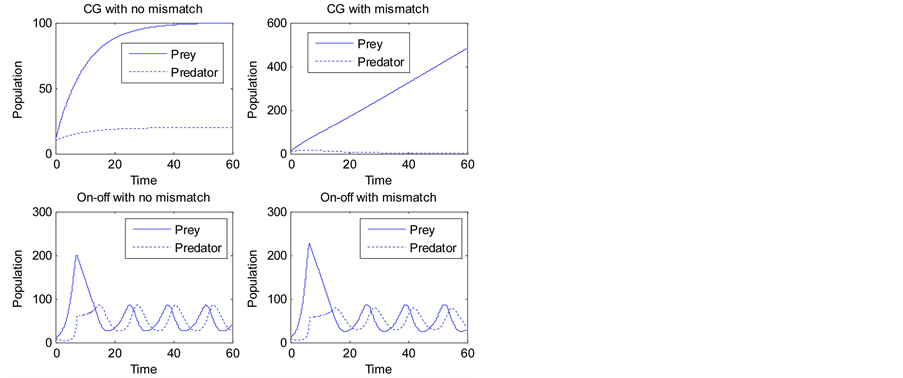
Figure 9. Robustness against parameter mismatch.
The parameters of the actual model are given by . Figure 9 compares the robustness performance of the two control schemes. The upper two plots are for the convergence guaranteed scheme, and the lower two are for the on-off scheme. In both cases, the left one is without parameter mismatch and the right one is with parameter mismatch. We observe that the on-off scheme is much more robust than the convergence guaranteed scheme, as the population dynamics hardly change. In fact, the convergence guaranteed scheme becomes instable.
6. Conclusion
In this paper, we have proposed two control schemes to reduce the risk of extinction in the Lotka-Volterra predator-prey model. The convergence guaranteed scheme achieves very fine granular control of the prey and predator populations, in terms of the final state and convergence dynamics, at the cost of sophisticated implementation. The on-off scheme is very easy to implement and drive the populations to steady state oscillation that is far from the risk of extinction. We furthermore investigate the robustness of these two schemes against parameter mismatch and observe that the on-off scheme is much more robust. Hence, we conclude that while the convergence guaranteed scheme achieves theoretically optimal performance, the on-off scheme is more attractive for practical applications. A next step of the research would be to apply the on-off scheme to other predator-prey models and investigate the robustness not only against parameter mismatch but also against model mismatch.
References
- Lotka, A.J. (1910) Contribution to the Theory of Periodic Reaction. The Journal of Physical Chemistry, 14, 271-274.http://dx.doi.org/10.1021/j150111a004
- Volterra, V. (1931) Variations and Fluctuations of the Number of Individuals in Animal Species Living Together. In: Chapman, R.N., Ed., Animal Ecology, McGraw-Hill, New York, 409-448. http://dx.doi.org/10.1086/284409
- Holt, R.D. and Pickering, J. (1985) Infectious Disease and Species Coexistence: A Model of Lotka-Volterra Form. The American Naturalist, 126, 196-211.
- Takeuchi, Y. (1996) Global Dynamical Properties of Lotka-Volterra Systems. World Scientific, Singapore.
- Mollison, D. (1991) Dependence of Epidemic and Population Velocities on Basic Parameters. Mathematical Biosciences, 107, 255-287. http://www.ma.hw.ac.uk/~denis/epi/velocities.pdf
- Wikipedia (2014) Lotka-Volterra Equation.
- Leung, A.W. (1995) Optimal Harvesting-Coefficient Control of Steady-State Prey-Predator Diffusive Volterra-Lotka Systems. Applied Mathematics & Optimization, 32, 219-241. http://dx.doi.org/10.1007/BF01182789
- El-Gohary, A. and Yassen, M.T. (2001) Optimal Control and Synchronization of Lotka-Volterra Model. Chaos, Solitons & Fractals, 12, 2087-2093. http://dx.doi.org/10.1016/S0960-0779(00)00023-0
- Chen, F. (2005) Positive Periodic Solutions of Neutral Lotka-Volterra System with Feedback Control. Applied Mathematics and Computation, 162, 1279-1302. http://dx.doi.org/10.1016/j.amc.2004.03.009