Paper Menu >>
Journal Menu >>
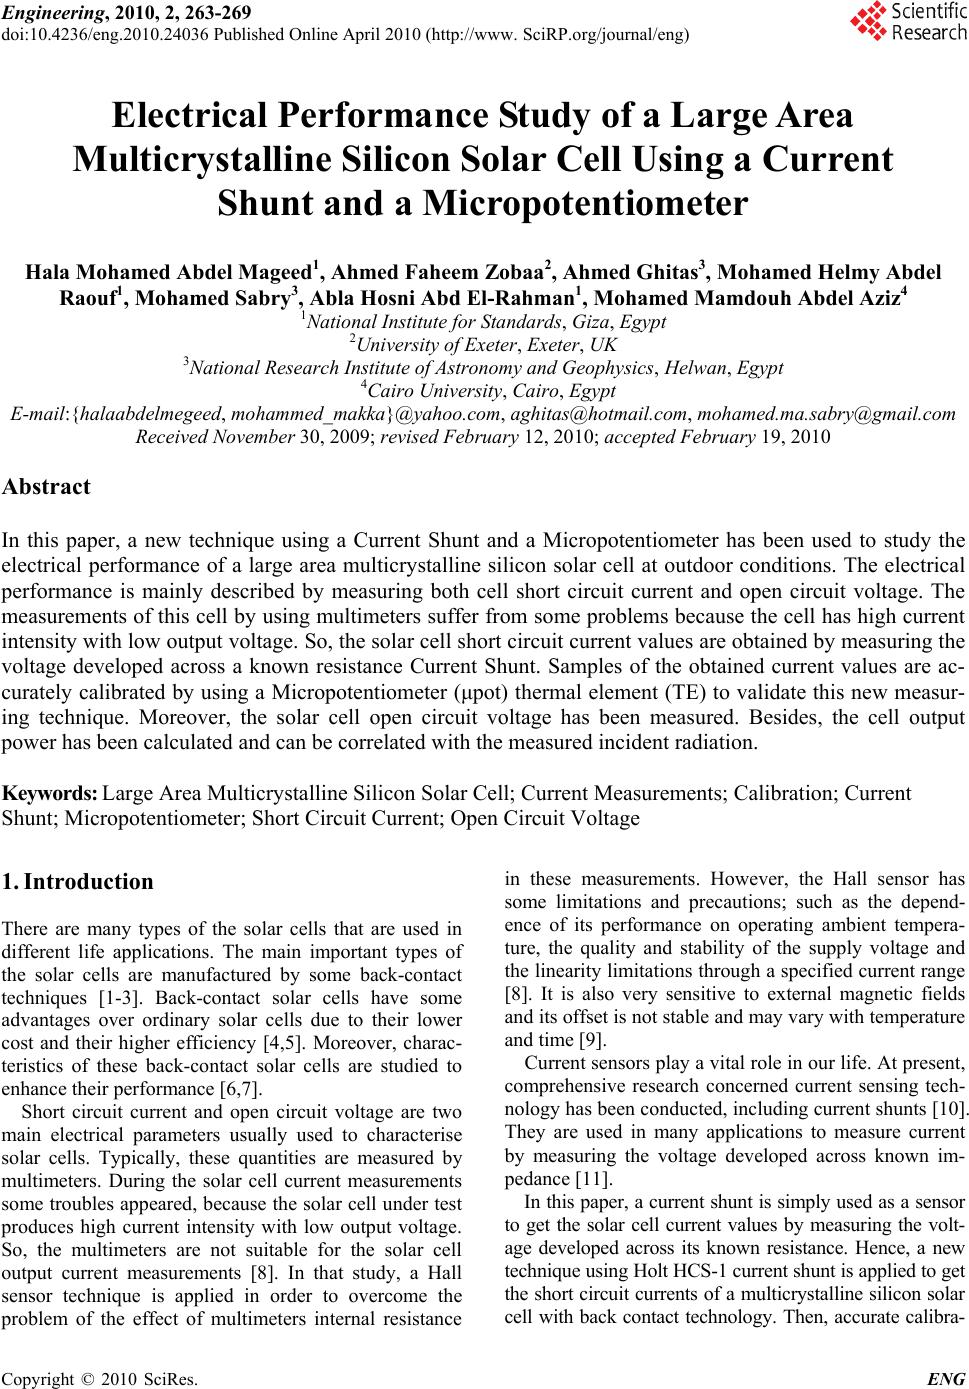 Engineering, 2010, 2, 263-269 doi:10.4236/eng.2010.24036 Published Online April 2010 (http://www. SciRP.org/journal/eng) Copyright © 2010 SciRes. ENG 263 Electrical Performance Study of a Large Area Multicrystalline Silicon Solar Cell Using a Current Shunt and a Micropotentiometer Hala Mohamed Abdel Mageed1, Ahmed Faheem Zobaa2, Ahmed Ghitas3, Mohamed Helmy Abdel Raouf1, Mohamed Sabry3, Abla Hosni Abd El-Rahman1, Mohamed Mamdouh Abdel Aziz4 1National Institute for Standards, Giza, Egypt 2University of Exeter, Exeter, UK 3National Research Institute of Astronomy and Geophysics, Helwan, Egypt 4Cairo University, Cairo, Egypt E-mail:{halaabdelmegeed, mohammed_makka}@yahoo.com, aghitas@hotmail.com, mohamed.ma.sabry@gmail.com Received November 30, 2009; revised February 12, 2010; accepted February 19, 2010 Abstract In this paper, a new technique using a Current Shunt and a Micropotentiometer has been used to study the electrical performance of a large area multicrystalline silicon solar cell at outdoor conditions. The electrical performance is mainly described by measuring both cell short circuit current and open circuit voltage. The measurements of this cell by using multimeters suffer from some problems because the cell has high current intensity with low output voltage. So, the solar cell short circuit current values are obtained by measuring the voltage developed across a known resistance Current Shunt. Samples of the obtained current values are ac- curately calibrated by using a Micropotentiometer (μpot) thermal element (TE) to validate this new measur- ing technique. Moreover, the solar cell open circuit voltage has been measured. Besides, the cell output power has been calculated and can be correlated with the measured incident radiation. Keywords: Large Area Multicrystalline Silicon Solar Cell; Current Measurements; Calibration; Current Shunt; Micropotentiometer; Short Circuit Current; Open Circuit Voltage 1. Introduction There are many types of the solar cells that are used in different life applications. The main important types of the solar cells are manufactured by some back-contact techniques [1-3]. Back-contact solar cells have some advantages over ordinary solar cells due to their lower cost and their higher efficiency [4,5]. Moreover, charac- teristics of these back-contact solar cells are studied to enhance their performance [6,7]. Short circuit current and open circuit voltage are two main electrical parameters usually used to characterise solar cells. Typically, these quantities are measured by multimeters. During the solar cell current measurements some troubles appeared, because the solar cell under test produces high current intensity with low output voltage. So, the multimeters are not suitable for the solar cell output current measurements [8]. In that study, a Hall sensor technique is applied in order to overcome the problem of the effect of multimeters internal resistance in these measurements. However, the Hall sensor has some limitations and precautions; such as the depend- ence of its performance on operating ambient tempera- ture, the quality and stability of the supply voltage and the linearity limitations through a specified current range [8]. It is also very sensitive to external magnetic fields and its offset is not stable and may vary with temperature and time [9]. Current sensors play a vital role in our life. At present, comprehensive research concerned current sensing tech- nology has been conducted, including current shunts [10]. They are used in many applications to measure current by measuring the voltage developed across known im- pedance [11]. In this paper, a current shunt is simply used as a sensor to get the solar cell current values by measuring the volt- age developed across its known resistance. Hence, a new technique using Holt HCS-1 current shunt is applied to get the short circuit currents of a multicrystalline silicon solar cell with back contact technology. Then, accurate calibra- 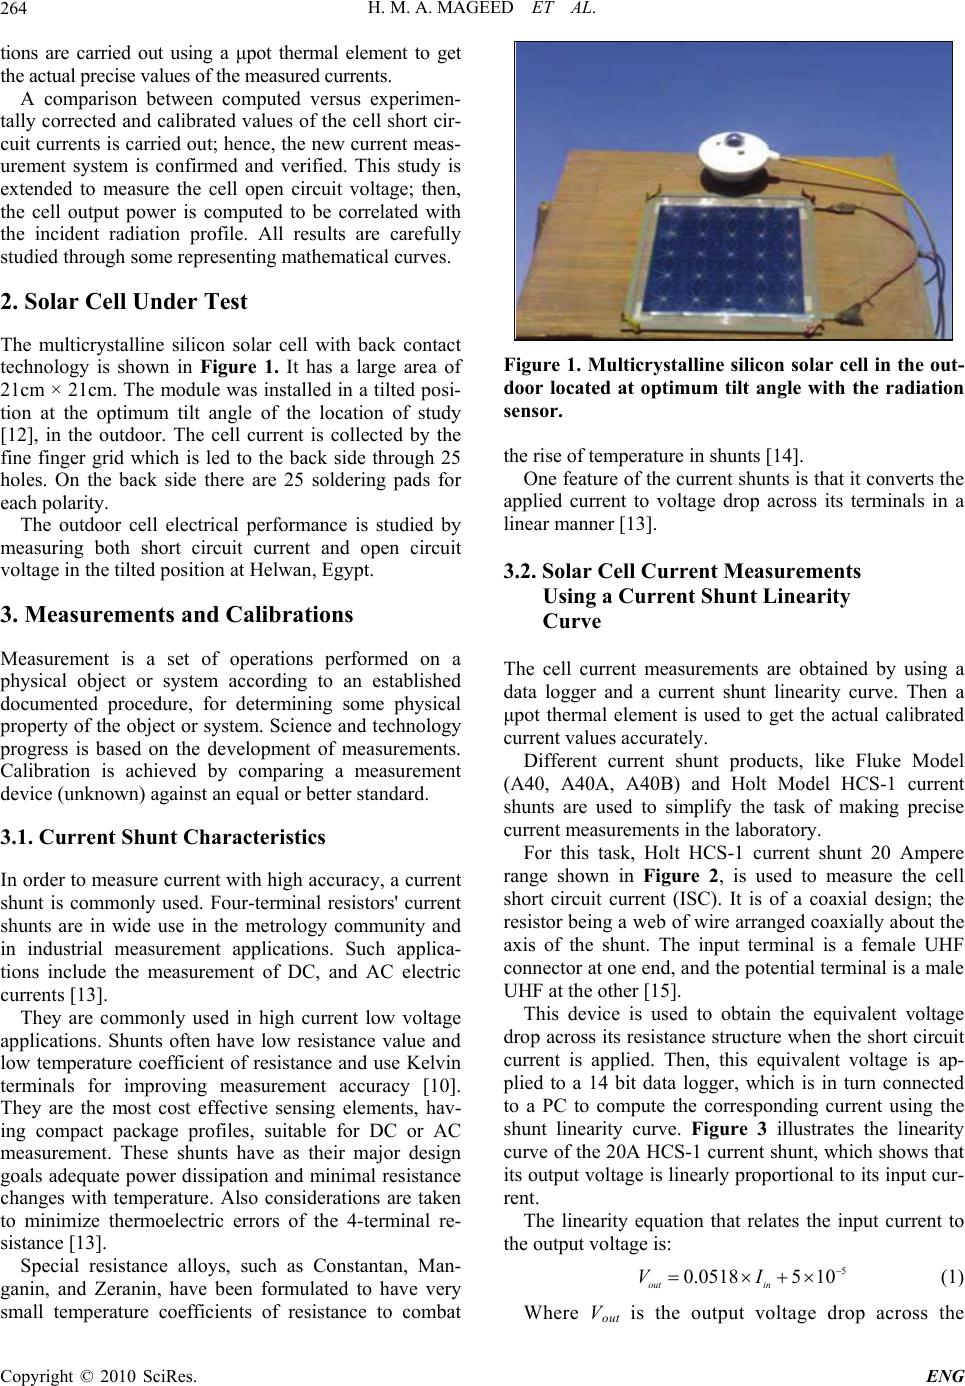 H. M. A. MAGEED ET AL. 264 tions are carried out using a μpot thermal element to get the actual precise values of the measured currents. A comparison between computed versus experimen- tally corrected and calibrated values of the cell short cir- cuit currents is carried out; hence, the new current meas- urement system is confirmed and verified. This study is extended to measure the cell open circuit voltage; then, the cell output power is computed to be correlated with the incident radiation profile. All results are carefully studied through some representing mathematical curves. 2. Solar Cell Under Test The multicrystalline silicon solar cell with back contact technology is shown in Figure 1. It has a large area of 21cm × 21cm. The module was installed in a tilted posi- tion at the optimum tilt angle of the location of study [12], in the outdoor. The cell current is collected by the fine finger grid which is led to the back side through 25 holes. On the back side there are 25 soldering pads for each polarity. The outdoor cell electrical performance is studied by measuring both short circuit current and open circuit voltage in the tilted position at Helwan, Egypt. 3. Measurements and Calibrations Measurement is a set of operations performed on a physical object or system according to an established documented procedure, for determining some physical property of the object or system. Science and technology progress is based on the development of measurements. Calibration is achieved by comparing a measurement device (unknown) against an equal or better standard. 3.1. Current Shunt Characteristics In order to measure current with high accuracy, a current shunt is commonly used. Four-terminal resistors' current shunts are in wide use in the metrology community and in industrial measurement applications. Such applica- tions include the measurement of DC, and AC electric currents [13]. They are commonly used in high current low voltage applications. Shunts often have low resistance value and low temperature coefficient of resistance and use Kelvin terminals for improving measurement accuracy [10]. They are the most cost effective sensing elements, hav- ing compact package profiles, suitable for DC or AC measurement. These shunts have as their major design goals adequate power dissipation and minimal resistance changes with temperature. Also considerations are taken to minimize thermoelectric errors of the 4-terminal re- sistance [13]. Special resistance alloys, such as Constantan, Man- ganin, and Zeranin, have been formulated to have very small temperature coefficients of resistance to combat Figure 1. Multicrystalline silicon solar cell in the out- door located at optimum tilt angle with the radiation sensor. the rise of temperature in shunts [14]. One feature of the current shunts is that it converts the applied current to voltage drop across its terminals in a linear manner [13]. 3.2. Solar Cell Current Measurements Using a Current Shunt Linearity Curve The cell current measurements are obtained by using a data logger and a current shunt linearity curve. Then a μpot thermal element is used to get the actual calibrated current values accurately. Different current shunt products, like Fluke Model (A40, A40A, A40B) and Holt Model HCS-1 current shunts are used to simplify the task of making precise current measurements in the laboratory. For this task, Holt HCS-1 current shunt 20 Ampere range shown in Figure 2, is used to measure the cell short circuit current (ISC). It is of a coaxial design; the resistor being a web of wire arranged coaxially about the axis of the shunt. The input terminal is a female UHF connector at one end, and the potential terminal is a male UHF at the other [15]. This device is used to obtain the equivalent voltage drop across its resistance structure when the short circuit current is applied. Then, this equivalent voltage is ap- plied to a 14 bit data logger, which is in turn connected to a PC to compute the corresponding current using the shunt linearity curve. Figure 3 illustrates the linearity curve of the 20A HCS-1 current shunt, which shows that its output voltage is linearly proportional to its input cur- rent. The linearity equation that relates the input current to the output voltage is: 5 1050518.0 IV inout (1) Where Vout is the output voltage drop across the Copyright © 2010 SciRes. ENG 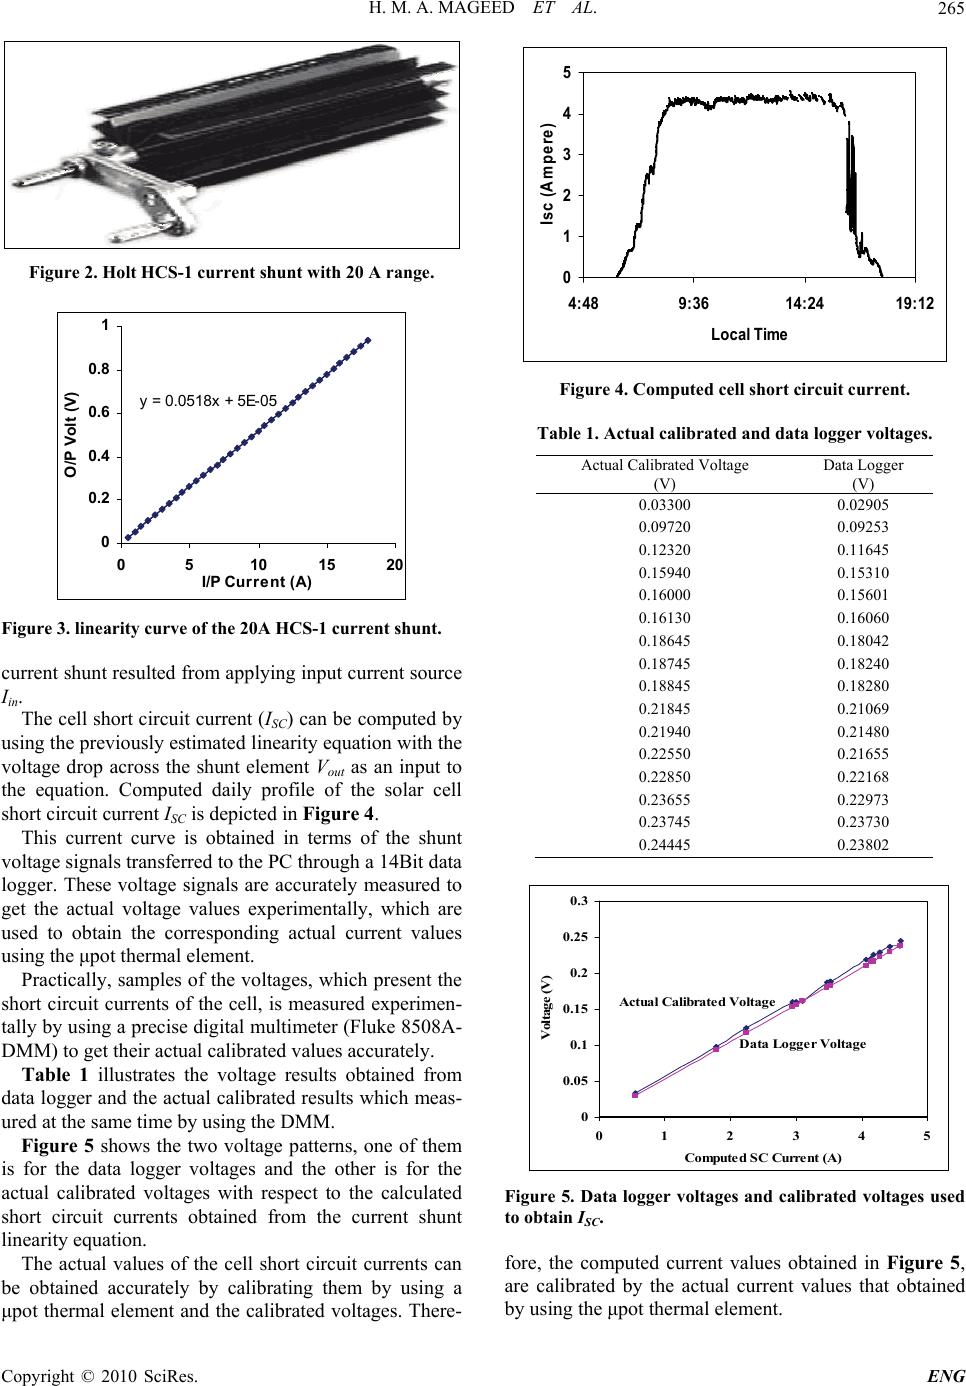 H. M. A. MAGEED ET AL. 265 Figure 2. Holt HCS-1 current shunt with 20 A range. y = 0.0518x + 5E-05 0 0.2 0.4 0.6 0.8 0510 15 20 I/P Current (A) O/P Volt (V) 1 Figure 3. linearity curve of the 20A HCS-1 current shunt. current shunt resulted from applying input current source Iin. The cell short circuit current (ISC) can be computed by using the previously estimated linearity equation with the voltage drop across the shunt element Vout as an input to the equation. Computed daily profile of the solar cell short circuit current ISC is depicted in Figure 4. This current curve is obtained in terms of the shunt voltage signals transferred to the PC through a 14Bit data logger. These voltage signals are accurately measured to get the actual voltage values experimentally, which are used to obtain the corresponding actual current values using the μpot thermal element. Practically, samples of the voltages, which present the short circuit currents of the cell, is measured experimen- tally by using a precise digital multimeter (Fluke 8508A- DMM) to get their actual calibrated values accurately. Table 1 illustrates the voltage results obtained from data logger and the actual calibrated results which meas- ured at the same time by using the DMM. Figure 5 shows the two voltage patterns, one of them is for the data logger voltages and the other is for the actual calibrated voltages with respect to the calculated short circuit currents obtained from the current shunt linearity equation. The actual values of the cell short circuit currents can be obtained accurately by calibrating them by using a μpot thermal element and the calibrated voltages. There- 0 1 2 3 4 4:489:3614:24 19:12 Local Time Isc (Ampere) 5 Figure 4. Computed cell short circuit current. Table 1. Actual calibrated and data logger voltages. Actual Calibrated Voltage (V) Data Logger (V) 0.03300 0.02905 0.09720 0.09253 0.12320 0.11645 0.15940 0.15310 0.16000 0.15601 0.16130 0.16060 0.18645 0.18042 0.18745 0.18240 0.18845 0.18280 0.21845 0.21069 0.21940 0.21480 0.22550 0.21655 0.22850 0.22168 0.23655 0.22973 0.23745 0.23730 0.24445 0.23802 0 0.05 0.1 0.15 0.2 0.25 012345 Computed SC Current (A) Voltage (V) 0.3 Actual Calibrated Voltage Data Logger Voltage Figure 5. Data logger voltages and calibrated voltages used to obtain ISC. fore, the computed current values obtained in Figure 5, are calibrated by the actual current values that obtained by using the μpot thermal element. Copyright © 2010 SciRes. ENG 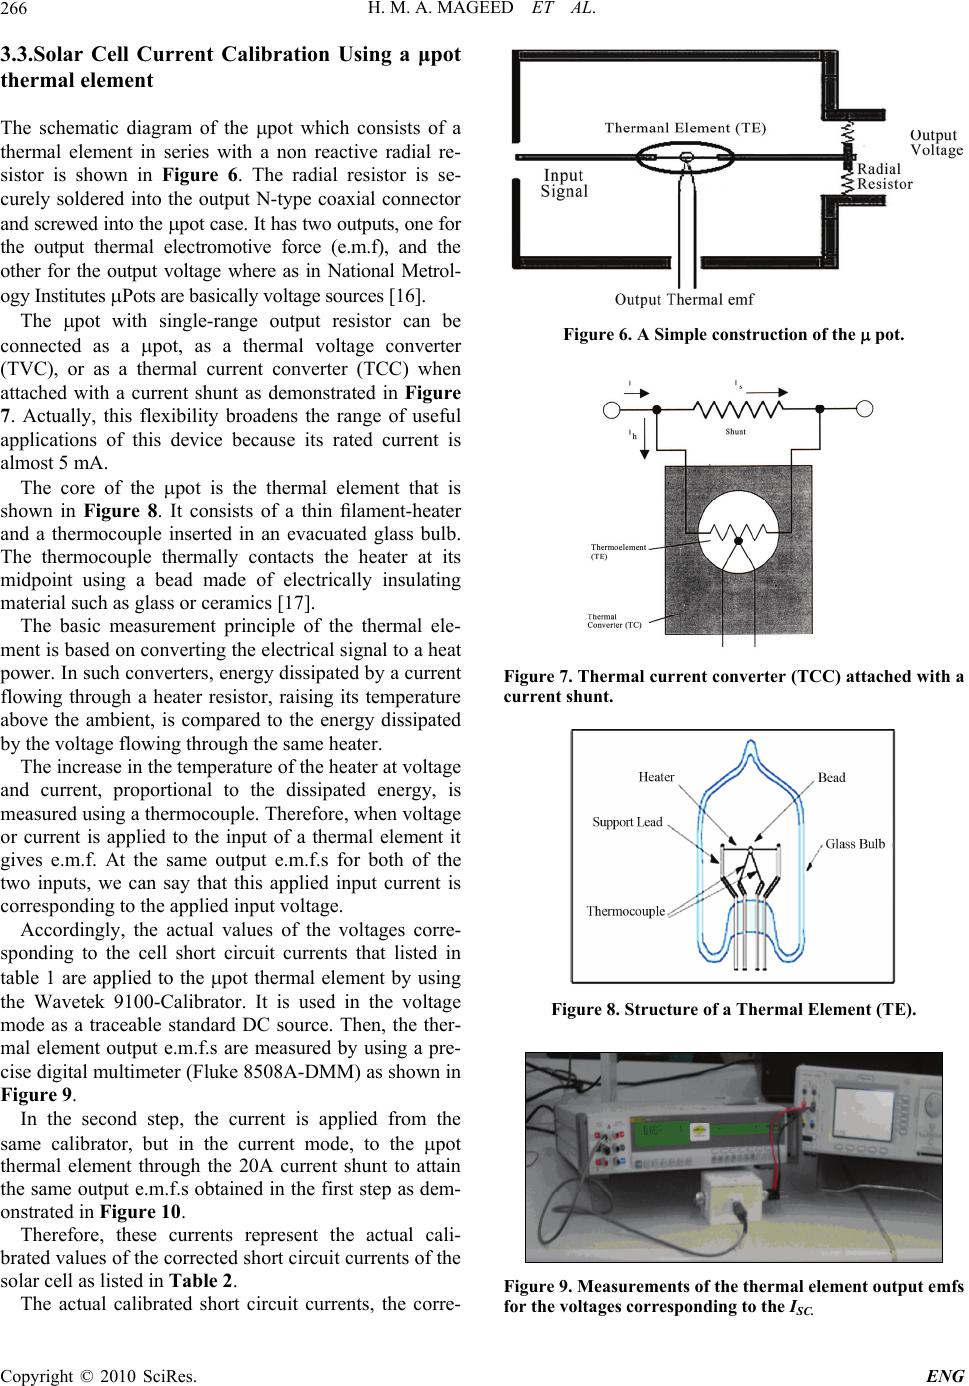 H. M. A. MAGEED ET AL. 266 t 5 mA. 3.3.Solar Cell Current Calibration Using a μpot thermal element The schematic diagram of the pot which consists of a thermal element in series with a non reactive radial re- sistor is shown in Figure 6. The radial resistor is se- curely soldered into the output N-type coaxial connector and screwed into the pot case. It has two outputs, one for the output thermal electromotive force (e.m.f), and the other for the output voltage where as in National Metrol- ogy Institutes Pots are basically voltage sources [16]. The pot with single-range output resistor can be connected as a pot, as a thermal voltage converter (TVC), or as a thermal current converter (TCC) when attached with a current shunt as demonstrated in Figure 7. Actually, this flexibility broadens the range of useful applications of this device because its rated current is almos The core of the pot is the thermal element that is shown in Figure 8. It consists of a thin filament-heater and a thermocouple inserted in an evacuated glass bulb. The thermocouple thermally contacts the heater at its midpoint using a bead made of electrically insulating material such as glass or ceramics [17]. The basic measurement principle of the thermal ele- ment is based on converting the electrical signal to a heat power. In such converters, energy dissipated by a current flowing through a heater resistor, raising its temperature above the ambient, is compared to the energy dissipated by the voltage flowing through the same heater. The increase in the temperature of the heater at voltage and current, proportional to the dissipated energy, is measured using a thermocouple. Therefore, when voltage or current is applied to the input of a thermal element it gives e.m.f. At the same output e.m.f.s for both of the two inputs, we can say that this applied input current is corresponding to the applied input voltage. Accordingly, the actual values of the voltages corre- sponding to the cell short circuit currents that listed in table 1 are applied to the pot thermal element by using the Wavetek 9100-Calibrator. It is used in the voltage mode as a traceable standard DC source. Then, the ther- mal element output e.m.f.s are measured by using a pre- cise digital multimeter (Fluke 8508A-DMM) as shown in Figure 9. In the second step, the current is applied from the same calibrator, but in the current mode, to the pot thermal element through the 20A current shunt to attain the same output e.m.f.s obtained in the first step as dem- onstrated in Figure 10. Therefore, these currents represent the actual cali- brated values of the corrected short circuit currents of the solar cell as listed in Table 2. The actual calibrated short circuit currents, the corre- Figure 6. A Simple construction of the pot. Figure 7. Thermal current converter (TCC) attached with a current shunt. Figure 8. Structure of a Thermal Element (TE). Figure 9. Measurements of the thermal element output emfs for the voltages corresponding to the ISC. Copyright © 2010 SciRes. ENG 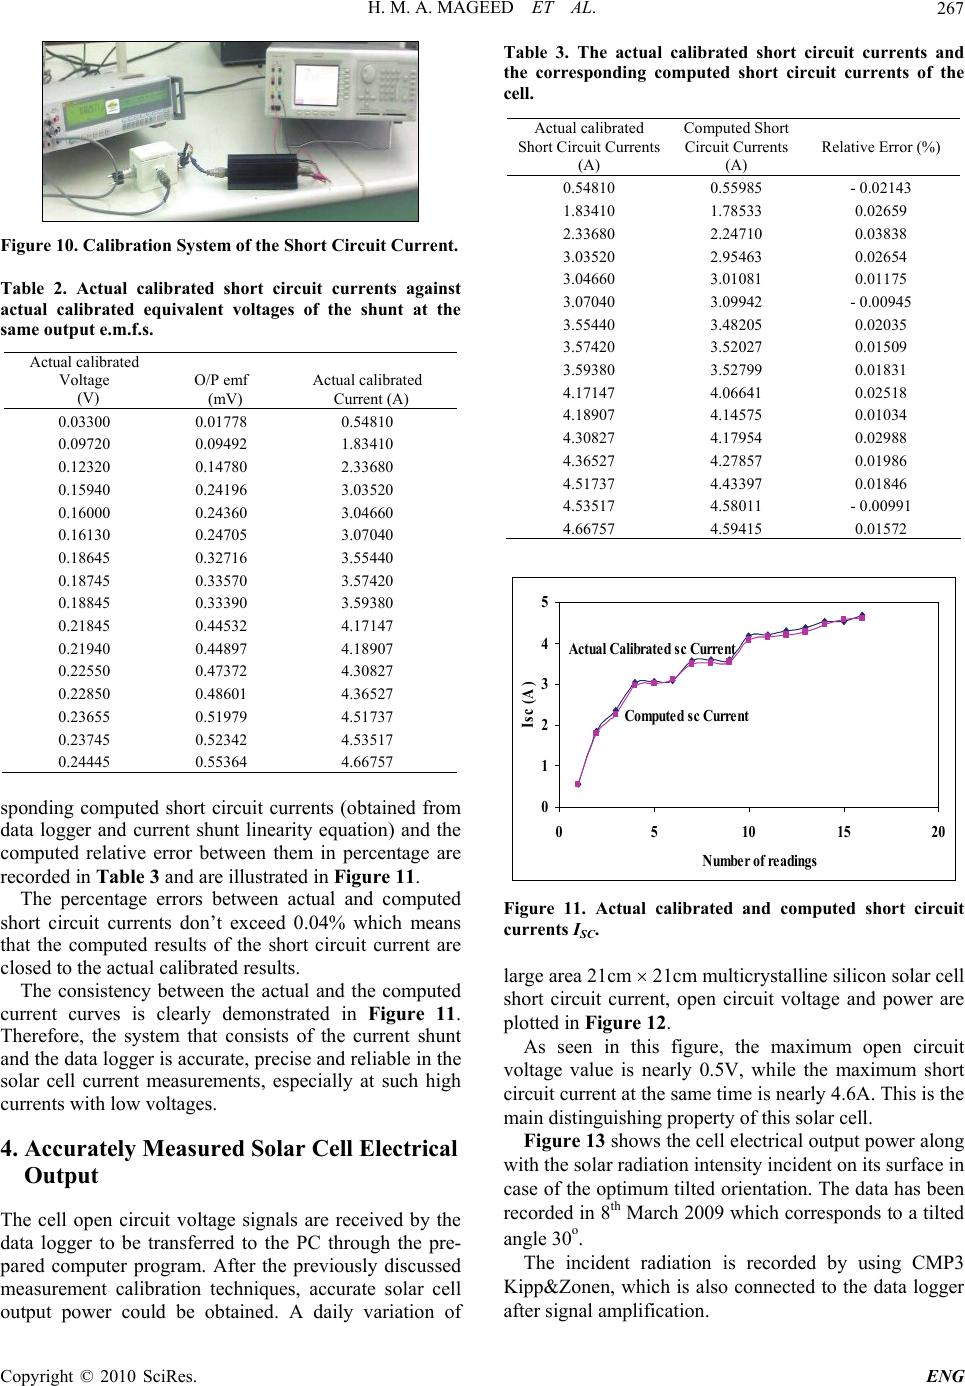 H. M. A. MAGEED ET AL. 267 Figure 10. Calibration System of the Short Circuit Current. Table 2. Actual calibrated short circuit currents against actual calibrated equivalent voltages of the shunt at the same output e.m.f.s. Actual calibrated Voltage (V) O/P emf (mV) Actual calibrated Current (A) 0.03300 0.01778 0.54810 0.09720 0.09492 1.83410 0.12320 0.14780 2.33680 0.15940 0.24196 3.03520 0.16000 0.24360 3.04660 0.16130 0.24705 3.07040 0.18645 0.32716 3.55440 0.18745 0.33570 3.57420 0.18845 0.33390 3.59380 0.21845 0.44532 4.17147 0.21940 0.44897 4.18907 0.22550 0.47372 4.30827 0.22850 0.48601 4.36527 0.23655 0.51979 4.51737 0.23745 0.52342 4.53517 0.24445 0.55364 4.66757 sponding computed short circuit currents (obtained from data logger and current shunt linearity equation) and the computed relative error between them in percentage are recorded in Table 3 and are illustrated in Figure 11. The percentage errors between actual and computed short circuit currents don’t exceed 0.04% which means that the computed results of the short circuit current are closed to the actual calibrated results. The consistency between the actual and the computed current curves is clearly demonstrated in Figure 11. Therefore, the system that consists of the current shunt and the data logger is accurate, precise and reliable in the solar cell current measurements, especially at such high currents with low voltages. 4. Accurately Measured Solar Cell Electrical Output The cell open circuit voltage signals are received by the data logger to be transferred to the PC through the pre- pared computer program. After the previously discussed measurement calibration techniques, accurate solar cell output power could be obtained. A daily variation of Table 3. The actual calibrated short circuit currents and the corresponding computed short circuit currents of the cell. Actual calibrated Short Circuit Currents (A) Computed Short Circuit Currents (A) Relative Error (%) 0.54810 0.55985 - 0.02143 1.83410 1.78533 0.02659 2.33680 2.24710 0.03838 3.03520 2.95463 0.02654 3.04660 3.01081 0.01175 3.07040 3.09942 - 0.00945 3.55440 3.48205 0.02035 3.57420 3.52027 0.01509 3.59380 3.52799 0.01831 4.17147 4.06641 0.02518 4.18907 4.14575 0.01034 4.30827 4.17954 0.02988 4.36527 4.27857 0.01986 4.51737 4.43397 0.01846 4.53517 4.58011 - 0.00991 4.66757 4.59415 0.01572 0 1 2 3 4 5 051015 20 Isc (A) Number of readings Actual Calibrated sc Current Computed sc Current Figure 11. Actual calibrated and computed short circuit currents ISC. large area 21cm 21cm multicrystalline silicon solar cell short circuit current, open circuit voltage and power are plotted in Figure 12. As seen in this figure, the maximum open circuit voltage value is nearly 0.5V, while the maximum short circuit current at the same time is nearly 4.6A. This is the main distinguishing property of this solar cell. Figure 13 shows the cell electrical output power along with the solar radiation intensity incident on its surface in case of the optimum tilted orientation. The data has been recorded in 8th March 2009 which corresponds to a tilted angle 30о. The incident radiation is recorded by using CMP3 Kipp&Zonen, which is also connected to the data logger after signal amplification. Copyright © 2010 SciRes. ENG 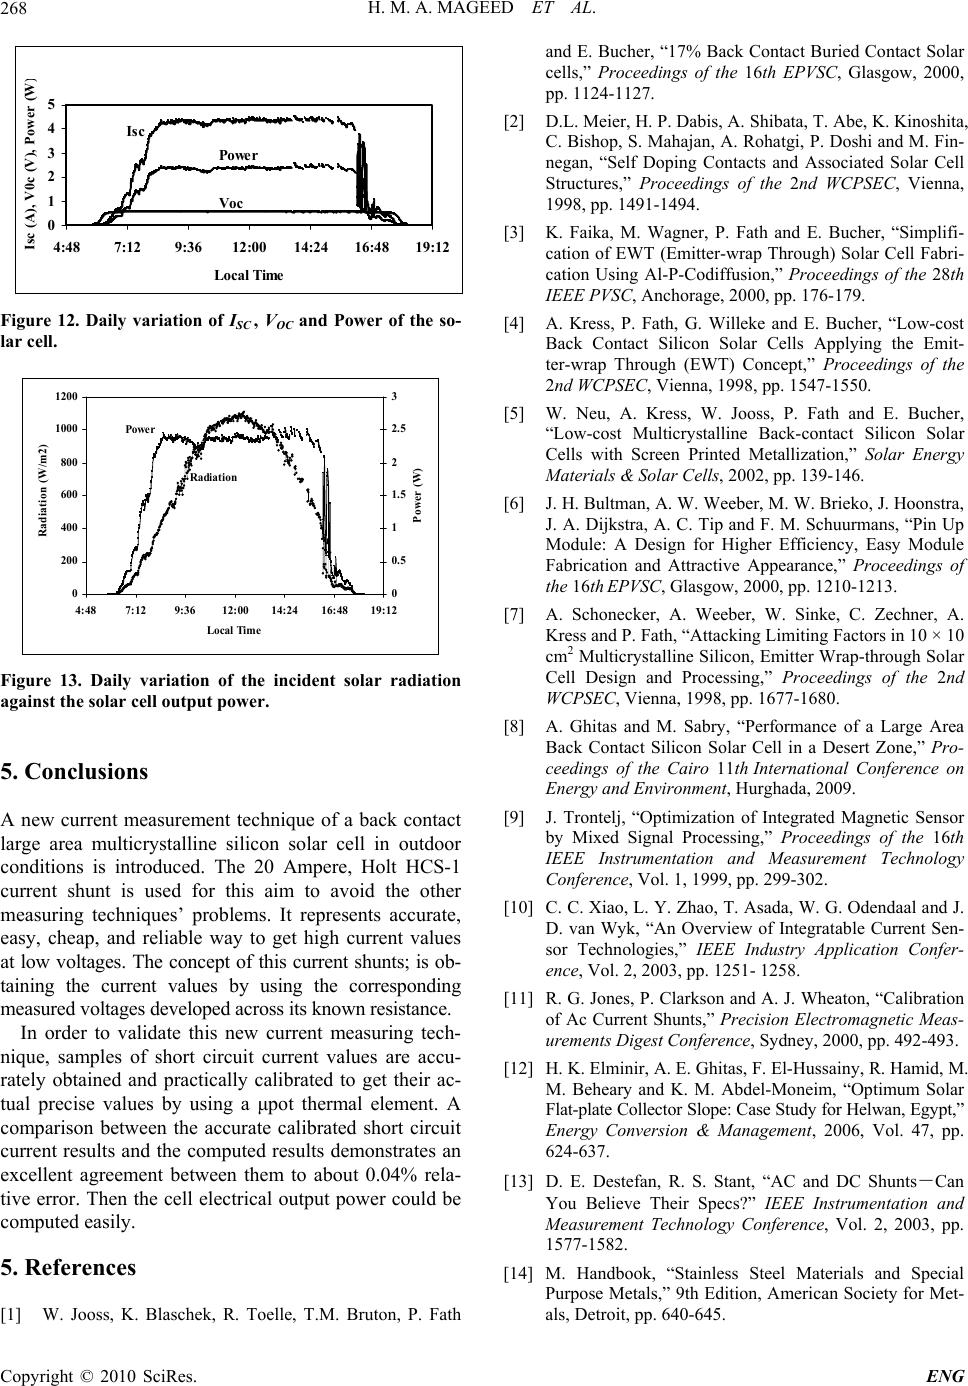 H. M. A. MAGEED ET AL. 268 ) 0 1 2 3 4 5 4:487:129:3612:0014:24 16:48 1 Local Time Isc (A), V0c (V), Power (W 9:12 Isc Power Voc Figure 12. Daily variation of ISC , VOC and Power of the so- lar cell. 0 200 400 600 800 1000 1200 4:487:129:3612:00 14:2416:48 19:12 Radiation (W/m2) 0 0.5 1 1.5 2 2.5 3 Power (W) Local Time Power Radiati o n Figure 13. Daily variation of the incident solar radiation against the solar cell output power. 5. Conclusions A new current measurement technique of a back contact large area multicrystalline silicon solar cell in outdoor conditions is introduced. The 20 Ampere, Holt HCS-1 current shunt is used for this aim to avoid the other measuring techniques’ problems. It represents accurate, easy, cheap, and reliable way to get high current values at low voltages. The concept of this current shunts; is ob- taining the current values by using the corresponding measured voltages developed across its known resistance. In order to validate this new current measuring tech- nique, samples of short circuit current values are accu- rately obtained and practically calibrated to get their ac- tual precise values by using a μpot thermal element. A comparison between the accurate calibrated short circuit current results and the computed results demonstrates an excellent agreement between them to about 0.04% rela- tive error. Then the cell electrical output power could be computed easily. 5 . References [1] W. Jooss, K. Blaschek, R. Toelle, T.M. Bruton, P. Fath and E. Bucher, “17% Back Contact Buried Contact Solar cells,” Proceedings of the 16th EPVSC, Glasgow, 2000, pp. 1124-1127. [2] D.L. Meier, H. P. Dabis, A. Shibata, T. Abe, K. Kinoshita, C. Bishop, S. Mahajan, A. Rohatgi, P. Doshi and M. Fin- negan, “Self Doping Contacts and Associated Solar Cell Structures,” Proceedings of the 2nd WCPSEC, Vienna, 1998, pp. 1491-1494. [3] K. Faika, M. Wagner, P. Fath and E. Bucher, “Simplifi- cation of EWT (Emitter-wrap Through) Solar Cell Fabri- cation Using Al-P-Codiffusion,” Proceedings of the 28th IEEE PVSC, Anchorage, 2000, pp. 176-179. [4] A. Kress, P. Fath, G. Willeke and E. Bucher, “Low-cost Back Contact Silicon Solar Cells Applying the Emit- ter-wrap Through (EWT) Concept,” Proceedings of the 2nd WCPSEC, Vienna, 1998, pp. 1547-1550. [5] W. Neu, A. Kress, W. Jooss, P. Fath and E. Bucher, “Low-cost Multicrystalline Back-contact Silicon Solar Cells with Screen Printed Metallization,” Solar Energy Materials & Solar Cells, 2002, pp. 139-146. [6] J. H. Bultman, A. W. Weeber, M. W. Brieko, J. Hoonstra, J. A. Dijkstra, A. C. Tip and F. M. Schuurmans, “Pin Up Module: A Design for Higher Efficiency, Easy Module Fabrication and Attractive Appearance,” Proceedings of the 16th EPVSC, Glasgow, 2000, pp. 1210-1213. [7] A. Schonecker, A. Weeber, W. Sinke, C. Zechner, A. Kress and P. Fath, “Attacking Limiting Factors in 10 × 10 cm2 Multicrystalline Silicon, Emitter Wrap-through Solar Cell Design and Processing,” Proceedings of the 2nd WCPSEC, Vienna, 1998, pp. 1677-1680. [8] A. Ghitas and M. Sabry, “Performance of a Large Area Back Contact Silicon Solar Cell in a Desert Zone,” Pro- ceedings of the Cairo 11th International Conference on Energy and Environment, Hurghada, 2009. [9] J. Trontelj, “Optimization of Integrated Magnetic Sensor by Mixed Signal Processing,” Proceedings of the 16th IEEE Instrumentation and Measurement Technology Conference, Vol. 1, 1999, pp. 299-302. [10] C. C. Xiao, L. Y. Zhao, T. Asada, W. G. Odendaal and J. D. van Wyk, “An Overview of Integratable Current Sen- sor Technologies,” IEEE Industry Application Confer- ence, Vol. 2, 2003, pp. 1251- 1258. [11] R. G. Jones, P. Clarkson and A. J. Wheaton, “Calibration of Ac Current Shunts,” Precision Electromagnetic Meas- urements Digest Conference, Sydney, 2000, pp. 492-493. [12] H. K. Elminir, A. E. Ghitas, F. El-Hussainy, R. Hamid, M. M. Beheary and K. M. Abdel-Moneim, “Optimum Solar Flat-plate Collector Slope: Case Study for Helwan, Egypt,” Energy Conversion & Management, 2006, Vol. 47, pp. 624-637. [13] D. E. Destefan, R. S. Stant, “AC and DC Shunts-Can You Believe Their Specs?” IEEE Instrumentation and Measurement Technology Conference, Vol. 2, 2003, pp. 1577-1582. [14] M. Handbook, “Stainless Steel Materials and Special Purpose Metals,” 9th Edition, American Society for Met- als, Detroit, pp. 640-645. Copyright © 2010 SciRes. ENG 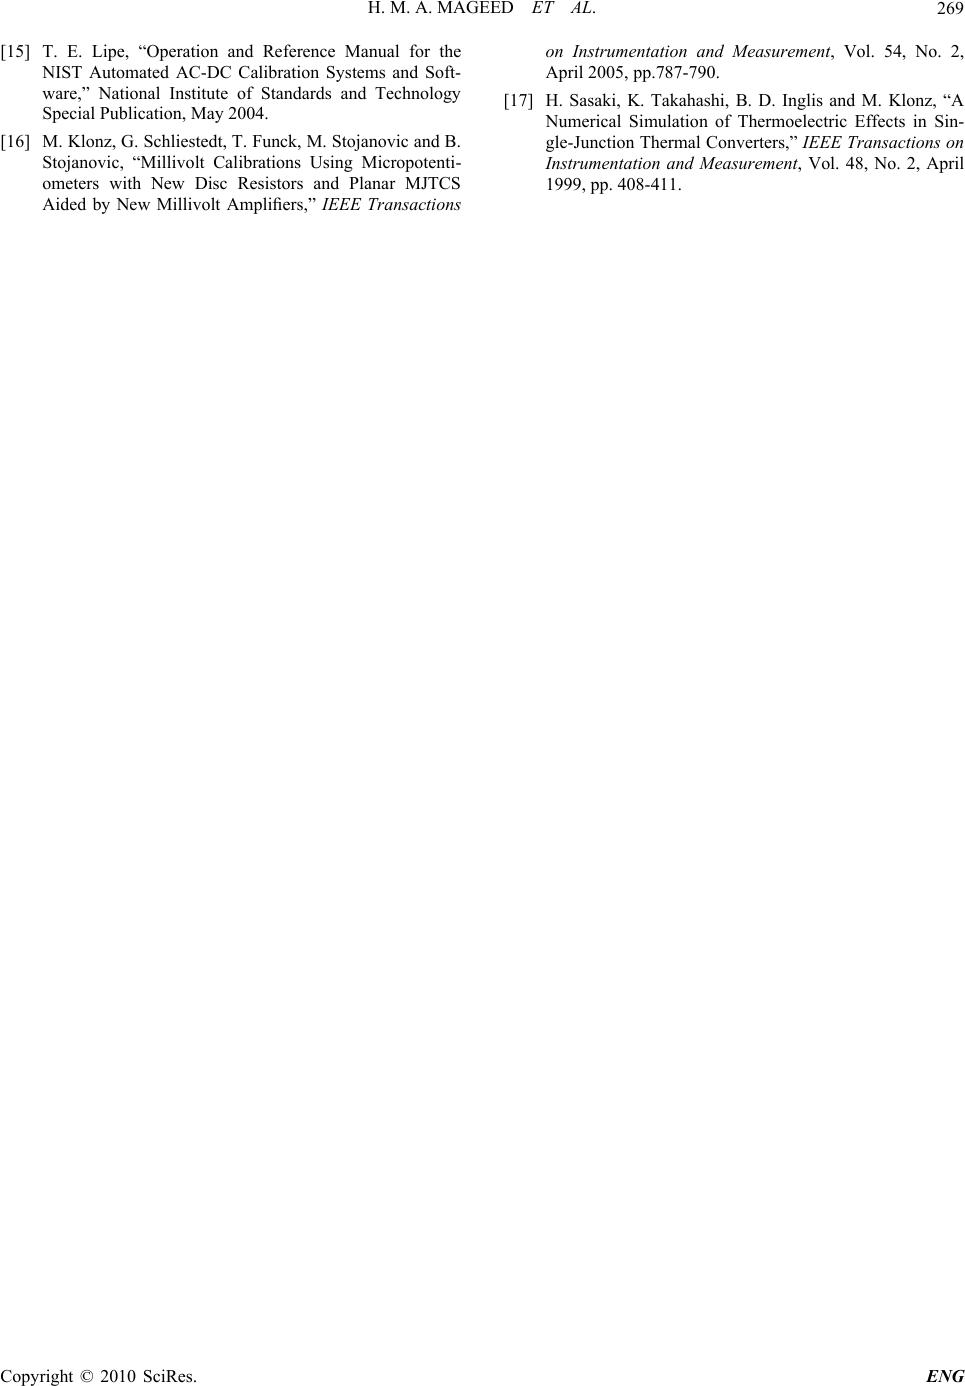 H. M. A. MAGEED ET AL. Copyright © 2010 SciRes. ENG 269 [15] T. E. Lipe, “Operation and Reference Manual for the NIST Automated AC-DC Calibration Systems and Soft- ware,” National Institute of Standards and Technology Special Publication, May 2004. [16] M. Klonz, G. Schliestedt, T. Funck, M. Stojanovic and B. Stojanovic, “Millivolt Calibrations Using Micropotenti- ometers with New Disc Resistors and Planar MJTCS Aided by New Millivolt Amplifiers,” IEEE Transactions on Instrumentation and Measurement, Vol. 54, No. 2, April 2005, pp.787-790. [17] H. Sasaki, K. Takahashi, B. D. Inglis and M. Klonz, “A Numerical Simulation of Thermoelectric Effects in Sin- gle-Junction Thermal Converters,” IEEE Transactions on Instrumentation and Measurement, Vol. 48, No. 2, April 1999, pp. 408-411. |