Modern Economy
Vol.10 No.02(2019), Article ID:90755,27 pages
10.4236/me.2019.102038
Defining Poverty Using Dominance-Based Rough Set Theory and Proposing Strategic Objectives for the United Nations Developing Countries
Jean-Charles Marin, Bryan Trudel, Kazimierz Zaras
Université du Québec en Abitibi-Témiscamingue, Rouyn-Noranda, Canada

Copyright © 2019 by author(s) and Scientific Research Publishing Inc.
This work is licensed under the Creative Commons Attribution International License (CC BY 4.0).
http://creativecommons.org/licenses/by/4.0/


Received: November 20, 2018; Accepted: February 23, 2019; Published: February 26, 2019
ABSTRACT
This article is the last of a series of three researches. The purpose of this research is to expose the results of using Dominance-based Rough Set Approach (DRSA) to help International organizations (both non-governmental organizations and governmental organizations) define poverty, identifying economical, sociological, political and technological strategic objectives for developing countries. More precisely, politicians, decision makers and international organizations will be able to study 23 various political, economical, sociological and technological indicators and classify all the countries according to the following three different categories: [A] Countries that are doing well according to the selected indicators; [B] Countries that need support to acquire category A status; [C] Countries ranked the lowest and meeting special support with regard to the criterion or criteria considered. The three categories are delimited by tertiles relative to the average ranking of the member states of the United Nations. The chosen criteria are measured in order to provide decision rules based on this classification. These decision rules thus focus on the strategic needs of countries with respect to improving their development and classification. We strongly believe that by targeting these identified needs, this research will help the sustainable development of countries in need to set realistic targets, prioritize International funding, evaluate economical growth and sociological improvements. Among the results of this article, priorities for countries ranked the lowest should focus on reducing adolescent fertility and increasing school life expectancy.
Keywords:
International Development, International Aid, Economic Growth, Strategic Objectives, Rough Set Theory, Dominance-Based Rough Set Approach (DRSA), Selection of Portfolio Projects, Multi-Criteria Analysis, Sustainable Development

1. Introduction
This is the last research of a series of three articles using a combination of statistics and DRSA. This systematic approach was used in a first article discussing the classification of all the African countries [1] . The second article used the same methodology but to help potential candidates of the European Union (EU) to determine strategic objectives if they were to join the EU, more precisely the candidate country of Bosnia and Herzegovina [2] . This third article tests the systematic approach at a larger scale using a combination of statistics and DRSA on all the 193 member states of the United Nations.
1.1. Poverty Definition
The World Bank estimates that the global poor are living in a rural environment, young, lacking education and with a large family with many children [3] . Economic Poverty is defined as a person living under 1.90 USD per day or suffers an economic deprivation [4] . Sociologists will associate poverty with health, education or safety deprivation. All the member states of the United Nations (UN) have people living in poverty. Some states offer an environment where poverty is more present than other states. The United Nations classifies countries into three categories: Developed economies, economies in transition and developing countries [5] . Several reports will define poverty as the Gross National Income per capita levels for each of those three categories. We intent to use a methodology that is based on statistical data and an operational research methodology named Dominance-based Rough Set to determine this classification and propose to define poverty from four different perspectives: political poverty, economical poverty, sociological poverty and technological poverty.
1.2. Dominance-Based Rough Set
A bunch of artificial intelligence tools and algorithms exist in order to help decision makers and leaders defining strategy and courses of action. One of them is the Rough set theory, which was developed by Pawlak [6] [7] and by Pawlak and Slowinski [8] . It is a mathematical tool that is used to support decision-making processes in fields such as medecine, banking, engineering, learning, location selection, pharmacology, finance, market analysis and economics [9] - [17] . It was later modified by Greco, Matarazo and Slowinski [10] and renamed the “Dominance-based Rough Set Approach” (DRSA). And then, Zaras developed it for mixed data (deterministic, probabilistic and fuzzy) [11] . Because of its advantage of sorting decision rules explaining the classification of objects, this research uses DRSA. The purpose is one of developing sound strategic objectives for all Third world countries in order to help decision makers, leaders, non-governmental organizations, help funds and other international organization or interest groups target specific objectives to improve the economical, political, sociological and technological situation of the Third world. A total of 23 indicators were selected by experts and categorized in four different perspectives (Political, Economical, Sociological and Technological).
Section 2 presents the statistical analysis which is a list of all the significant correlations between all the indicators classified per perspectives (PEST). Section 3 shows the application of DRSA to classify all the countries member of the United Nations, with regard to the perspectives (PEST) and explains the decision rules for each category (countries classified as: A, B and C). Section 4 proposes a strategy map for each individual country, proposing strategic objectives and performance measures to improve and monitor the sustainable development of all the selected Third world countries.
2. Political, Economical, Sociological and Technological Indicators
The 23 variables considered in this research were obtained from the World Bank, the United Nations and the International Institute for Strategic Studies [18] [19] [20] . The 23 variables were then classified into four perspectives, political, economical, sociological and technological (PEST) as summarized in Table 1 where variables definitions are presented as well for the year of data collection in parentheses. Indicators are also summarized, with scales from 1 - 5, 1 - 7 or 0 - 100. Other indicators are US$, percentages or number of years.
2.1. Portrait of the World in 2017
2.1.1. Statistics
Researching the numerous databases presented earlier, we were able to calculate each indicator for all the member states of the United Nations.
Since correlation is defined as a measure of the linear relationship between variables [21] , the research of relationship between variables could help determine the relationships between the various perspectives (PEST).
Appendix A presents the correlation matrix. All correlations presented in this research are significant at the 0.01 level (2-tailed).
2.1.2. Relationship between the Various Indicators
Testing for significant relationship between the various indicators according to:
Null Hypothesis 0: There is no relation between the two indicators.
Alternative Hypothesis 1: There is relation between the two indicators.
Then, after reviewing the data, we reject or not the null hypothesis 0.
2.1.3. Relationship between the Variables and Various Perspectives
Table 2-5 are summaries of all the correlations between a selected perspective and the other variables. It is important to mention that the positive and negative signs in parenthesis explains if there is a positive or negative correlation between

Table 1. Summary of the PEST indicators considered in this research.
the indicators. It does not correspond to the positiveness or negativeness of the correlation. For example, a smaller Political Stability Index is better for any country. Therefore, this indicator is positively correlated to the indicator “Deaths From Internal Conflicts” since this one is also better when the Index is smaller. It is important to mention that exportation of merchandise (% of GDP) is not correlated to any of the selected indicators.
Analyzing the correlation matrix helps determine that is plausible that:
1) RNN per capita is positively correlated to the corruption index, global competitiveness index, GNI per capita, GNP per capita, exports of goods and services, life expectancy for both women and men, school life, urban population and all the technological indicators. It is negatively correlated to the political stability index, deaths from internal conflicts, ease of doing business, unemployment, adolescent fertility and the homicides index.
2) GNP per capita is positively correlated to the corruption perception index, global competitiveness index, RNN per capita, GNI per capita, exports of goods and services, life expectancy for both women and men, school life, urban population and all the technological indicators. GNP per capita is negatively correlated to the political stability index, deaths from internal conflicts, ease of doing business, adolescent fertility and the homicides index.
3) GNI per capita is positively correlated to the corruption perception index, global competitiveness index, RNN per capita, GNP per capita, exports of goods and services, life expectancy for both women and men, school life, urban population and all the technological indicators. GNI per capita is negatively correlated to the political stability index, ease of doing business, adolescent fertility and the homicides index.
4) Unemployment is negatively correlated to the global competitiveness index and RNN per capita.
5) Exports of goods and services is positively correlated to the corruption perception index, global competitiveness index, RNN per capita, GNP per capita, GNI per capita, life expectancy for both women and men, school life, urban population and all the technological indicators. Exports of goods and services is negatively correlated to the political stability index, deaths from internal conflicts index, ease of doing business, adolescent fertility and homicides index.
Table 2 is a summary of all the correlations for the Economical perspective.
Table 3 is a summary of all the correlations for the Sociological perspective.
Using the correlation matrix, it is plausible that:
1) Life expectancy for women and men are both positively correlated to the corruption perception index, global competitiveness index, RNN per capita, GNP per capita, GNI per capita, exports of goods and services, life expectancy for men, school life, urban population and all the technological indicators. Life expectancy for women is negatively correlated to the political stability index, deaths from internal conflicts, ease of doing business, adolescent fertility and the homicides index.
2) School life is positively correlated to the corruption perception index, global competitiveness index, RNN per capita, GNP per capita, GNI per capita, exports of goods and services, life expectancy for both women and men, urban population and all technological indicators. School life is negatively correlated to the political stability index, deaths from internal conflicts, ease of doing business, adolescent fertility and the homicides index.
Table 2. Economical Perspective correlations.
3) The percentage of a state’s urban population is positively correlated to the corruption perception index, global competitiveness index, RNN per capita, GNP per capita, GNI per capita, exports of goods and services, life expectancy for both women and men, school life and all the technological indicators. Urban population percentages are negatively correlated to the political stability index, ease of doing business index, adolescent fertility and the homicides index.
4) Adolescent fertility per 1000 girls is positively correlated to the political stability index, ease of doing business and the homicides index. Adolescent fertility is negatively correlated to the corruption perception index, global competitiveness index, RNN per capita, GNP per capita, GNI per capita, exports of goods and services, life expectancy for both women and men, school life in years, urban population and all the technological indicators.
5) Homicides index is positively correlated to political stability index, ease of doing business, adolescent fertility. Homicides index is negatively correlated to the corruption perception index, global competitiveness index, RNN per capita, GNP per capita, GNI per capita, exports of goods and services, life expectancy for both women and men, school life, urban population percentages and all the technological indicators.
Table 4 is a summary of all the correlations for the political perspective.
Table 3. Sociological Perspective correlations.
Table 5 is a summary of all the correlations for the Technological perspective.
3. The Dominance-Based Rough Set Approach (DRSA) Applied to Estimate the Strategic Developmental Goals of All the United Nations States
3.1. Description
This section develops the application of the Dominance-based Rough Set Approach (DRSA) in order to determine the strategic objectives of each United Nations countries and improve their overall classification. First step is to classify all the Countries per perspectives in category A, B or C: Category [A] Countries that are doing well according to the selected indicators; [B] Countries that need support to acquire category A status; [C] Countries ranked the lowest and meeting special support with regard to the criterion or criteria considered. Appendix B presents the overall evaluation of all the United Nations countries with respect to the four conditional criteria as determined on the basis of each perspective
Table 4. Political perspective correlations.
(PEST) and with respect to the decisional criterion. Table 6 is a summary of all the classifications per Continent and Sub-Regions. Second step is to extract decision rules for all the variables on a first time, and on a second time individually on each perspective (PEST). Third step, for each country, we could determine and prioritize its strategic objectives with regard to their respective variables and values.
Table 6 demonstrates each continent separately, their sub-regions (if required) and the number of countries per classification. Finally, the last column explains the number of people per sub-region and the percentage of the population compared to the world’s population.
3.2. Formulation of the Multi-Criteria Problems
The ranking of the 193 countries members of the United Nations was perform on the basis of the 23 criteria measured by 23 indicators. The same was also done for each perspective on the basis of each respective criteria. That kind of problem can be represented using the AXE model, where:
Table 5. Technological perspectives correlations.
A is a finite set of countries ai for ;
X is a finite set of criteria Xk for or Xkj for for each perspective j.
E is the set of evaluations measured by indicators eik with respect to criterion Xk or indicators eikj with respect to criterion Xkj for each perspective j.
Since the weights of indicators are assumed equal, we performed the weighted average rank method in order to rank countries. In fact, the countries are ranked from the most to the least preferable in terms of each indicator in relation to each criterion. Calculation for each country of its weighted average rank were performed to obtain the rating of the countries with respect to a given perspective but also on overall classification of the 23 criteria.
For each perspective j, the weighted average of country i,
(1)
The overall weighted average of country i,
(2)
Table 6. Classifications per region.
where:
wk is the weight of criterion k and wkj for perspective j;
rki is a rank of country i with respect to criterion k and rkij for perspective j.
With the obtained ranking of 193 countries, overall and for each perspective, countries were classified into three categories A, B and C (Appendix B).
In rough set theory, the decision problem is represented as a table, the rows corresponding to objects and the columns to attributes (see Table 7). In our approach, the objects are the countries and we used two types of attributes: conditional and decisional. In according to ranking obtained by using multi-criteria method we classified countries to three categories A, B and C. The decision in the decision table with respect to the decisional attribute takes one of three values: Country belongs to the category A, B or C.
The remaining attributes will be called conditionals and these will be from our multi-criteria AXE problem (the nj criteria, in the case of overall classification 23 criteria). With respect to each conditional attribute, the evaluation of the country takes the value of the indicator ekij in relation to each criterion k.
Based on the approximations obtained by means of the dominance relations, it is possible using DRSA methodology to derive a generalized description of the preferential information contained in the decision table, in terms of decision rules.
3.3. The Decision Rules
Decision rules were extracted using the 4eMka2 software [22] , developed by the intelligent decision support systems laboratory (IDSS) at the computing science institute of the Poznan University of Technology. Table 8 presents the combination of decision rules for all the perspectives combined and Table 9 presents
Table 7. Decision table for perspective j.
Table 8. Decision Rules for the all the perspectives combined.
each combination of decision rules for each perspective individually. It is important to mention that all the rules that are presented have a minimum relative strength of 20% and limited to 4 conditional criteria.
4. Identification of Poverty and Strategic Objectives
The concrete application of the decision rules is enlighten in this section thought the identification of conditions of the countries classified as [C] Countries ranked the lowest and meeting special support. The decision rules also may reveal specific targets to obtain in order for a state classified as C to be able to develop strategic objectives to improve their development towards the classification B and A. Decision rules ≤ C identifies the conditions for poverty and decision rules ≥ B and A determine what needs to be accomplish for a country categorized as C to improve it’s ranking to B or A. These decision rules may be transformed into targets and strategic objectives. It is important to mention that some countries classified as C or B may meet some conditions already and should focus on the conditions they do not meet. Each state has to determine their own priorities.
4.1. Poverty Defined When All Perspectives Are Combined
Decision rules 5, 6 and 7 help us determine poverty when all indicators and perspectives are combined. Therefore, for all the states within the United Nations, these are the following decision rules and conditions for poverty:
Table 9. Decision rules for each perspective individually.
1) The Gross National Product is equal or lower than 917.56$ per capita;
2) The number of secure internet servers is equal or smaller than 5.2 per million users and the conflict index, which represents the number of battle deaths from internal conflict between at least one government armed forces is equal or greater than 2.03; and
3) The corruption perception index is equal or lower than 28 with a GNP equal or lower than 1642.73$ per capita.
4.2. Political Poverty
Decision rules 9 and 10 dictate what the conditions for political poverty are:
1) Conflict index, is equal or larger than 1.26 combined with military expenditures in % of GDP equal or larger than 2.18%; and
2) Conflict index same as the first example (1.26) combined with the global competitiveness index equal or lower than 4.35.
4.3. Economical Poverty
Decision rule 18 dictates that economical poverty can be defined as these following sets of conditions:
1) GNP per capita is equal or lower than 738.64$ (USD) per capita combined with exports of merchandise per capita equal or lower than 200.74$.
4.4. Sociological Poverty
Decision rules 23 and 24 give us the sets of conditions for sociological poverty:
1) Life expectancy for women equal or less than 68.79 years, urban population is equal or less than 59.79% of the entire population of the state and school life expectancy is equal or less than 13 years; and
2) Urban population is equal or less than 35.04%, school life expectancy is equal or less than 10 years and with an adolescent fertility equal or over 42.75 birth per 1000.
It is important to state that the sociological perspective has three core attributes that impact the most the classification of the states: School life expectancy, % of urban population and adolescent fertility index per 1000.
4.5. Technological Poverty
Decision rules 31, 32 and 33 define technological poverty with the following conditions:
1) The number of secure internet servers is equal or smaller than 3.2 per million users and the number of internet user is equal or smaller than 31.87% of the population;
2) Fixed broadband internet is equal or less than 2.79 per 100 people, production of academic papers is equal or less than 5.71 articles per million people, cellular subscriptions is equal or less than 124.94 per 100 people and secure internet servers is equal or less than 62.87 per million people; and
3) Cellular phones subscriptions is equal or less than 76.37 per 100 people, fixed broadband internet is equal or less than 0.54 per 100 people and secure internet servers is equal or less than 15.64 per million people.
4.6. Strategic Objectives and Targets
Several of the indicators selected are results. For example, GNP per capita cannot be increased or decreased voluntarily and decision makers have no or very little power in influencing the results. Other indicators, such as school life expectancy, adolescent fertility, corruption perception index, military expenditures and the number of academic papers are indicators where decision makers may influence by changing policies, targeting funding or creating programs to educate the population with regards to these factors. As proved with the correlation matrix, since economical and technological indicators are correlated with sociological and political indicators, it is plausible to set objectives with specific targets for each country categorized as C and dictate what needs to be done to improve their situation. All the decision rules equal or greater than A and decision rules equal or greater than B may be either used for prediction or transformed into strategic objectives with specific targets for each country. As an example, we selected randomly a country classified as C, the state of Cambodia. Again, any country in category C should have interest to reach the threshold pointed out in decision rules in order to reach category B or even A. However, their improvement objectives would be different since their actual performance is different. Table 10 describes that decision rules equal or greater than B are transformed into strategic objectives and targets for the randomly selected Cambodia. You will find all the strategic objectives and targets for the decision rule 22 for all the countries classified as C in Appendix C.
5. Conclusions
Using statistics and 23 different indicators categorized into 4 perspectives (PEST) helped us classify all the member states of the United Nations into three categories: [A] Countries that are doing well according to the selected indicators; [B] Countries that need support to acquire category A status; [C] Countries ranked the lowest and meeting special support with regard to the criterion or
Table 10. Strategic objectives and targets for Cambodia.
criteria considered (See Appendix B). The various correlations help us identify the plausibility that all perspectives (PEST) are related one another positively or negatively. There is no doubt that the adolescent fertility per 1000 and the school life expectancy indicators is related with economical indicators such as the GNP per capita, GNI per capita, RNN per capita and exports of goods and services. It is also highly probable that they are related with political indicators such as the ease of doing business and technological indicators such as the number of academic papers produced per capita. Finally, these indicators are also related with the life expectancy of women and men.
The number of people of all these classified states indicates that 17.38% of the world population lives in states categorized as A, 59.41% live in states categorized as B and 23.21% live in states categorized as C. Therefore, approximately 82.62% of the world population lives in states that require strategies and targets to improve their development. It is understandable that some indicators are results of environmental factors and cannot be changed in the short term. It is the same conclusion for economical and technological indicators. Identifying poverty using the four different perspectives helps decision makers and politician to define their priorities to reduce poverty. It is clear that reducing adolescent fertility index below 42.75 births per 1000 girls and increasing school life expectancy over 13 years should be priorities. So, education programs and teen pregnancy education programs should be priorities for states categorized as C.
The beauty of using DRSA is that it also clearly identifies what a country should exactly aim to be categorized as B or A.
Future Research
The exploration of some indicators and correlations helped us discover interesting possibilities for future researches. The percentage of women in governments is negatively correlated to the political stability index and ease of doing business index. The same indicator is positively correlated to the corruption perception index, RNN per capita, GNP per capita, GNI per capita, exports of merchandise per capita (USD), life expectancy for women, school life in years, the number of academic papers per capita produced annually and fixed internet servers per 100 people. It is therefore plausible that the percentage of women in government has an impact on the politics, economy, sociological development and technological advancement within a state.
In the first article, we identified a phenomenon where most of the poorest countries of Africa were neighbouring one another and shared boundaries. We named this phenomenon the poverty string. In this research, it seems that the same phenomenon is observable where countries categorized as C are in clusters in various regions (West Africa, East Africa, Central Africa, South Asia, Central Asia) and are neighbouring one another. There are possibly several other reasons for this phenomenon such as environmental similarities (temperatures, dryness and other environmental factors) and these environmental factors should be added to other researches in strategy
Conflicts of Interest
The authors declare no conflicts of interest regarding the publication of this paper.
Cite this paper
Marin, J.-C., Trudel, B. and Zaras, K. (2019) Defining Poverty Using Dominance-Based Rough Set Theory and Proposing Strategic Objectives for the United Nations Developing Countries. Modern Economy, 10, 547-573. https://doi.org/10.4236/me.2019.102038
References
- 1. Marin, J.-C., Trudel, B. and Zaras, K. (2018) Identifying Strategic Development Objectives for African Countries Using Dominance-Based Rough Set Approach: The Poverty String Theory. Modern Economy, 9, 1262-1286. https://doi.org/10.4236/me.2018.97082
- 2. Trudel, B, Marin, J.-C. and Zaras, K. (2018) Identifying Strategic Development Objectives for European Union’s Potential Candidate States Using Dominance-Based Rough Set Approach: Case Study of Bosnia and Herzegovina. Modern Economy, 9, 1452-1464. https://doi.org/10.4236/me.2018.98092
- 3. The World Bank, Poverty and Shared Prosperity Report 2016.
- 4. Akindola, R. (2009) Towards a Definition of Poverty, Journal of Developing Societies, 25, 121-150. https://doi.org/10.1177/0169796X0902500201
- 5. World Economic Situation and Prospects 2018, United Nations.
- 6. Pawlak, Z. (1982) Rough Set. International Journal of Parallel Programming, 11, 341-356.
- 7. Pawlak, Z. (1991) Rough Sets: Theoretical Aspects of Reasoning about Data. Kluwer Academic Publishing, Dordrecht. https://doi.org/10.1007/978-94-011-3534-4
- 8. Pawlak, Z. and Slowinski, R. (1994) Rough Set Approach to Multi-Attribute Decision Analysis. European Journal Operational Research, 72, 443-459. https://doi.org/10.1016/0377-2217(94)90415-4
- 9. Pawlak, Z. (2002) Rough Set Theory and Its Applications. Journal of Telecommunications and Information Theory, 3, 7-10.
- 10. Greco, S., Matarazzo, B. and Slowiński, R. (2001) Rough Sets Theory for Multi-Criteria Decision Analysis. European Journal of Operational Research, 129, 1-47. https://doi.org/10.1016/S0377-2217(00)00167-3
- 11. Zaras, K. (2004) Rough Approximation of a Preference Relation by a Multi-Attribute Stochastic Dominance for Deterministic, Stochastic and Fuzzy EvaluationProblems. European Journal of Operational Research, 159, 196-206. https://doi.org/10.1016/S0377-2217(03)00391-6
- 12. Zaras, K., Marin, J.-C. and Boudreau-Trudel, B. (2012) Dominance Rough Set Approach as a Decision-Making Method for the Selection of Sustainable Development Projects. American Journal of Operational Research, 2, 506.
- 13. Ho, H., Fann, W., Chiang, H., Nguyen, P., Pham, D., Nguyen, P. and Nagai, M. (2016) Application of Rough Set, GSM and MSM to Analyze Learning Outcome—An Example Introduction to Education. Journal of Intelligent Learning Systems and Applications, 8, 23-38. https://doi.org/10.4236/jilsa.2016.81003
- 14. Marin, J., Zaras, K. and Boudreau-Trudel, B. (2014) Use of the Dominance-Based Rough Set Approach as a Decision Aid Tool for the Selection of Development Projects in Northern Quebec. Modern Economy, 5, 723-741. https://doi.org/10.4236/me.2014.57067
- 15. Prema, S. and Umamaheswari, P. (2016) Multitude Classifier Using Rough Set Jelinek-Mercer Naïve Bayes for Disease Diagnosis. Circuits and Systems, 7, 701-708. https://doi.org/10.4236/cs.2016.76059
- 16. Songbian, Z. (2016) Business Intelligence from Customer Review Management Using Rough Set Model. International Journal of Advanced Research, 4, 816-824.
- 17. Emam, O., Farhan, M. and Abohany, A. (2017) Faults Repairing Analysis Using Rough Sets after Implementation of Labor Force Redistribution Algorithm: A case Study in Telecom Egypt. Information Sciences Letter, 6, 39-48.
- 18. World Bank 2018, Indicators. https://data.worldbank.org/indicator
- 19. United Nations 2018, UNData. http://data.un.org/Explorer.aspx?d=UNODC
- 20. International Institute for Strategic Studies, IISS. https://www.iiss.org
- 21. Field, A. (2005) Discovering Statistics Using SPSS. 2nd Edition, Sage Publications, New Delhi.
- 22. Greco, S., Matarazzo, B. and Slowinski, R. (1999) The Use of Rough Sets and Fuzzy Sets in MCDM. In: Gal, T., Hanne, T. and Stewart, T., Eds., Advances in Multiple Criteria Decision Making, Kluwer Academic Publishers, Dordrecht, Boston, 14.1-14.59. https://doi.org/10.1007/978-1-4615-5025-9_14
Appendix A
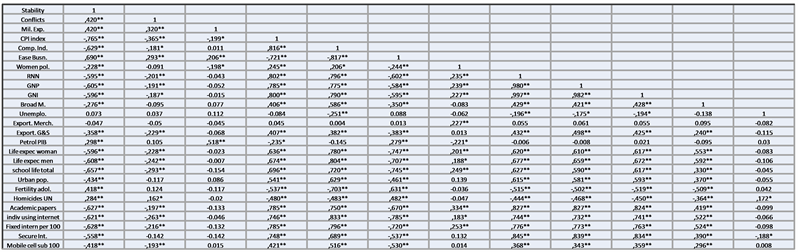
Correlation matrix. **Correlation is significant at the 0.01 level (2-tailed). *Correlation is significant at the 0.05 level (2-tailed).
Appendix B
Appendix C