Food and Nutrition Sciences
Vol. 3 No. 1 (2012) , Article ID: 17085 , 15 pages DOI:10.4236/fns.2012.31014
Low Cost Process for Phenolic Compounds Extraction from Cabernet Sauvignon Grapes (Vitis vinifera L. cv. Cabernet Sauvignon). Optimization by Response Surface Methodology
![]()
1Unité de Biochimie and Centre d’Analyse et de Recherche, Faculté des Sciences, Université Saint-Joseph de Beyrouth, Beirut, Lebanon; 2INSERM, U928, Technological Advances for Genomics and Clinics Laboratory, Marseille, France.
Email: *richard.maroun@usj.edu.lb
Received September 28th, 2011; revised October 27th, 2011; accepted November 15th, 2011
Keywords: Phenolic Compounds; Monomeric Anthocyanins; Extraction Optimization; Grape; Time; Solvent; Temperature
ABSTRACT
Phenolic compounds are naturally extracted molecules used nowadays for several industrial applications such as food preservatives and neutraciticals; thus industrial needs are in constant growth. Optimization of phenolic compounds (PC) and monomeric anthocyanins (MA) extraction from grape berries using response surface methodology was here achieved. Cabernet Sauvignon (CS) wine grapes (Vitis vinifera L. cv. Cabernet Sauvignon) are a rich source of anti-radical phenols, extractable as dietary supplements. However, efficiency of extraction strongly depends on specific experimental conditions. In this work, the comparison between two extraction mixtures, Acetone/Water (A/W) and Methanol/Water (M/W) and the effects of three critical variables—Extraction Time (between 8 and 88 h), Extraction Temperature (between 1˚C and 35˚C) and Solvent Content (between 63% and 97%)—on Phenolic Compounds Yield (PCY) and Monomeric Anthocyanins Yield (MAY) were studied using Response Surface Methodology (RSM). Process conditions maximizing the PCY were found to be 87% A/W solvent content, after 88 h incubation at 26˚C, and those of the MAY were found to be 97% M/W solvent content, after 8 h incubation at 1˚C. In addition, chromatographic profiles of extracts showed very different affinities of the phenolic compounds families to the experimental conditions employed. This process advantages are: low percentage of organic solvent used, high quality of extracted molecules thanks to low temperature treatment, very low energy consumption and low cost of needed machinery. At industrial scale, it may be used as promising technique for the extraction of bioactive compounds from plant or byproduct material such as from wine or grape juice industries.
1. Introduction
The grape, which constitutes the world’s largest food crop, has a production that reached approximately 67,000,000 tonnes in 2009 [1]. The economical importance of grapes and products obtained therefrom, such as wine, grape juice, jams and raisins, is therefore obvious. Viticulture can be more exploited by the extraction of grape’s Phenolic Compounds (PC). These molecules, well investigated by botanists and oenologists, are normally involved in plant aromatic metabolism and immunity [2].
Phenolic compounds (PC) are found widely in wine grapes like Cabernet Sauvignon (CS) (Vitis vinifera L. cv. Cabernet Sauvignon), and are classified into two major groups: the non-flavonoids mainly divided into Phenolic acids and Stilbenes and the Flavonoids which are flavonols, anthocyanins and flavanols [3].
The common Chemical structure of all the phenolic compounds confers high reactivity due to electron mobility on the phenol and gives the ability to scavenge free radicals [3] (Figure 1). Due to this highly antioxidant property in addition to their structural similarity with endogenous hormones and natural ligands, PC could have a multitude of bioactive roles [4], by inducing intrinsic antioxidant enzymes [5], modulating signal transduction [6], and impacting cell cycle [7]. Furthermore PC could have a high industrial value, as they contribute to flavor, astringency, color and physiological properties of juices, wines and grape products [8]. Moreover PC can act against

Figure 1. Resonance states of the basal phenolic stricture.
lipid oxidation, which is a major determinant in the deterioration of food during processing and storage [9].
The importance of the above PC sanitary and economical properties led to speculations on how to obtain an extract highly rich in those compounds. Extraction is one of the most widely used unit operations for obtaining certain desired components initially retained in a biological matrix [10]. Since phenols are highly reactive, extraction conditions and parameters could profoundly modify their interaction with their matrix and environment and thus modify the phenolic profile of the extract. Throughout literature the most investigated parameters which had an important impact on PC and MA extraction were; 1) the type of extraction solvent or solvent mixture; 2) extraction time and 3) extraction temperature [11]. Literature reveals that Acetone and Methanol are the most used extraction solvents for phenol and Anthocyanin recovery from plant material especially grapes [8,12,13]. Mixtures of water and solvents were proven to give richer extracts in their phenolic diversity [10,12-18], than solvent used alone.
In literature, extraction time varied from a few minutes up to several hours [19] depending on the study aim and the extraction technique employed. As for the extraction temperature parameter, many authors agreed that an increase in the working temperature favors extraction enhancing both the solubility of solute and the diffusion coefficient, but also that beyond a certain value PC could lose their structure and function [20]. It is also known that each component of the grape possesses a different phenolic composition. Both the nature of the occurring species (structure, polymerization degree, etc…) and their overall quantity could largely vary as a function of the considered fraction (skin, seed or pulp). Most of the cited references started the PC extraction from grape parts taken separately like seeds and skins [21], stems [22] or even grape marc [23]. We found only few papers where extraction was started directly on fresh, whole and raw grapes [24]. It is also understood that reduction of particle size should increase the superficial area available for extraction; [25] reported a higher extraction yield of PC by acting on crushed than uncrushed grape material and [26] wrote that grinding could shorten the extraction time.
The aim of this paper was, to optimize the extraction process of TPC and MA from CS grapes. This optimization was assessed by response surface methodology (RSM), using a five-level, three-variable central composite design. A qualitative part of this study aimed also to show the occurrence of the chemical species in function of the extraction parameters. We have noticed that literature lacks of optimization data about the extraction process of TPC and MA from grapes. Therefore we determined the optimum parameters (solvent type, water concentration in the solvent system, extraction time and extraction temperature) needed to give the highest TPC and MA yields from CS grapes. A response surface plot of the extraction kinetics responding to these parameters was drawn. The occurrence of certain PC species in relation to the variation of the extraction parameters was established. We as well aimed to simplify the extraction to a low cost and energy depending procedure. A solvent extraction method was proposed with simple or no complex machinery and without expensive pre-treatments of the starting material and no excessive heating. Finally, the obtained PC rich extract could be used as additives for food preservation, as well as in pharmaceutical; cosmetics and neutralceutical industries. These extracts could also be used in in vitro studies in presence of specific cellular systems in order to emphasize on the synergistic biochemical interactions of total PC in vitro and their influence on live systems in vivo.
2. Material and Methods
2.1. Reagents
All reagents were of analytical grade. Phenolic compounds standards of gallic acid, protocatechuic acid, p-coumaric acid, caffeic acid, ferulic acid, cinnamic acid, chlorogenic acid, p-hydroxybenzoic acid, catechin, epicatechin, epigallocatechin, gallocatechin, catechin gallate, gallocatechin gallate, prodelphinidin, resveratrol, kaempferol, quercetol, myricetol and rutin were from Sigma Chemical Co. (St. Louis, MO, USA). The solvents employed for the extraction of the samples and for HPLC analysis were pure water, acetone, methanol and formic acid of HPLC grade from (Scharlau, Barcelona, Spain). The Folin reagent (Sigma Chemical Co., St. Louis, MO, USA) and sodium carbonate (Fluka, Buchs, Switzerland) were employed for the measurement of the total phenolic compounds concentrations using the Folin-Ciocalteu method, the calibration curve was constructed with gallic acid (Sigma Chemical Co., St. Louis, MO, USA). Potassium chloride (Fluka, Buchs, Switzerland) and sodium acetate (Scharlau, Barcelona, Spain) were used for total monomeric anthocyanin determination by the pH-differential method.
2.2. Sample Preparation
Grapes (Vitis vinifera var. Cabernet Sauvignon) were collected from different cropping areas located at different regions in the Lebanese bekaa valey. Harvesting took place during summer/fall of 2010 (august till October). Grapes from different regions, sun exposure, maturity stage and localization on the vine were placed in a single container. All batch was crushed to obtain a fine grape paste (maximum particle size = 1 mm). The paste was frozen at –80˚C until use. Each tube/experimental point was subjected to a different parametrical pattern (Table 1). Extracts were then centrifuged (6000 g) and filtered through RC membranes (0.2 µm). Samples were kept at –80˚C ready to be analyzed.
2.3. Total Phenolic Compound Determination
Total phenolic compounds were determined according to the Folin-Ciocalteu reagent with the Micro method previously described by Andrew Waterhouse (Department of Viticulture and Enology, University of California, Davis, USA). The absorbance of each solution was determined at 765 nm against the blank. A calibration curve was created by plotting absorbance vs. concentration of the standards (solutions of different Gallic Acid concentrations) and the total phenols concentrations were determined in all samples. Phenolic Compound Yield (PCY) was calculated by transforming milligrams of Gallic Acid Equivalents (GAE) per liter (mgGAE/L) into grams of GAE per 100 g of grape paste or fresh weight (gGAE/100 g) which is %GAE.
2.4. Total Monomeric Anthocyanin Determination
Monomeric anthocyanins were measured by the pH-differential method, which relies on the structural transformation of the anthocyanin chromophore as a function of pH, which can be measured using optical spectroscopy [27]. Two dilutions of each sample were prepared using


Table 1. Central composite arrangement for independent variables and their responses for both extraction mixtures.
the appropriate, previously determined dilution factor, once with potassium chloride buffer at 0.025 M and pH 1.0 and the other with sodium acetate buffer at 0.4 m and pH 4.5. The dilutions were equilibrated for 15 min. The absorbance of each dilution was measured at the lvis-max vis-max and at 700 nm against blank cell filled with distilled water. The absorbance (A) of the diluted sample was calculated as follows:

The monomeric anthocyanin pigment (MAP) concentration in the original sample was calculated using the following formula:

where MW and molA are the molecular weight and the molar absorptivity, respectively of the pigment cyaniding- 3-glucoside used as reference; MW = 449.2 g/mole and molA = 26,900 mg–1·l–1·cm–1.
Milligrams of MA (Monomeric Anthocyanin) per liter of extract (mg/L) were then transformed into Monomeric Anthocyanin Yield (MAY) which is milligrams per 100 grams of grape paste or fresh weight (mg/100 g).
2.5. Experimental Design
In this response surface methodology study, a rotatable central composite design was used to evaluate the main effects of the factors: extraction time (X1), extraction temperature (X2), and solvent content (degree or percentage) (X3) and their interaction on total phenolic compounds and monomeric anthocyannins yields obtained from grapes (Vitis vinifera L. cv. Cabernet Sauvignon) using Acetone or Methanol separately as extraction solvents. Eighteen experiments (Table 1) were performed per extraction solvent mixture with six experiments as the repeatability of the measurements at the center of the experimental domain. All the factors levels are reported in Table 2. Data pertaining to three independent, and two response, variable were analyzed to get a multiple regression equation:
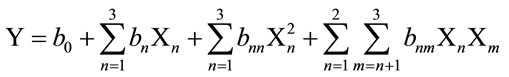
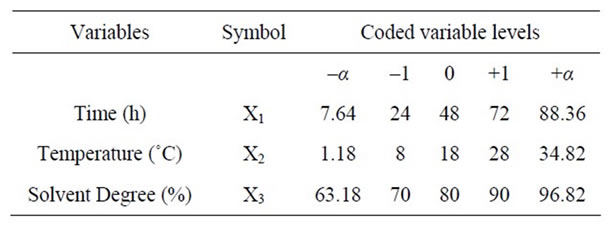
Table 2. Independent variables and their levels used for central composite rotatable design.
where Y is the predicted response, Xn and Xm are the coded values of the factors, b0 is the mean value of responses at the central point of the experiment; and bn, bnn and bnm are the linear, quadratic and interaction coefficients, respectively. The predicted values were obtained from the regression equation and analyzed for the calculation of the coefficient of determination (R2) (Table 3). Analysis of the coefficients of regression models was carried out using an ANOVA table to find the signifycance of each coefficient (Table 4). This significance was illustrated using Pareto charts (Figure 2). The significance of Lack of fit for each extraction model is shown in Table 5. The process was optimized using response surface methodology for two independent variables at a time. The third parameter was fixed at zero level. The surface graphs gave values of independent variables where the response variable is the maximum, considering that all the independent variable conditions can be identified for maximum PCY and MAY yields (Figures 3 and 4). The optimum experimental conditions were deduced from this study. Table 6 shows the best time, temperature and solvent degree where the highest PCY and MAY are obtained using A/W or M/W.

Table 3. Adequacy of the applied model indicated by the values of the coefficent of determination R2.

Table 4. Test of significance for each independent variable, quadratic and interaction effect between variables.
 (a)
(a)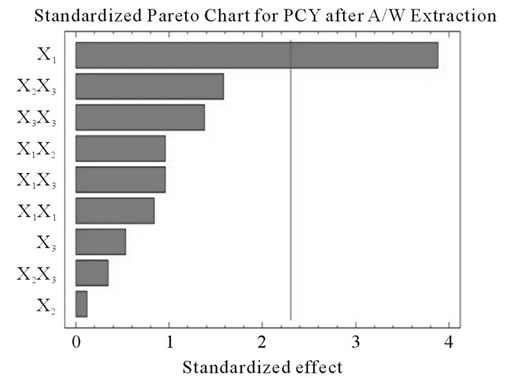 (b)
(b)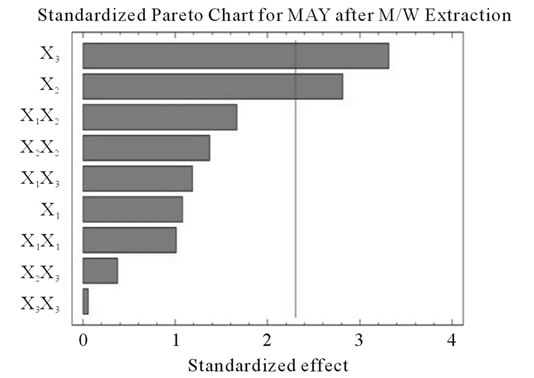 (c)
(c) (d)
(d)
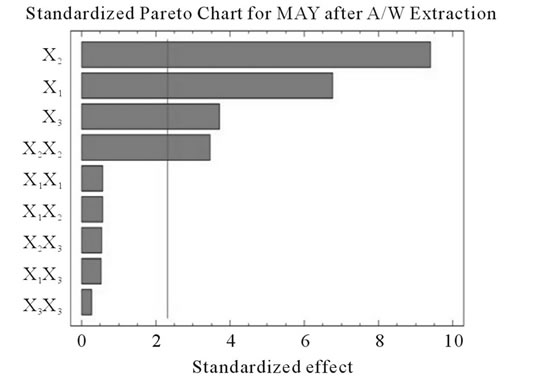
Figure 2. Standardized Pareto charts. Analysis shown for PCY (a) and MAY (b) using A/W and for PCY (c) and MAY (d) using M/W. The variables are; X1, time; X2, temperature; X3, solvent content; X1X1, X2X2 and X3X3, quadratic effect of time, temperature and solvent content respectively; X1X2, X1X3 and X2X3, interaction effect between time and temperature, time and Solvent content and temperature and solvent content respectively. It shows the columns/parameters exceeding the vertical bar which are statistically significant with more than 95% of confidence.

Table 5. Validation of the model showed by the Lack of fit values for the responses.
2.6. HPLC Analysis
Chromatographic analysis were carried out on a KNAUER (Germany) liquid chromatography apparatus, equipped with a WellChrom online degasser (K-5004), a WellChrom solvent organizer (K-1500), a WellChrom HPLC pump (K-1001), a dynamic mixing chamber, an auto-sampler WellChrom Basic Marathon (K-3800 cool), a column thermostat jet stream oven and a WellChrom Diode Array Detector (K-2800). ChromGate software version 2.8 (KNAUER, Germany) was used for data a quisition and analysis. Phenolic compounds were separated on a 250 mm × 4.6 mm Spherisorb S5 ODS2 column (Alltech, USA), which was controlled at 25˚C using the column thermostat jet stream oven. The chromatographic conditions were those proposed by [28], the mobile phase was: solvent A, water-formic acid (98:2); and solvent B, methanol-waterformic acid (68.6:29.4:2). The flow rate was 0.8 ml/min and the injection volume 20 µl. The gradient elution program was: 3 min at 0% B, to 10% B in 7 min, to 40% B in 50min, to 60% B in 20 min, to 100% B in 25 min, 15 min at 100% B and return to initial conditions in 20 min. Phenolic compounds were detected at 280 nm, 320 nm and 550 nm through characterization of their spectra. Peaks were identified by superimposing the spectra of each peak with the corresponding spectra of standard compound and through the comparison of their retention times. Quantification was based on peak area as determined by ChromGate software version 2.8 using external
 (a)
(a)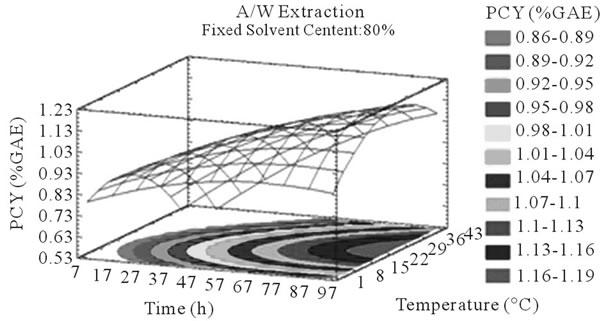 (b)
(b) (c)
(c)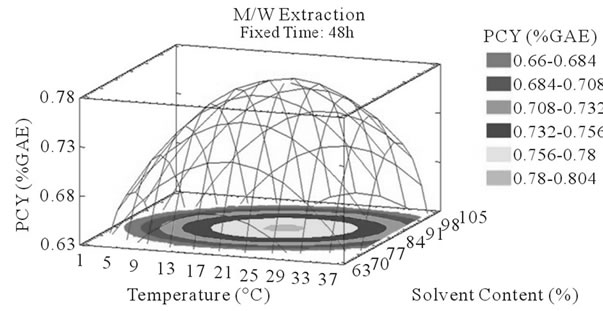 (d)
(d)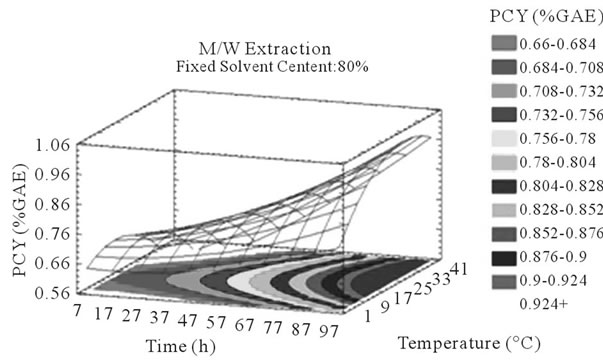 (e)
(e)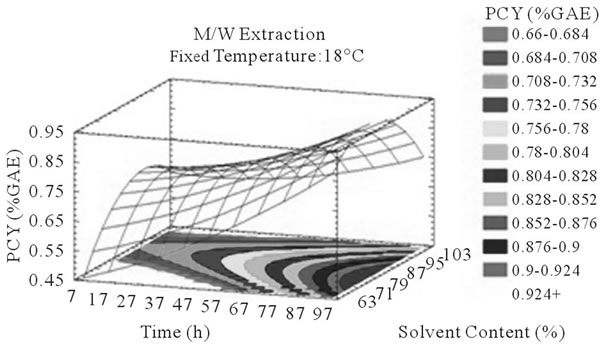 (f)
(f)
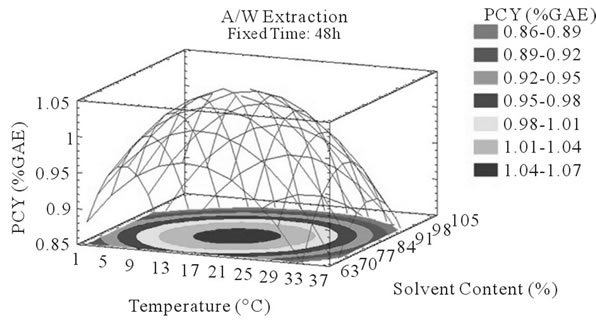
Figure 3. PCY response surface plots. Three dimensional expressions by response surface plots of PCY, using A/W (a, b, and c) or M/W (d, e, and f) as extraction mixtures. The three dimensional graphs were plotted between two independent variables (temperature and solvent content; a, and d, time and temperature; b, and e, and time and solvent content; c, and f) while the remaining independent variable (Time; a, and d, Solvent Content; b, and e, and Temperature; c and f) was kept at its zero level. The colored areas at the bottom of each graph indicate the iso-responses zones.
standards.
3. Results and Discussion
3.1. Optimal TPC and MA Yields
In order to determine the experimental conditions for optimal PCY and MAY a study using Response Surface Methodology was conducted. Table 2 shows the three experimental parameters, which are the independent variables, and their levels used in this central composite rotatable design. The values of the responses, which are the extraction yields of Phenolic Compounds or PCY (Phenolic Compounds Yield), and those of the Monomeric Anthocyanins or MAY (Monomeric Anthocyanin Yield), using M/W (Methanol /Water) or A/W (Acetone/Water) extraction mixtures, at different experimental combinations for coded variables, are given in Table 1. When using A/W mixture, the PCY ranged from 0.69% GAE to 1.16%GAE while the MAY ranged from 13.68 mg/100 g to 51.1 mg/100 g and when M/W was used, the PCY ranged from 0.5% GAE to 1.01% GAE while the MAY ranged from 42.47 mg/100 g to 61.55 mg/100 g. The
 (a)
(a) (b)
(b)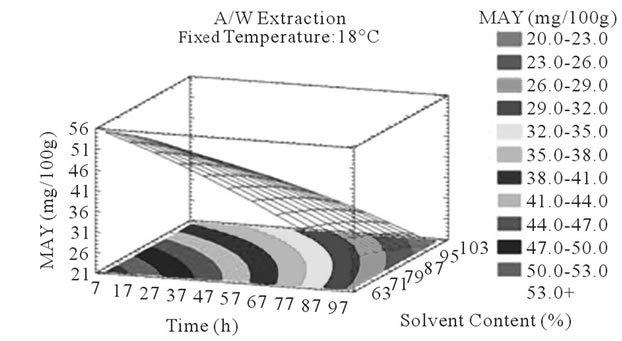 (c)
(c) (d)
(d) (e)
(e)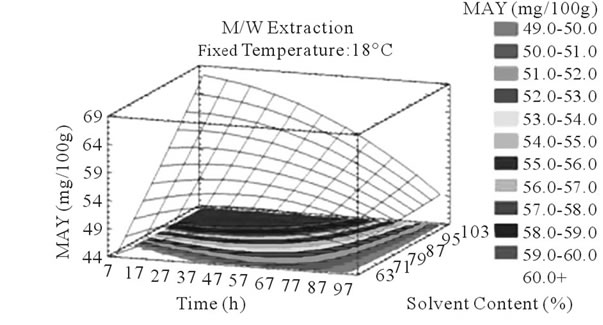 (f)
(f)
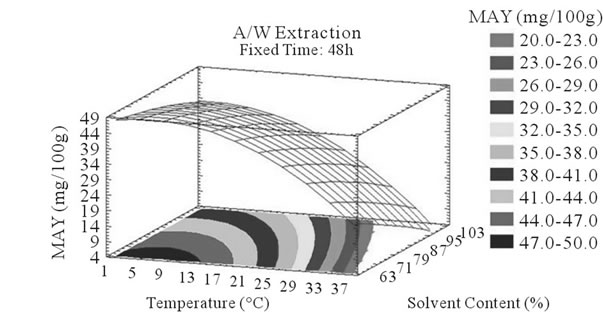
Figure 4. MAY response surface plots. Three dimensional expressions by response surface plots of MAY, using A/W (a, b, and c) or M/W (d, e, and f) as extraction mixtures. The three dimensional graphs were plotted between two independent variables (temperature and solvent content; a, and d, time and temperature; b, and e, and time and solvent content; c, and f) while the remaining independent variable (Time; a, and d, Solvent Content; b, and e, and Temperature; c and f) was kept at its zero level. The colored areas at the bottom of each graph indicate the iso-responses zones.

Table 6. Optimum experimental conditions for maximal extraction yields and value of responses at those conditions.
maximum value of PCY was found using 86.65% Acetone in Water, after 88.36h of extraction and at 25.62˚C. The maximum value of MAY was found using 96.82% of Methanol in Water, after 7.64 h of extraction and at 1.24˚C (Table 6). Throughout literature many PC extractions or extraction optimizations were done using different biological or food matrices (fresh grapes, grape marc, grape seeds, lettuce and chicory, aromatic herbs, cherries, fennel seeds, grapefruits, red beans, and black berry) investigating different experimental parameters like extraction time [16,26,29,30], extraction temperature [18,31, 32] and extraction solvent [13,22,24]… Although the optimal results of different studies could not be entirely compared because of the diversity of PC, the variability of the extraction procedure and the difference between starting material matrices, our study showed relatively high PCY of 1.19% GAE of fresh weight (grape paste) (Table 6) while [18] obtained a PCY of 0.27% GAE from powdered red grape marc and of 0.33% GAE from red grape stems, Revilla et al. (1998) [8] obtained 0.51% GAE of PCY from fresh grapes and 0.25% GAE from fresh red grape skins, Cruz et al. (2004) [31] got 0.22% GAE of PCY from distilled grape marc and Benvenuti et al., (2004) [33] yielded 0.88% GAE from Black berries. As for MA, we obtained in our conditions relatively low yields: 69.16 mg/100 g (Table 6) from fresh weight (grape paste) compared to others; Revilla et al. (1998) [8] obtained 111 mg/100 g from entire fresh grapes, and [34] had 152 mg/100 g from dried sweet potato.
3.2. Experimental Modelization and Statistics
By applying multiple regression analysis on the experimental data, the response variable and the test variables are related by the second order polynomial equations showed in Table 7.
The predicted values of PCY and MAY using A/W or M/W were calculated by the regression model and compared with experimental values (Table 1).
The values for the coefficient of determination (R2) were 72.51%, 95.27%, 75.92% and 77.19% for the experimental design of PCY and MAY in A/W mixture and of the same constituents in M/W mixture respectively (Table 3). The Value of R2 for MAY (0.9527) extracted by A/W mixture, is very close to 1, and indicates a high degree of correlation between the observed and predicted values, while the values of R2 for PCY (0.7251) in A/W mixture and for PCY (0.7592) and MAY (0.7719) in M/W are reasonably close to 1, indicating reasonable agreement of the corresponding models with the experimental results.
A significant lack of fit (P < 0.05) was found in all models corresponding to PCY and MAY by A/W and M/W extractions. This shows no fit of all four models to reality conditions, which means that the errors induced by the models are negligible compared to the manipulator errors (calculated from the repetitions at the field center). Thus the used models are considered as valid (Table 5).
3.3. Parameter Significance and 3D Plot Analysis
Table 4 shows the significance of each parameter after using the ANOVA test for the analysis of the coefficients of regression models. The effect of a parameter is considered as statistically significant when histograms cross the vertical line, translating the threshold of significance of 95%. So, according to Figure 2 and Table 4, and in the field of variation of the process parameters, the results showed that Time had a significant linear (X1) effect (p < 0.05) on the PCY extracted by both A/W and M/W mixtures, and on the MAY which was extracted by A/W mixture. On the other side, Temperature (X2) and Solvent content (X3) linear effect (p < 0.05) was only significant on the MAY extracted by both A/W and M/W mixtures. It was also noted that in our experimental conditions those last two factors didn’t have a significant effect on the PCY. In addition to this, the quadratic effect of temperature was also significant (p < 0.05) on the MAY extracted by A/W mixture (Table 4 and Figure 2).
The levels of independent variables for optimal ex-

Table 7. Second order polynomial equations relating reponse variables (PCY and MAY), to test variables (Time: X1, Temperature: X2 and Solvent Content: X3) using A/W and M/W as extraction mixtures.
traction conditions of PC and MA in A/W or M/W extraction mixtures were expressed in three dimensions using response surface graphs plotted between two independent variables while the remaining third independent variable was kept at zero level (Figure 3).
3.3.1. Extraction Time
In addition to the pareto charts, the significance of each parameter can be noticed from the shape of the response surface plots (Figures 3 and 4). It can be seen that time is a parameter that effects significantly the PCY in both Acetone (A/W) (Figures 3(a), (b), and (c)) and methanol (M/W) (Figures 3(d), (e) and (f)) extraction systems. Figures 3(b), (c), (e) and (f) show plots with a clear steepness in the inclination of their ascent, which can be translated into a significant increase of the PCY with the increase of the extraction Time. Thus, this parameter has a positive and significant effect on PCY.
Some studies in literature were in accordance with what we found like [26] who noticed an increase in the yield of a group of the PC, the proanthocyanidins with the increase of extraction time to 24 h after undergoing an extraction from dried seeds of grape marc, the same increasing effect in [35] study was also observed on powdered grape marc total phenolics after also 24 h of extraction process, Lapornik et al. (2005) [30] also observed increase in total phenolics with the extraction time from grape marc obtained after classic maceration using just water or 70% ethanol as extractants, but also (and in disagreement with what we found) a decrease in total phenolics from this same grape material using 70% methanol as extractant was noticed. Furthermore, as shown in Figures 4(b) and (c), extraction time effects significantly the MAY while using A/W as extraction mixture. This is apparent from the steepness in the inclination of the plot descent. In contrast, time showed little or insignificant effect on MAY in M/W extracts (Figures 4(e), and (f)). As an overview, Time has a negative effect on MAY, which decreased after 97 h of extraction time. Lapornik et al. (2005) [30] also showed a decrease in total anthocyanins with water extractions after a long extraction time similarly to what appeared in our study, but an increase in anthocyanins was noted using 70% ethanol and methanol as extractants. At this level we can observe, in function of time, a competition between two phenomena; extraction v/s oxidation.
3.3.2. Extraction Temperature
Throughout literature, temperature is shown to be one of the most critical variables to be affecting the release of phenolic compounds from grape matrix [12,18,31,35,36], due to increase in the coefficient of diffusion and solubility, in accordance most authors found an increase in the amount of total extracted phenols [18,36-38], while heating. In contrast, in the range of our study measurements (Figures 3(a) and (b)) an insignificant effect (p > 0.05) of temperature variation on the PCY was shown and in both extraction mixtures; A/W (Figures 3(a) and (b)), and M/W (Figures 3(d) and (e)). The corresponding plots (Figures 3(a) and (d)) are dome shaped, showing that at the fixed time level (48 h) we have reached a maxima value of PCY in the range of our measurements, and that an increase in the extraction temperature will increase the PCY until the value of 1.05% GAE and 0.78% GAE, in acetonic (Figure 3(a)) and methanolic extracts (Figure 3(d)) respectively after which the PCY will be decreased. The insignificant effect of temperature on the PCY in our study could be explained by the fact that we didn’t subject our material to higher extraction temperatures (>35˚C) where the impact on the PC yield should be noticeable due to bigger temperature ranges. Nevertheless, we chose instead to stay in the temperature margins that extracted at the same time both grape compound groups (PC and MA) without subjecting them to degradation. In the same context, literature showed temperature as one of the major degradation factors of the anthocyanins along with oxygen and photo degradation [39], in addition to this and according to [38] relatively low extraction temperatures (20˚C) were more suitable than high temperature (60˚C) for extracting higher MA yields from Cabernet and Merlot grapes.
In accordance to what was said previously, we noticed a statistical (p < 0.05) and negative influence of temperature on MA yields in both A/W (Figures 4(a) and (b)) and M/W (Figures 4(d) and (e)) mixtures; in fact, the corresponding plots showed a significant descent in the MAY towards higher temperatures (35˚C - 37˚C). Our samples subjected to extraction temperature as low as 2˚C showed higher MAY than samples extracted at temperatures around 35˚C. This could be explained by conformational change or degradation of Monomeric anthocyanins at higher temperatures or by color change and co-pigmentation, which is an interaction and coupling of the anthocyannins with other components making them trapped and undetectable by usual tests.
3.3.3. Extraction Solvent Mixture
Literature studies on extractions from grape materials showed that aqueous acetone was a better mixture for extracting PC (which had an overall unpolar character) than aqueous methanol [40,41] and that methanol extracted better than acetone or water the MAY [8,30,42,43]. In accordance with literature, our study results showed that the optimal PCY were obtained using A/W and not M/W as the extraction mixture, and that in contrast the optimal MAY was obtained using M/W and not A/W as the extraction mixture (Table 6). The effect of Acetone and Methanol content in water on the PCY showed to be statistically insignificant (p > 0.05) in the ranges of our study (Figures 2(a) and (c)), nevertheless, a maxima was reached between those ranges translated graphically by a dome (Figures 3(a) and (d)). As for the MAY, it was affected significantly (p < 0.05) by both the acetone and methanol contents in water (Figures 2(b) and (d)). According to literature, MA are better extracted using more polar solvents like methanol than by other organic solvents. On the second hand methanol and alcoholic solvents extracted better the anthocyanins than water. Our study showed a negative effect of acetone content in the A/W mixture on the MA yields (Figures 4(a) and (c)), meaning that MA are more affine to the water part of the mixture, in accordance to the previous assumptions. The same comment could as well be given for the positive effect of methanol content, in the M/W mixture, on the MAY (Figures 4(d) and (f)). Thus the affinity of solvents to the MAY is as follows: methanol, water than acetone.
3.4. Simultaneous Response Optimization
After that we showed the best experimental parameters to obtain an optimum of PCY and MAY taken separately, we used desirability function in the Response Surface Methodology that shows simultaneously the two responses (PCY and MAY) affected by the combination of the experimental parameters (Time, Temperature and Solvent Content). In this study, the desirability was set to show the best conditions that maximize PCY and MAY at the same time (Figure 5).
It can be seen that the PCY and the MAY concentric circles, converge towards very different regions in the superposition plots. Opposite localization of the optimum PCY and MAY are observed on plots (a), (b), (d) and (e) of Figure 5, this emphasizes that PC need long extraction time to reach a maximum Yield while on the contrary, MA are extracted in an optimal way in the first hours of the extraction process. Plots (a), (c), (d), and (f) also show how PCY are maximized at a middle range extraction temperature, while MA are extracted the best at very low extraction temperatures. The best solvent content ranges around 83% for both acetone (Figure 5(b) and (c)) and methanol (Figure 5(e), and (f)) for the PCY while very low acetone content (63%) (Figure 5(b), and (c)) and near absolute methanol (Figure 5(e) and (f)) are needed for the MAY. This divergence in optimal parameters for each response shows that we cannot maximize both PCY and MAY in the same extract. Nevertheless we can direct the extraction process, to obtain the best yield possible, and as the plots show (Figure 5, green mark) set the parameters to compromise between the PCY and MAY. In some other studies, parameters could be favored towards the PCY or the MAY, depending on which is more needed.
3.5. HPLC Determination of Molecular Distribution in Extract
In all of the above, we analyzed the changes in total PC inside extracts. We found it interesting to quantify the phenolic compound species in function of the parameters variation. Thereby, we chose to analyze extracts from experimental runs which underwent extreme extraction parameters. Thus, Runs 9 and 10 (–α/+α levels of Time), 11 and 12 (–α/+α levels of Temperature) and 13 and 14 (–α/+α levels of Solvent Content), were selected to be analyzed by HPLC (Table 8(a) and (b)). Nineteen different phenolic molecules which are normally present in grapes were used as standards. In A/W extraction conditions, time prolongation (Table 8; runs creased signifycantly the concentration of some phenolic compounds in the extract, like Gallic Acid (GA), Protocatechuic Acid (PCA), Gallocatechin (GC), p-Hydroxybenzoic Acid (PHBA), Epicatechin (EC), Gallocatechin gallate (GCG), Cinnamic Acid (CIA), Resveratrol (R), Quercetol (Q) and decreased significantly the extraction of Catechin (C), Myricetol (M) and Kaempferol (K). The phenolic compounds; Epigallocatechin (EGC), Ferulic Acid (FA), CIA, M, and K, showed significantly higher concentrations in the run 12 than in the run 11 and the phenolic compounds GC, PHBA, C, Resveratrol (R) and Rutin (RU) showed significantly lower concentrations in the extract of the run 12 compared to the one of the run 11. The phenolic compounds that have significantly higher concentration levels on experimental run 14 than those on experimental run 13 were PCA, GC, Chlorogenic Acid (CHA), Coumaric Acid (COA), FA, CIA, R, K, and the phenolic compounds that have significantly lower concentration level were EGC, and EC.
In Methanol extractions, time prolongation (Table 8; runs 9 and 10) increased significantly the concentration of some phenolic compounds in the extract, like Caffeic Aicd (CA), EC, COA, FA, CIA, Catechin gallate (CG), Q and decreased significantly the extraction of PCA, GC, PHBA, C, RU and M. The phenolic compounds PCA, PHBA, C, EGC, CA, CHA, COA and CIA showed significantly higher concentrations, and the phenolic compounds EC, GCG, CG, R, RU, Q and K showed signifycantly lower concentrations in the extract of the run 12 compared to that of the run 11. The phenolic compounds that had significantly higher concentration levels on experimental run 14 than those on run 13 were R, RU, Q and the phenolic compounds that had significantly lower concentration levels are EGC, and EC.
 (a)
(a)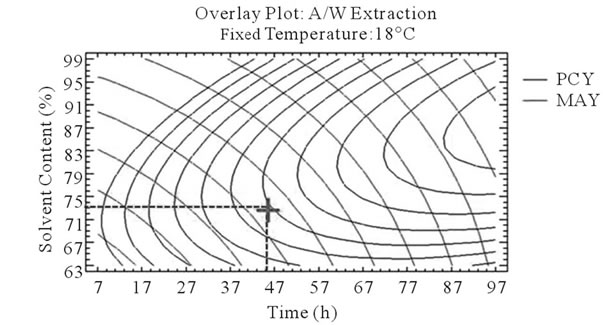 (b)
(b) (c)
(c) (d)
(d)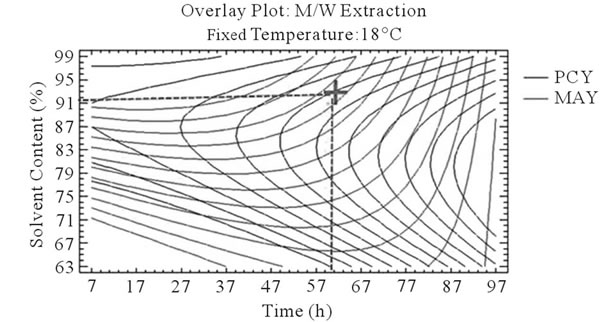 (e)
(e) (f)
(f)
Figure 5. Desirability analysis. Superposition plots, showing the best experimental parameters (time, temperature, and solvent content) that maximizes both PCY and MAY at the same time. In A/W (a, b, and c) and M/W (d, e, and f) extraction mixtures, the contours graphs were plotted between two independent variables (temperature and time; a, and d, solvent content and time; b, and e, and solvent content and temperature; c, and f) while the remaining independent variable (Solvent Content; a, and d, Temperature; b, and e, and Time; c, and f) was at its zero level. Green mark showing “middle way” parameters that compromise between PCY and MAY.
We translated the numerical data in Tables 8(a) and (b), concerning each phenolic compound concentration after HPLC analysis, into non numerical data (Table 9) showing the significant (increase or decrease) or insignificant changes in each phenolic compound group concentration. We aimed by this, to expose better the general tendency in the concentration changes of each phenolic compound group or family (Phenolic Acids, Stilbenes, Flavanols and Flavonols) and to show how these PC are being affected by parametrical (time, temperature and solvent content) changes.
4. Conclusions
In this study, we tried to fill some gaps in the knowledge of phenolic extraction from grapes. Recovering interesting chemical compounds from plant matrix for nutrition and clinical purposes, and keeping these compounds stable and biologically active showed to be, until today, a tricky task. Analysis of our results brought the following conclusions and aspects:
• Extracting or optimizing the extraction of phenolic compounds and anthocyanins from the Cabernet Sau-
 (a)
(a) (b)
(b)
Table 8. Phenolic compounds in µg/g of grape material after HPLC analysis of the extracts from the runs; 9, 10, 11, 12, 13 and 14 of the experimental design and for both acetone (A/W) or methanol (M/W) extraction solvent mixtures. For each extract we show the two fixed variables at their 0 level (Time, X1: 48 h, Temperature, X2: 18˚C, solvent percentage, X3: 80%) and the third variable at its highest (+α) or lowest (–α) level. Table (a) shows yields of phenolic acids and stilbenes in the twelve extraction conditions while table (b) shows yields of flavanols and flavonols in those same conditions.

Table 9. General tendancy of the quantities of phenolic compound families analyzed by HPLC when modifying one variable at a time (from its –α to its +α level) while fixating the 2 other variables at their 0 level.
vignon grapes can be done easily, without heavy or expensive machinery and could be environmentally friendly.
• The multiple response optimizations could be used to define the optimum area which can lead to choose the convenient ratio between PCY and MAY.
• Aqueous Acetone is better than Methanol and/or water in extracting total PC but Methanol seemed to be more suitable in the extraction of MA followed by water than Acetone.
• The Extraction time effect showed to be significant on the grape phenolic yields; MA were fast to extract from CS grapes, and 8 h as extraction time gave higher yields than longer time, while extraction yielded the maximum of PC after 88 h.
• The Extraction temperature had a significantly negative effect on the MA extraction and low extraction temperature (1˚C) yielded more MA then high extraction temperature (35˚C).
• It is nearly impossible to find the same extraction parameter to extract the majority of the different PC family groups (PA, S, Fa and Fo) because according to our study each PC had a different behavior towards changes in the extraction parameters.
After going through this investigation (present work and literature) and when using the best (concerning yield quantity, compound stability and radical scavenging activity) extract, phenolic compounds and anthocyanins could be used as food products preservatives as well as supplements and nutraceuticals. However, further investtigations are needed in order to draw safer conclusions about, the impact of extraction solvent, extraction time and extraction temperature on the grape PCY and MAY, and about group phenolic affinities to certain extraction parameters. Following studies should take into consideration bigger margins in temperature and solvent concentration variation (near water freezing to near water evaporating points and solvent/water: 0 to 100/100 to 0) to be able to tackle the problem of parameter significance and to reveal more the reactivity of the compounds. In addition to that, adding responses to the model (measurements using DPPH, sodium bisulfate…), will reveal antioxidant power and degradation level of the compounds; this will give a bigger extent to this work and could link it to further industrial applications.
5. Acknowledgements
We are grateful to Joseph Yaghi and Nada El Darra for technical assistance. The project was funded by the Research Council of Saint Joseph University, Lebanon (Project FS20).
REFERENCES
- Faostat, “World Grapes Production, ©FAO Statistics Division,” 2010. http://faostat.fao.org/site/567/DesktopDefault.aspx?PageID=567#ancor
- R. W. Hemingway, P. E. Laks and S. J. Branham, “Plant Polyphenols: Synthesis, Properties, Significance,” Plenum Press, New York, 1992.
- C. Flanzy, “Oenologie: Fondements Scientifiques et Technologiques, Tec and Doc-Lavoisier,” Tech and Doc/Lavoisier, Paris, 1998.
- M. F. Molina, I. Sanchez-Reus, I. Iglesias and J. Benedi, “Quercetin, a Flavonoid Antioxidant, Prevents and Protects against Ethanol-Induced Oxidative Stress in Mouse Liver,” Biological and Pharmaceutical Bulletin, Vol. 26, No. 10, 2003, pp. 1398-1402. doi:10.1248/bpb.26.1398
- C. Y. Chen, J. H. Jang, M. H. Li and Y. J. Surh, “Resveratrol Upregulates Heme Oxygenase-1 Expression via Activation of NF-E2-Related Factor 2 in PC12 Cells,” Biochemical and Biophysical Research Communications, Vol. 331, No. 4, 2005, pp. 993-1000. doi:10.1016/j.bbrc.2005.03.237
- C. Csaki, N. Keshishzade, K. Fischer and M. Shakibaei, “Regulation of Inflammation Signalling by Resveratrol in Human Chondrocytes in Vitro,” Biochemical Pharmacology, Vol. 75, No. 3, 2008, pp. 677-687. doi:10.1016/j.bcp.2007.09.014
- H. Akiyama, et al., “Dietary Unripe Apple Polyphenol Inhibits the Development of Food Allergies in Murine Models,” FEBS Letters, Vol. 579, No. 20, 2005, pp. 4485- 4491. doi:10.1016/j.febslet.2005.07.019
- E. Revilla, J. M. Ryan and G. Martin-Ortega, “Comparison of Several Procedures Used for the Extraction of Anthocyanins from Red Grapes,” Journal of Agricultural and Food Chemistry, Vol. 46, No. 11, 1998, pp. 4592-4597. doi:10.1021/jf9804692
- C. Negro, L. Tommasi and A. Miceli, “Phenolic Compounds and Antioxidant Activity from Red Grape Marc Extracts,” Bioresource Technology, Vol. 87, No. 1, 2003, pp. 41-44. doi:10.1016/S0960-8524(02)00202-X
- M. Palma and L. T. Taylor, “Extraction of Polyphenolic Compounds from Grape Seeds with Near Critical Carbon Dioxide,” Journal of Chromatography A, Vol. 849, No. 1, 1999, pp. 117-124. doi:10.1016/S0021-9673(99)00569-5
- R. Liorach, F. A. Tomas-Barberan and F. Ferreres, “Lettuce and Chicory Byproducts as a Source of Antioxidant Phenolic Extracts,” Journal of Agricultural and Food Chemistry, Vol. 52, No. 16, 2004, pp. 5109-5116. doi:10.1021/jf040055a
- G. K. Jayaprakasha, R. P. Singh and K. K. Sakariah, “Antioxidant Activity of Grape Seed (Vitis vinifera) Extracts on Peroxidation Models in Vitro,” Food Chemistry, Vol. 73, No. 3, 2001, pp. 285-290. doi:10.1016/S0308-8146(00)00298-3
- N. G. Baydar, G. Özkan and O. Sagdiç, “Total Phenolic Contents and Antibacterial Activities of Grape (Vitis vinifera L.) Extracts,” Food Control, Vol. 15, No. 5, 2004, pp. 335-339. doi:10.1016/S0956-7135(03)00083-5
- S. J. Cork and A. K. Krockenberger, “Methods and Pitfalls of Extracting Condensed Tannins and Other Phenolics from Plants: Insights from Investigations on Eucalyptus Leaves,” Journal of Chemical Ecology, Vol. 17, No. 1, 1991, pp. 123-134. doi:10.1007/BF00994426
- G. K. Jayaprakasha, T. Selvi and K. K. Sakariah, “Antibacterial and Antioxidant Activities of Grape (Vitis vinifera) Seed Extracts,” Food Research International, Vol. 36, No. 2, 2003, pp. 117-122. doi:10.1016/S0963-9969(02)00116-3
- M. Pinelo, P. Del Fabbro, L. Manzocco, M. J. Nuñez and M. C. Vicoli, “Optimization of Continuous Phenol Extraction from Vitis Vinifera Byproducts,” Food Chemistry, Vol. 92, No. 1, 2005, pp. 109-117. doi:10.1016/j.foodchem.2004.07.015
- Y. Yilmaz and R. T. Toledo, “Oxygen Radical Absorbance Capacities of Grape/Wine Industry Byproducts and Effect of Solvent Type on Extraction of Grape Seed Polyphenols,” Journal of Food Composition and Analysis, Vol. 19, No. 1, 2006, pp. 41-48. doi:10.1016/j.jfca.2004.10.009
- G. Spigno and D. M. De Faveri, “Antioxidants from Grape Stalks and Marc: Influence of Extraction Procedure on Yield, Purity and Antioxidant Power of the Extracts,” Journal of Food Engineering, Vol. 78, No. 3, 2007, pp. 793-801. doi:10.1016/j.jfoodeng.2005.11.020
- D. Bandoniene, A. Pukalskas, P. R. Venskutonis and D. Gruzdiene, “Preliminary Screening of Antioxidant Activity of Some Plant Extracts in Rapeseed Oil,” Food Research International, Vol. 33, No. 9, 2000, pp. 785-791. doi:10.1016/S0963-9969(00)00084-3
- A. Chaovanalikit and R. E. Wrostald, “Anthocyanin and Polyphenolic Composition of Fresh and Processed Cherries,” Journal of Food Science, Vol. 69, No. 1, 2004, pp. 73-83. doi:10.1111/j.1365-2621.2004.tb17859.x
- M. Oktay, I. Gul and I. Kufrevioldu, “Determination of in Vitro Antioxidant Activity of Fennel (Foeniculum Vulgare) Seed Extracts,” Lebensmittel-Wissenschaft und-Technologie, Vol. 36, No. 2, 2003, pp. 263-271.
- S. Gorinstein, M. Svikrova, I. Machackova, R. Haruenkit, J. S. Park and S. T. Jung, “Characterization of Antioxidant Compounds in Jaffa Sweeties and White Grapefruits,” Food Chemistry, Vol. 84, No. 4, 2004, pp. 503-510. doi:10.1016/S0308-8146(03)00127-4
- S. T. Chou, W. W. Chao and Y. C. Chung, “Antioxidative Activity and Safety of 50% Ethanolic Red Bean Extract (Phaseolus radiatus L. var. Aurea),” Journal of Food Science, Vol. 68, No. 1, 2003, pp. 21-25. doi:10.1111/j.1365-2621.2003.tb14108.x
- T. Siriwoharn and R. E. Wrolstad, “Polyphenolic Composition of Marion and Evergreen Blackberries,” Journal of Food Science, Vol. 69, No. 4, 2004, pp. 233-240.
- F. Bonilla, M. Mayen, J. Merida and M. Medina, “Extraction of Phenolic Compounds from Red Grape Marc for Use as Food Lipid Antioxidants,” Food Chemistry, Vol. 66, No. 2, 1999, pp. 209-215. doi:10.1016/S0308-8146(99)00046-1
- B. Pekic, V. Kovac, E. Alonso and E. Revilla, “Study of the Extraction of Proanthocyanidins from Grape Seeds,” Food Chemistry, Vol. 61, No. 1-2, 1998, pp. 201-206. doi:10.1016/S0308-8146(97)00128-3
- M. M. Giusti and R. E. Wrolstad, “Characterization and Measurement of Anthocyanins by Uv-Visible Spectroscopy,” Current Protocols in Food Analytical Chemistry, John Wiley and Sons, Inc., New York, 2001.
- P. Ho, T. A. Hogg and M. C. M. Silva, “Application of a Liquid Chromatographic Method for the Determination of Phenolic Compounds and Furans in Fortified Wines,” Food Chemistry, Vol. 64, No. 1, 1999, pp. 115-122. doi:10.1016/S0308-8146(98)00115-0
- E. Alonso, M. Bourzeix and E. Revilla, “Suitability of Water/Ethanol Mixtures for the Extraction of Catechins and Proanthocyanidins from Vitis Vinifera Seeds Contained in a Winery by-Product,” Seed Science and Technology, Vol. 19, 1991, pp. 542-552.
- B. Lapornik, M. Prošek and A. G. Wondra, “Comparison of Extracts Prepared from Plant by-Products Using Different Solvents and Extraction Time,” Journal of Food Engineering, Vol. 71, No. 2, 2005, pp. 214-222. doi:10.1016/j.jfoodeng.2004.10.036
- J. M. Cruz, H. Dominguez and J. C. Parajo, “Assessment of the Production of Antioxidants from Winemaking Waste Solids,” Journal of Agricultural and Food Chemistry, Vol. 52, No. 18, 2004, pp. 5612-5620. doi:10.1021/jf049376c
- D. Amendola, D. M. De Faveri and G. Spigno, “Grape Marc Phenolics: Extraction Kinetics, Quality and Stability of Extracts,” Journal of Food Engineering, Vol. 97, No. 3, 2010, pp. 384-392. doi:10.1016/j.jfoodeng.2009.10.033
- S. Benvenuti, F. Pellati, M. Melegari and D. Bertelli, “Polyphenols, Anthocyanins, Ascorbic Acid, and Radical Scavenging Activity of Rubus, Ribes, and Aronia,” Journal of Food Science, Vol. 69, No. 3, 2004, pp. 164-169.
- G. Fan, Y. Han, Z. Gu and D. Chen, “Optimizing Conditions for Anthocyanins Extraction from Purple Sweet Potato Using Response Surface Methodology (RSM),” LWT— Food Science and Technology, Vol. 41, No. 1, 2008, pp. 155-160.
- G. Spigno, L. Tramelli and D. M. De Faveri, “Effects of Extraction Time, Temperature and Solvent on Concentration and Antioxidant Activity of Grape Marc Phenolics,” Journal of Food Engineering, Vol. 8, No. 1, 2007, pp. 200-208. doi:10.1016/j.jfoodeng.2006.10.021
- M. Pinelo, M. Rubilar, M. Jerez, J. Sineiro and M. J. Nuñez, “Effect of Solvent, Temperature, and Solvent-to-Solid Ratio on the Total Phenolic Content and Antiradical Activity of Extracts from Different Components of Grape Pomace,” Journal of Agricultural and Food Chemistry, Vol. 53, No. 6, 2005, pp. 2111-2117. doi:10.1021/jf0488110
- N. Türker and F. Erdogdu, “Effects of pH and Temperature of Extraction Medium on Effective Diffusion Coefficient of Anthocynanin Pigments of Black Carrot (Daucus carota var. L.),” Journal of Food Engineering, Vol. 76, No. 4, 2006, pp. 579-583. doi:10.1016/j.jfoodeng.2005.06.005
- T. Vatai and M. Skerget, “Extraction of Phenolic Compounds from Elder Berry and Different Grape Marc Varieties Using Organic Solvents and/or Supercritical Carbon Dioxide,” Journal of Food Engineering, Vol. 90, No. 2, 2009, pp. 246-254. doi:10.1016/j.jfoodeng.2008.06.028
- R. L. Jackman, R. Y. Yada, M. A. Tung and R. A. Speers, “Anthocyaninsas Food Colorants—A Review,” Journal of Food Biochemistry, Vol. 11, No. 3, 1987, pp. 201-247. doi:10.1111/j.1745-4514.1987.tb00123.x
- K. Zhou and L. Yu, “Effects of Extraction Solvent on Wheat Bran Antioxidant Activity Estimation,” Lebens-mittel-Wissenschaft und-Technologie, Vol. 37, No. 7, 2004, pp. 717-721.
- Q. Liu and H. Yao, “Antioxidant Activities of Barley Seeds Extracts,” Food Chemistry, Vol. 102, No. 3, 2007, pp. 732-737. doi:10.1016/j.foodchem.2006.06.051
- Z. Y. Ju and L. R. Howard, “Effects of Solvent and Temperature on Pressurized Liquid Extraction of Anthocyanins and Total Phenolics from Dried Red Grape Skin,” Journal of Agricultural and Food Chemistry, Vol. 51, No. 18, 2003, pp. 5207-5213. doi:10.1021/jf0302106
- R. P. Metivier, F. J. Francis and F. M. Clydesdale, “Solvent Extraction of Anthocyanins from Wine Pomace,” Journal of Food Science, Vol. 45, No. 4, 2006, pp. 1099-1100. doi:10.1111/j.1365-2621.1980.tb07534.x
NOTES
*Corresponding author.