Journal of Environmental Protection
Vol. 3 No. 9 (2012) , Article ID: 22710 , 8 pages DOI:10.4236/jep.2012.39125
Correlation between Heavy Metals in Fish and Sediment in Sakumo and Kpeshie Lagoons, Ghana
![]()
1Department of Chemistry, Faculty of Science, University of Ghana, Legon, Ghana; 2Fire Academy and Training School, Ghana National Fire Service, Accra, Ghana.
Email: *rkklake@ug.edu.gh
Received April 18th, 2012; revised June 3rd, 2012; accepted July 2nd, 2012
Keywords: Heavy Metal Pollution; Industrial Effluents; Toxicity; Health Hazards; High Population Growth
ABSTRACT
Concentrations of heavy metals (Cd, Pb, Mn, Zn, and Cu) were measured in bottom sediment and the black-chin tilapia (Sarotherodon melanotheron) from the Sakumo and Kpeshie lagoons using Atomic Absorption Spectrometry (AAS). Results for the levels of these metals in the sediments and fish were compared with WHO guideline values. It was observed that heavy metal concentrations in sediments of Sakumo lagoon were higher than those of Kpeshie lagoon. Among the metals, Cu and Zn were found to be highly concentrated in the fish but lower than the World Health Organization (WHO) recommended values. Spearman correlation coefficient study showed significant correlation coefficients between Pb and Zn (0.937) and between Cu and Mn (0.613) at 0.05 levels.
1. Introduction
Heavy metals are usually present at low concentrations in water; however, deposits from anthropogenic sources could increase the concentrations of these heavy metals in the aquatic to high levels therefore creating environmental problems in coastal zones, lakes and rivers.
High concentrations of Heavy metals in fish could pose health hazards to consumers. Heavy metals such as Lead (Pb), Copper (Cu), Cadmium (Cd) and Mercury (Hg) are non-degradable. Consequently, they accumulate in the components of the environment where their toxicity is expressed. The ultimate sinks for these heavy metals are soils and sediments. Many aquatic organisms do however bioconcentrate heavy metals. For example, Oysters and mussels can contain levels of Hg and Cd that are 100,000 times greater than those in the water in which they live. The amounts of metals that are ingested through our food supply are usually of much greater concern than the intake attributed to drinking water. The toxicity of a given concentration of a heavy metal present in a natural waterway depends on factors such as pH, the amount of dissolved and suspended carbon as well as the oxidation state [1]. The reduction of Cu(II) to Cu(I) may influence copper toxicity) [2]. Heavy metals such as Cu in particular may be toxic to fish and humans [3].
The Sakumo lagoon provides fish for the coastal community [4]. It is also a habitat for resident and migratory birds [5]. The north of the lagoon is drained with streams [6] which serve as waste receptacle from Industrial activities and the local coastal community.
The Sakumo lagoon and other coastal lagoons have been studied [7-9]. These studies involved physicochemical characteristics, limnology and monitoring of the pollution status of these coastal lagoons. Heavy metals such as Fe, Cu, Mn, Pb, Cd and Zn have been determined in water and sediment of these lagoons.
However, to date there has not been a dual study on the sediments and the fish in the Sakumo and Kpeshie Lagoons of Ghana, correlations between these trace metals in the sediments and fish have also not been studied. This study is important because knowledge of the distribution of these metals in sediments, fish as well as their correlations will give researchers and other stake holders evidence of anthropogenic pollution as well as the dangers the latter poses to the environment. In addition, this knowledge will have significant environmental implications for the local community and water quality.
The objective of the study is to investigate the effects of anthropogenic activities with respect to metal pollution by: 1) the determination of heavy metal concentrations in sediment and fish; 2) comparison of metal concentrations in sediment and fish on dry weight basis; and 3) determination of any correlation that may exist in the Sakumo and Kpeshie lagoons of Ghana.
2. Materials and Methods
2.1. First, Study Area
The Sakumo Lagoon is situated 3 km west of the Tema Township on the beach road linking Accra to Tema. It has geographic co-ordinates as 05˚40′N 00˚10′W and located to the east of Accra, Ghana. The site comprises an open lagoon flood plain and fresh water marsh. The open lagoon covers an area of 1 km2 in the dry season, but in the wet season, the entire flood plain may be inundated, increasing the surface area to about 10 km2. The wetland is a habitat to about thirteen (13) fish species belonging to thirteen (13) genera and eight (8) families with Sarotherodon melanotheron also known as the Black-Chin tilapia (name for the black coloration often present under the chin) consisting of about 97% of the fish population [4]. The predominant soils consist of black calcareous, heavy plastic clays suitable for mechanized irrigated cultivation of rice and vegetables.
2.2. Hydrology
The Lagoon is separated from the sea by a narrow sand dune on which the Accra-Tema coastal road is built. The coastal brackish/saline lagoon is connected to the sea by an old sluice. The catchment area of the Sakumo Ramsar site is drained by a number of streams, which flow into the brackish water of the Sakumo lagoon. A number of freshwater marshes are present along most of the river course within the Ramsar Site. Four principal sub-drainage basins have been identified in the area. The major ones are the Mamahuma-Onukpawahe (at the western side) and the Dzorwulu-Gbagbla-Ankonu (situated at the northern end) sub-basins. The Eastern and Southern subbasins constitute the minor ones. The catchment area has limited groundwater potentials because of low rainfall and the impermeability of the soil [10].
The main feeder streams, the Dzorwulu and Mamahuma have been re-channeled for irrigation. The Dzorwulu stream has a dam on it situated north of Ashaiman town near Santeo. The Mamahuma stream also has a dam on its upper catchment area. This has resulted in very little flow of freshwater into the lagoon during the dry season [11]. The drainage system of the Sakumo Ramsar site is shown in Figure 1.
The Kpeshie Lagoon is situated at La peri-urban township just outside Accra. The lagoon is less than 1 km2 in surface area. The lagoon is currently heavily silted and polluted. It is bounded on the east by the Military Academy at Teshie, on the north by a line south of Madina and Ajirignano. It covers the eastern part of Accra, Ridge, Cantonments, Osu, Labadi and Burma camp areas. Streams in the catchment generally flow north to south, emptying directly into the principal outlet to the sea at Kpeshie Lagoon.
However, in the past it served as a major fishing ground for the local consumers at Kpeshie [12]. Kpeshie catchment is shown in Figure 2.
2.3. Sample Collection
Sediment samples were taken from five points to depth of 5 cm, at intervals of 200 m, along the bank of the lagoon using an auger. At each point, three samples were taken and combined to form a composite sample of about 150 g. The auger was washed well with the lagoon water before scooping from a different point. Each time, a spatula was carefully used to scoop out the sediment from the auger. The spatula was also washed at each point of sampling. This was to avoid contamination of samples. Samples were placed in polyethylene bags which had been labeled according to their points of sampling. Thirty (30) fish (Sarotherodon melanotheron) samples, caught with a net from various points, were bought from five fishermen. The sizes of the fish were about the same. The samples were then transported to Water Research Institute (WRI) laboratory, in Accra for analysis. The location of sampling sites are shown in Table 1.
2.4. Sample Preparation
The scales of the fish were removed, washed with tap water and the piece of flesh above the lateral line anterior to the dorsal fin was taken from each fish. Both the fish and sediment samples were sun-dried and then dried in an oven at 105˚C to constant weight in the laboratory. The drying was to make the sample anhydrous by removing adsorbed moisture; this was to ensure reproducible analytical results; and to calculate the concentration on a dry basis. After allowing the sample to cool, subsamples were taken by scooping the finer sediment particles with a spatula, ground with porcelain mortar and pestle and sieved through a 106 μm mesh. The grounding was to produce a homogeneous sample for analysis. Pieces of dried fish were also selected at random to form a sub-sample. The sub-sample was milled in a porcelain mortar and pestle to pass a 106 μm aperture sieve to achieve a homogenized sample for the analysis.
2.5. Analytical Method
Atomic Absorption Spectrometry (AAS)
Flame Atomic Absorption Spectrometry was used for the determination of Cu2+ (Copper), Zn2+ (Zinc), Mn2+ (Manganese), Pb2+ (Lead), and Fe2+ (Iron).
2.6. Chemical Analysis
Nitric Acid Digestion
Washed Teflon vessels were soaked in concentrated nitric acid and left to stand overnight. They were then

Figure 1. Map showing the catchment area of Sakumo Lagoon.

Figure 2. Map showing the catchment area of Kpeshie lagoon Kpeshie catchment.

Table 1. Geographical location of sampling sites.
rinsed with deionized water and dried in the oven. Approximately 0.2 g of sediment and fish samples were weighed into the Teflon vessels avoiding contact with the sides of the vessels. Using a pipette, 2.5 ml concentrated nitric acid was added slowly to each sample in the Teflon vessels. Blanks were prepared in a similar fashion alongside the sediment and fish samples. The Teflon vessels contained only 2.5 ml of concentrated nitric acid. The laboratory used IAEA 356 as certified reference material for sediment. IAEA 350 was used as the certified reference material for fish samples. Five samples with one sediment standard and one fish standard were digested for analysis with two blanks at a time. The vessels were closed and placed in stainless steel bombs. The block of bombs were placed on a hot plate and heated under pressure at 150oC for seven hrs. The samples were allowed to cool to room temperature after which the pressure was carefully released and the bombs opened. The samples were transferred into labeled 50 ml polypropylene tubes. The Teflon was rinsed three times with deionized water. The water from the rinsing was subsequently added to the polypropylene tubes. The content of each tube was diluted to the 25 ml mark with deionized water and mixed thoroughly. The tubes were closed and left to stand overnight to allow the particles to settle.
3. Results and Discussion
3.1. Heavy Metal Concentrations
The samples, standards, and blanks were analyzed for Zn, Cu, Pb, Mn and Cd using UNICAM 969 AAS. The results of this analysis are presented in Tables 2-4 and Figures 3 and 4. The tables include mean concentrations, standard deviations, range and coefficient of variation. The detection limit of metals on the UNICAM 969 for Zn (<0.005 mg/L or 0.625 mg/kg), Cu (<0.020 mg/L or

Table 2. Mean concentrations, standard deviation, and the errors associated with the mean concentrations (Sm) at the 95% confidence level, and the coefficient of variation (CV) of the trace metals in sediments from the Sakumo lagoon.

Table 3. Mean concentrations, standard deviations and the errors associated with the mean concentrations (Sm) at the 95% confidence level of the trace metals in sediments from the Kpeshie lagoon.

Table 4. Pearson correlation between trace metals in sediments from Sakumo lagoon.
2.5 mg/kg), Pb (<0.005 mg/L or 0.625 mg/kg, Mn (< 0.005 mg/L or 0.625 mg/kg) and Cd (<0.002 mg/L or 0.25 mg/kg).
The analysis show that Mn concentration was high in both sediments at Sakumo and Kpeshie lagoon with Mn concentration from Sakumo dominating at the sampling points as shown in Figures 3 and 4. In general term, heavy metal concentrations were higher in sediments than in the case of fish. This indicates that sediments are a better absorber of metals than fish [13]. Among the metals, Zn and Cu concentrations were higher in fish than Pb, Mn, and Cd. The 29.81 µg/g of Cu in the fish from Sakumo lagoon is very close to 30 µg/g concentration of the recommended value of WHO [14], and therefore could not pose risk to fish consumers (Table 5).
The range of heavy metal concentrations in sediments varies greatly between Sakumo and Kpeshie lagoons Table 2, with Sakumo having the high range in sediment. This can be attributed to the anthropogenic activities in the two catchment areas.
Generally, the results show wide variations. These variations are what have given rise to large standard deviations. Consequently, concentrations are affected by extreme values (high or low). From Table 2, the levels of the trace metals were not uniformly distributed within the sampling area of the Sakumo lagoon. There were no well-defined trends in the levels of the trace metals seaward. This is because the area is low-lying and drains the surrounding areas during the rainy season. Figures 3 and 4 are bar graphs which show the levels and the trends of the trace metals. The levels of Cd were below the detection limit of 0.25 μg/g. Thus the sediments were free of Cd pollution. Mn levels were the highest in sediments, the highest level being 655.12 μg/g. The lowest concentration of 6.47 μg/g was recorded for Pb. The coefficients of variation (Table 2) of the trace metals increase in the order Zn < Cu < Mn < Pb. Pb showed the greatest variation in concentration while Zn levels were most consistent. Using the mean concentrations of the trace metals, the Pearson correlation analysis [15], was used to assess correlation between metals.
In the Kpeshie lagoon sediments, Mn again recorded the highest levels of 122.77 μg/g. Cd levels were below detection. Pb levels increased seawards but close to the sea, the levels were below detection limit. Mn levels generally increased seawards. The lowest concentration of 4.58
μg/g was recorded for Zn. The coefficient of variation increased in the order Cu < Mn < Pb < Zn. Zn concentrations varied the most while Cu levels varied the least.
3.2. Human Consumption
The permissible limits proposed by the WHO in fish and
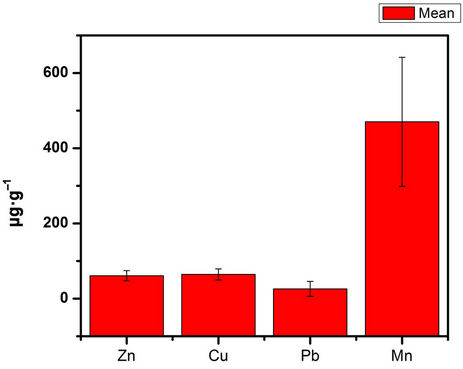
Figure 3. Bar graph showing the concentrations of trace metals and standard deviations at the sampling points for Sakumo lagoon.

Figure 4. Bar graph showing concentration of trace metals and standard deviations at the sampling points for Kpeshie lagoon.

Table 5. Comparison between trace metal levels in Sakumo and Kpeshie sediments.
the levels in fish are shown in Table 6. Cu levels were the highest (29.81 μg/g) while Pb and Cd levels were below detection limits of 0.625 μg/g and 0.25 μg/g respectively. Fish consumption therefore does not pose any health hazard from Pb and Cd. Mn levels were the lowest (0.822 μg/g) detected in fish though the highest in sediments. This could be due to their low availability in the feeds of the fish or their rate of excretion is higher than Cu. From Table 6, the levels of both Cu and Mn are below the WHO limit. The level of Zn in fish (21.36 μg/g) was well within the acceptable range recommended by the World Health Organization [14,16]. The levels of these five trace toxic heavy metals are low. Consequently, the fish is safe for consumption.
3.3. Correlation Studies in Sediment of the Sakumo and Kpeshie Lagoons
The correlation between element pairs in sediment from the Sakumo and Kpeshie lagoons are shown in Tables 4 and 7 respectively. The Pearson correlation (Table 4) shows a positive correlation between the trace metals, except that between Cu and Mn which showed some negative correlation. The correlation between Zn and Pb, and between Cu and Pb were above 0.5 while the others were below 0.5. However, at the 0.05 or 95% confidence level (2-tailed), the correlation between Zn and Pb was significant but that between Cu and Pb was not significant. The geochemical behaviors of Zn and Pb are known to be similar in most natural processes [17]. This could explain the high correlation and suggests minimal or no anthropogenic inputs [18]. The levels of these trace metals pose no environmental concern. Though the lagoon receives effluents from industries, surface runoffs and domestic wastes, the levels of input of these trace metals are low [19]. Thus the trace metal concentrations are likely to be a result of natural background levels rather than pollution [20].
Pearson Correlation table (Table 7) for Kpeshie Lagoon shows a positive correlation between the trace metals, except that between Cu and Pb which showed a small negative correlation. The correlation between Zn and Pb, Zn and Mn and between Cu and Mn were above 0.5 while the others were below 0.5. However, at the 0.05 or 95% confidence level (2-tailed), only the correlation between Zn and Pb was significant. This high correlation could be accounted for by the geology of the area. There are no industries along the bank of the lagoon. Domestic waste and surface runoffs from agricultural fields are likely to make minor inputs into the Kpeshie lagoon [21]. Natural geochemical processes are more likely to account for the trace metal levels in the sediments as well [22].
The Sakumo lagoon has higher levels of Cu and Mn than the Kpeshie lagoon. This may be due to the larger drainage area of the Sakumo lagoon as compared with than

Table 6. showing a comparison between the WHO limits for the trace heavy metals in fish and the determinations.

Table 7. Pearson correlation between trace metals in sediments from Kpeshie lagoon.
the Kpeshie lagoon as well as differences in bedrock. There were no significant differences in Zn, Pb and Cd levels in sediments from the two lagoons.
4. Conclusion
There is high positive and significant correlation between Zn and Pb concentrations in sediments from the Sakumo and Kpeshie lagoons. The levels of Zn, Pb and Cd are not significantly different considering the concentration ranges, the population means and their error margins. By similar considerations, Cu and Mn levels are significantly higher in sediments from Sakumo lagoon. The concentrations of Zn, Cu, Pb, Mn and Cd in the black-chin tilapia (Sarotherodon melanotheron) do show that the levels in fish were low and consequently did not pose health hazards to consumers. The high concentrations of trace heavy metals in sediments of Sakumo lagoon may pose hazards to benthic organisms in the lagoon.
REFERENCES
- C. Baird, “Environmental Chemistry,” 2nd Edition, W. H. Freeman and Company, New York, 1995, 557 p.
- A. R. Hites and S. J. Eisenreich, “Sources and Fates of Aquatic Pollutants,” America Chemical Society, Washington DC, 1987, pp. 154-181.
- E. A. Laws, “Aquatic Pollution: An Introductory Text,” 2nd Edition, John Wiley and Sons, Inc., New York, 1993, 611 p.
- K. A. Koranteng, “Ghana Coastal Wetlands Management Project,” World Bank, Washington DC, 1995.
- Y. Ntiamoa-Baidu and C. Gordon, “Environmental Resource Management Project. Biodiversity Component. Coastal Wetlands Management Plans: Ghana,” World Bank/EPA, Accra, 1991, pp. 2-13.
- J. K. Amatekpor, “Landuse in the Ramsar Areas: In Development Options for Coastal Wetland,” GERMP Draft Final Report, EPA/NRI, Accra/London, 1998.
- C. A. Biney, “Preliminary Physico-Chemical Studies of Lagoons along the Gulf of Guinea in Ghana,” Journal of Tropical Ecology, Vol. 27, No. 2, 1986, pp. 147-156.
- C. A. Biney, “Environmental Baseline Studies-Limnology, Sakumo II Lagoon,” Ghana Coastal Wetlands Management Project, Accra, 1995.
- C. A. Biney, R. Asmah and K. A. Asante, “Monitoring Pollution in Coastal Lagoons of Ghana. Gulf of Guinea Large Marine Ecosystem Project,” Ghana Tropical Ecology, Vol. 27, 1998, pp. 147-156.
- G. T. Agyepong, “Coastal Wetlands Management Project. Management Plan for Sakumo Ramsar Site,” Department of Game and Wildlife, Government of Ghana, Accra, 1999, 45 p.
- J. K. Amatekpor, “Hydrology of the Ramsar Areas. In Development Options for Coastal Wetland,” GERMP Draft Final Report, EPA/NRI, Accra/London, 1998.
- M. Ansah, “The Use of Natural Systems for the Treatment of Greywater: A Case Study of Kpeshie Lagoon,” M.Sc Thesis, Kwame Nkrumah University of Science and Technology, Kumasi, 2006.
- R. H. Asmah, “Heavy Metal Partitioning in the Scheldt Estuary: Implications for Metal Bioavailability to Filter Feeding Mussels (Mytillus edulis),” M.Sc Thesis, RUCA. Brussel, 2000, 59 p.
- http://www.who.int/water_sanitation_health (Accessed 5 March 2012).
- R. O. Gilbert, “Statistical Methods for Environmetal Pollution Monitoring,” Wiley, Hoboken, 1987, pp. 1-4.
- C. E. Nauen, “Compilation of Legal Limit for Hazardous Substances in Fish and Fishery Products,” Food and Agriculture Organization of the United Nations, Rome, 1983, p. 102.
- A. W. Muohi, “Heavy Metal Distribution in Surface Sediments from Mtwapa and Hirazi Creeks, Kenyan Coast,” Springer-Verlag Inc., New York, 2003.
- K. A. Asante, “Distribution of Trace Elements in the Environment. Case Study in the East China Sea and Ghana,” M.Sc Thesis, Graduate School of Agriculture, Ehime University, Matsuyama, 2005.
- J. Bogen, T. Fergus and D. E. Walling, “Erosion and Sediment Transport Measurement in Rivers: Technological and Methodological Advances,” IAHS 283, Wallingford, 2003, 238 p.
- J. Klein, “Water Pollution in the Accra-Tema Metropolitan Area. Source and Impacts,” M.Sc Thesis, Eindhoven University of Technology, Eindhoven, 2002.
- T. Hellstrom, “Heavy Metal Transport in the Environment from a Point Source—A Case Study of a Smelter Industry,” Lunds Universitet, Lund, 1980.
- A. S. Keith, A. C. Duxbury and A. B. Duxbury, “An Introduction to the World’s Oceans, 7th Edition, McGrawHill Companies, Inc., New York, 2003.
NOTES
*Corresponding author.