American Journal of Plant Sciences
Vol.4 No.7(2013), Article ID:34333,8 pages DOI:10.4236/ajps.2013.47174
Characterization of Microsatellite Markers and Their Application to Genetic Diversity Analysis of Brachypodium sylvaticum var. breviglume from Yunnan, China
![]()
1Plant Germplasm and Genomics Center, Germplasm Bank of Wild Species in Southwest China, Kunming Institute of Botany, Chinese Academy of Sciences, Kunming, China; 2University of the Chinese Academy of Sciences, Beijing, China.
Email: Lgao@mail.kib.ac.cn
Copyright © 2013 Xinchun Mo et al. This is an open access article distributed under the Creative Commons Attribution License, which permits unrestricted use, distribution, and reproduction in any medium, provided the original work is properly cited.
Received May 14th, 2013; revised June 14th, 2013; accepted June 29th, 2013
Keywords: Brachypodium sylvaticum var. breviglume; Microsatellites; Characterization; Genetic Diversity
ABSTRACT
Southwestern China is abundant in a large species diversity of grasses and Brachypodium sylvaticum var. breviglume is unquestionably appropriate to serve as an ideal model to investigate the adaptation, evolution and diversification of grasses in this region. In this study, a total of 37 microsatellite markers were screened and genetic variation was estimated for 100 individuals from the five natural populations of the species. Our results showed that seven of them were polymorphic for the five studied populations, while the other thirty were monomorphic. These seven SSR loci exhibited a high level of genetic diversity among populations, i.e. allele number varied from 5 to 24, with an average of 13.29; expected heterozygosity (He) ranged from 0.439 to 0.561, with an average of 0.488; percentage of polymorphic loci (PPL) ranged from 85.71% to 100%, with an average of 97. 14%. The FCA and UPGMA analyses revealed that the five populations were divided into three clusters. Our results indicate that these newly characterized SSR markers are useful for the exploration of genetic diversity and evolutionary history of the B. sylvaticum var. breviglume populations in Yunnan, China.
1. Introduction
Grasses (Poaceae), the fourth widely distributed family, provide the bulk of human nutrition through directly or indirectly approaches. They are thus regarded as an essential factor in addressing the strategic goal of food security. So far, grasses are also proposed to become major sources of renewable energy under the global energy crisis [1]. As their central importance to the global economy is concerned, more research needs to be focused on understanding the biology of grasses.
With rapid development of molecular biology and genomics, DNA markers are widely employed to study genetic origins, invasion, intraspecific hybridization and dispersal modes of grasses [2,3]. These molecular tools which have been continuously used in population genetic studies of grass species include isozymes [4], RFLPs [5], RAPDs [6], ISSRs and AFLPs [7]. The microsatellite markers, also called simple sequence repeats (SSRs), have been proven to be suited for a wide-range of genetic characterization [8]. They possess many of the characteristics required for population genetic studies including multi-allelic, co-dominant, high polymorphism and abundance [9]. The uses of microsatellites of Brachypodium sylvaticum (Huds.) Beauv. in Northern America, for example, have shown their power to discriminate dispersal modes and bio-control of the recently identified invasive species in Oregon and California, USA [2,3].
Southwestern China is abundant in a large species diversity of grasses and possesses approximately 888 grasses, accounting for over 65% of number of total grass species of China. The origins of grass diversity, their speciation and subsequent dispersal in this area have long attracted evolutionary biologists and plant taxonomists but remain largely unsolved to date. B. sylvaticum var. breviglume, a perennial self-compatible diploid bunchgrass, is widely distributed in Southwestern China [10,11]. The species exhibits divergently ecological adaptation, frequently intraspecific hybridization and high levels of phenotypic variation. It is unquestionably appropriate to serve as an ideal model of evolutionary studies due to fitness-related traits which are easy to investigate, e.g., nonrhizomatous growth habit, rapid life time, compact genome and greenhouse suitability [2,3, 12]. In addition, the plant has long been used as forage by local people in Southwestern China for its high protein component of about 8.1% - 11.8% during the flowering stage [10]. A recent pioneer study has investigated population genetic structure of 25 populations from throughout the native range in Europe, North Africa and the Middle East by comparing with 23 invasive US populations [3]. However, little has been known about levels and patterns of genetic diversity and population structure of B. sylvaticum var. breviglume in Asia. In this study, we aim to identify and characterize new microsatellite markers for the characterization of genetic diversity and population structure of B. sylvaticum var. breviglume to obtain a better knowledge of adaptation, evolution and diversification of the species in Southwestern China.
2. Material and Methods
2.1. Plant Material
A total of 100 individuals were taken from the five representative populations of B. sylvaticum var. breviglume in Northwestern Yunnan, China (Table 1). Young and fresh leaves were collected from each individual in June-October, 2010 and 2011. Individual plants were sampled at least 5-m apart to prevent collecting duplicate samples from the same genet. The sampled leaves were dried and stored in silica gel until DNA extraction.
2.2. Methods
2.2.1. DNA Extraction
Genomic DNAs were extracted from the dried leaf tissues of different individuals by using a modified CetylTrimethyl Ammonium Bromide (CTAB) method [13]. 100 mg of dried leaves were ground manually within liquid nitrogen. The mixture was incubated at 65˚C for 1 h and shaken gently for several times during the incubation, followed by chloroform cleaning-up. The DNA pellet was washed by the ethanol (76%), air dried and then suspended in 100 μL of TE buffer [10 mM Tris-HCl, pH 8.0, and 1 mM EDTA, pH 8.0]. The DNA was quantified by gel electrophoresis and stored at −20˚C until use.
2.2.2. Primer Screening and PCR Experiments
Of the thirty-seven microsatellite markers, twelve were firstly developed in B. distachyon and used in B. sylvaticum (Huds.) Beauv. [2,3,14], while the others were retrieved from the database of B. distachyon genome [15] (Table 2). PCR reactions were carried out in 10-μL with 2 × Taq MasterMix (Transgen; 0.1 U Taq Polymerase/μL, 0.5 mM dNTP each, 20 mM Tris-HCl (pH 8.3), 100 mM KCl, 3 mM MgCl2) and 0.5 μL of each primer and 0.5 μL genomic DNA. Amplifications were performed in an MJ Research P-100 thermal cycler. After an initial denaturing step of 95˚C for 5 min, the PCR procedure was: 95˚C for 50 s, 55˚C for 10 s, 72˚C for 1min, cycled 30 - 35 times, with a final extension of 72˚C for 5 min. Primers were initially screened for 24 individuals of B. sylvaticum var. breviglume, and the obtained fragments were visualized on 2% agarose. The microsatellites which
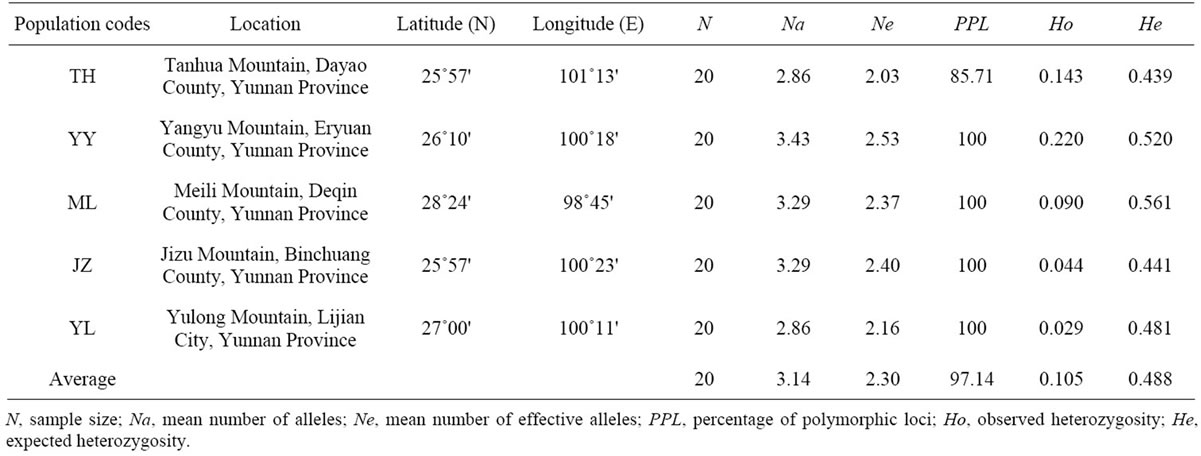
Table 1. Ecological and geographical parameters and levels of genetic variation of the five studied populations of B. sylvaticum var. breviglume across the seven SSR loci.


Table 2. Primer sequences and genetic characteristics of 37 microsatellite loci successfully amplified in B. sylvaticum var. breviglume.
were successfully amplified and generated clear fragments were further used to detect polymorphisms for all the 100 individuals from the five natural populations. They were screened on 8% denaturing polyacrylamide gels and visualized by silver staining with a 100 bp extended DNA ladder as a size standard.
2.2.3. Data Analysis
Genetic diversity of SSR loci including percentage of polymorphic loci (PPL), observed heterozygosity (HO), and expected heterozygosity (He) were calculated by using GenAlEx 6.5 [16]. GENEPOP 4.1 [17] was performed to test for deviations from Hardy-Weinberg equilibrium, estimate the Wright’s Fst and calculate the Wright’s fixation index (Fis). The genetic relationships among populations were also inferred using the proportions of alleles according to the similarity estimation [18]. A dendrogram was drawn by the unbiased Nei’s genetic distance [19] based on the unweighted pair group method with arithmetic averages (UPGMA) using the TFPGA program [20]. Genetix 4.03 software was applied to perform a factorial correspondence analysis (FCA) [21].
3. Results and Discussion
3.1. Levels of Genetic Variation
A total of thirty-seven microsatellite loci were successfully amplified in B. sylvaticum var. breviglume. Twentyfive of them were deposited at GenBank (Accession Number from JQ307441 to JQ307465) (Table 2). Our results showed that seven of them were polymorphic within the five studied populations, while the other thirty were monomorphic. Polymorphic screening found that the number of alleles ranged from 5 to 24 in the five natural populations when using seven polymorphic microsatellite loci (Table 2).
The mean number of alleles per locus (Na) varied from 2.86 to 3.43, with an average of 3.14, while the effective number of alleles per locus (Ne) varied from 2.03 to 2.53 with an average of 2.30. The observed heterozygosities (Ho) ranged from 0.029 to 0.220, with an average of 0.105. The expected heterozygosity (He) varied from 0.439 to 0.561 with an average of 0.488, while the percentage of polymorphic loci ranged from 85.71% to 100%, with an average of 97.14% (Table 1). Among the five studied populations, YY harbored the largest levels of genetic diversity, while TH possessed the lowest genetic variation.
In this study, high level of polymorphisms was detected by the seven SSR loci with the total number of 94 alleles. Levels of allelic diversity (Na = 3.14; Ne = 2.30), observed and expected heterozygosity within populations (mean Ho = 0.105; He = 0.488) were detected to be higher than those within 23 invasive populations (Rs = 1.403; mean Ho = 0.081; Hs = 0.212) but almost equal to 25 native populations (Rs = 1.871; mean Ho = 0.225; He = 0.406) [3].
3.2. Population Genetic Structure
Overall, estimates of the expected heterozygosity were found to range from 0.206 (3-2E3) to 0.728 (2-3A1) with an average of 0.488, which were higher than values of observed heterozygosity varied from 0.056 (2-6E6) to 0.217 (2-6E8) with an average of 0.105 (Table 3). Fis values ranged from 0.628 to 0.885 with an average value of 0.784. Our results indicate that all microsatellite loci have deviated from Hardy-Weinberg expectations and show a deficiency of heterozygotes in the studied populations of the species. The tendency toward heterozygote deficiency suggests the presence of inbreeding within the populations of B. sylvaticum var. breviglume.

Table 3. Measurements of genetic diversity, genetic differentiation and gene flow among populations of B. sylvaticum var. breviglume across the seven microsatellite loci.
The coefficient of hierarchical Fst was observed to range from 0.136 (2-3A1) to 0.671 (3-2E3) with an average value of 0.331. The results suggest that there is a moderate genetic differentiation among the studied populations. Gene flow is regarded as an important cohesive force to hold the geographically separated populations together into a single evolutionary unit, which might result in the reduced genetic differences between populations [22]. In this study, the extent of gene flow (Nm) ranged from 0.123 (3-2E3) to 1.586 (2-3A1) and overall Nm was estimated to equal 0.665. The results indicate the restricted gene flow among the studied populations of B. sylvaticum var. breviglume.
The UPGMA dendrogram based on the Nei’s unbiased genetic distances revealed the existence of genetic differentiation among populations (Figure 1). Cluster A included three populations (TH, ML and JZ), the clusters B and C comprised YL and YY, respectively. The result was further supported by three-dimensional factorial correspondence analysis (FCA), indicating a similar genetic relationships of the studied populations. The threeaxis variances of 32.21%, 29.13% and 24.15%, respectively, showed the distinction of three clusters (Figure 2).
The genetic differentiation among the studied populations (Fst = 0.488) was higher than the value detected in native populations of B. sylvaticum from Europe, North Africa and the Middle East (Fst = 0.441) but lower than that among invasive populations from Oregon and California, USA (Fst = 0.493). The Fis value (Fis = 0.784) detected in natural populations of B. sylvaticum var. breviglume in this study was higher than the previously reported native (Fis = 0.447) and invasive populations (Fis = 0.616) of B. sylvaticum [3]. The result suggests that the studied populations of B. sylvaticum var. breviglume from China exhibits high extent of inbreeding.
4. Conclusion
This study has successfully screened thirty-seven microsatellite markers in B. sylvaticum var. breviglume. The highly discriminatory power of seven polymorphic microsatellite loci suggests that they may be suitable for both the large-scale and fine-scale analyses of population structure of the species. These newly characterized SSR

Figure 1. Genetic relationships among populations of B. sylvaticum var. breviglume. The UPGMA dendrogram was constructed based on the Nei’s unbiased genetic distances.

Figure 2. The factorial correspondence analysis (FCA) of 100 individuals of the five natural populations of B. sylvaticum var. breviglume. The analysis allows reliable distinction of the three clusters of A, B and C.
markers should be useful for the exploration of genetic diversity and evolutionary history of the B. sylvaticum var. breviglume populations in Yunnan, China.
5. Acknowledgements
This work was supported by Hundreds Talents Program of Chinese Academy of Sciences (CAS), Talents Program of Yunnan Province (20080A009), a grant from the Chinese Academy of Science (KSCX2-YW-N-029), and a startup grant of Kunming Institute of Botany, CAS (to L. Z. GAO).
REFERENCES
- P. Vain, “Brachypodium as a Model System for Grass Research,” Journal of Cereal Science, Vol. 54, No. 1, 2011, pp. 1-7. doi:10.1016/j.jcs.2011.04.002
- A. P. Ramakrishnan, T. Musial and M. B. Cruzan, “Shifting Dispersal Modes at an Expanding Species’ Range Margin,” Molecular Ecology, Vol. 19, No. 6, 2010, pp. 1134-1146. doi:10.1111/j.1365-294X.2010.04543.x
- D. M. Rosenthal, A. P. Ramakrishnan and M. B. Cruzan, “Evidence for Multiple Sources of Invasion and Intraspecific Hybridization in Brachypodium sylvaticum (Hudson) Beauv. in North America,” Molecular Ecology , Vol. 17, No. 21, 2008, pp. 4657-4669. doi:10.1111/j.1365-294X.2008.03844.x.
- F. Schläpfer and M. Fischer, “An Isozyme Study of Clone Diversity and Relative Importance of Sexual and Vegetative Recruitment in the Grass Brachypodium pinnatum,” Ecography, Vol. 21, No. 4, 1998, pp. 351-360. doi:10.1111/j.1600-0587.1998.tb00400.x
- P. Catalan, Y. Shi, L. Armstrong, J. Draper and C. A. Stace, “Molecular Phylogeny of the Grass Genus Brachypodium P. Beauv. Based on RFLP and RAPD Analysis,” Botanical Journal of the Linnean Society, Vol. 117, No. 4, 1995, pp. 263-280. doi:10.1111/j.1095-8339.1995.tb02590.x
- A. M. Jaroszewicz, R. Kosina and P. R. Stankiewicz “RAPD, Karyology and Selected Morphological Variation in a Model Grass, Brachypodium distachyon,” Weed Research, Vol. 52, No. 3, 2012, pp. 204-216. doi:10.1111/j.1365-3180.2012.00916.x
- E. Filiz, B. S. Ozdemir, F. Budak, J. P. Vogel, M. Tuna, and H. Budak, “Molecular, Morphological, and Cytological Analysis of Diverse Brachypodium distachyon Inbred Lines,” Genome, Vol. 52, No. 10, 2009, pp. 876-890. doi:10.1139/g09-062
- P. Martínez-Gómez, R. Sánchez-Pérez, F. Dicenta, W. Howad, P. Arus and T. M. Gradziel, “Almonds,” In: C. R. Kole, Ed., Genome Mapping and Molecular Breeding, Fruits & Nuts, Springer, Heidelberg, Berlin, New York, Tokyo, Vol. 4, 2007, pp. 229-242.
- P. K. Gupta, H. S. Balyan, P. C. Sharma and B. Ramesh, “Microsatellites in Plants: A New Class of Molecular Markers,” Current Science, Vol. 70, 1996, pp. 45-54.
- Y. Keng, “Brachypodium sylvaticum var. breviglume Keng ex Keng f.,” Acta Botanica Yunnanica, Vol. 4, 1982, pp. 277-278.
- M. A. Kahn and C. A. Stace, “Breeding Relationships in the Genus Brachypodium (Poaceae: Pooideae),” Nordic Journal of Botany, Vol. 19, No. 3, 1999, pp. 257-269. doi:10.1111/j.1756-1051.1999.tb01108.x
- T. N. Kaye and M. Blakeley-Smith, “False-Brome (Brachypodium sylvaticum), ” In: P. D. Boersma, S. E. Reichard and A. N. van Buren, Eds., Invasive Speices in the Pacific Northwest, University of Washington Press, Seattle, 2006, pp. 80-81
- J. J. Doyle and J. L. Doyle, “A Rapid DNA Isolation Procedure from Small Quantities of Fresh Leaf Tissues,” Phytochemical Bulletin, Vol. 19, 1987, pp. 11-15
- A. P. Ramakrishnan, D. M. Rosenthal, T. Musial and M. B. Cruzan, “Isolation and Characterization of Nine Microsatellite Markers for Brachypodium sylvaticum (Huds.) Beauv., a Recently Invasive Grass Species in Oregon,” Molecular Ecology Resources, Vol. 8, No. 6, 2008, pp. 1297-1299. doi:10.1111/j.1755-0998.2008.02174.x
- D. F. Garvin, N. McKenzie, J. P. Vogel, T. C. Mockler, Z. J. Blankenheim, J. Wright, J. J. Cheema, J. Dicks, N. Huo, D. M. Hayden, Y. Gu, C. Tobias, J. H. Chang, A. Chu, M. Trick, T. P. Michael, M. W. Bevan and J. W. Snape, “An SSR-Based Genetic Linkage Map of the Model Grass Brachypodium distachyon,” Genome, Vol. 53, No. 1, 2010, pp. 1-13. doi:10.1139/g09-079
- R. Peakall and P. E. Smouse, “GenAlEx 6.5: Genetic Analysis in Excel. Population Genetic Software for Teaching and Research—An Update,” Bioinformatics, Vol. 28, No. 19, 2012, pp. 2537-2539. doi:10.1093/bioinformatics/bts460
- F. Rousset, “Genepop’007: A Complete Re-Implementation of the Genepop Software for Windows and Linux,” Molecular Ecology Resources, Vol. 8, No. 1, 2008, pp. 103-106. doi: 10.1111/j.1471-8286.2007.01931.x.
- M. Nei and W. H. Li, “Mathematical Model for Studying Genetic Variation in Terms of Restriction Endonucleases,” Proceedings of the National Academy of Sciences, Vol. 76, 1979, pp. 5269-5273. doi:10.1073/pnas.76.10.5269
- M. Nei, “Estimation of Average Heterozygosity and Genetic Distance from a Small Number of Individuals,” Genetics, Vol. 89, No. 3, 1978, pp. 583-590
- T. Backeljau, L. De Bruyn, H. De Wolfe, K. Jordaens, S. Van Dongen and B. Winnepenninckx, “Multiple UPGMA and Neighbor-Joining Trees and the Performance of Some Computer Packages,” Molecular Biology and Evolution, Vol. 13, No. 2, 1996, pp. 309-313. doi:10.1093/oxfordjournals.molbev.a025590
- K. Belkhir, P. Borsa, L. Chikhi, N. Raufaste and F. Bonhomme, “GENETIX 4.03, Logiciel sous Windows TM pour la Génétique des Populations,” Laboratoire Génome, Populations, Interactions CNRS UMR 5000, Université de Montpellier II, Montpellier, 2004.
- F. W. Allendorf and G. Luikart, “Conservation and the Genetics of Populations,” Mammalia, Vol. 71, No. 4, 2007, pp.189-197. doi:10.1515/MAMM.2007.038.