Pharmacology & Pharmacy
Vol.3 No.1(2012), Article ID:16943,7 pages DOI:10.4236/pp.2012.31013
Lopinavir Plasma Concentrations and Serum Lipids in Therapy Naïve HIV-Patients: A Sub Analysis of the FREE Study
![]()
1Department of Internal Medicine, Radboud University Nijmegen Medical Center, Nijmegen, The Netherlands; 2The Nijmegen Institute for Infection, Inflammation and Immunity (N4i), Nijimegen, The Netherlands; 3Department of Clinical Pharmacy, Radboud University Nijmegen Medical Center, Nijmegen, The Netherlands; 4Department of Internal Medicine, Division of General Internal Medicine and Infectious Diseases, University Medical Center Groningen, Groningen, The Netherlands; 5Department of Internal Medicine, Medisch Spectrum Twente Hospital, Enschede, The Netherlands; 6Department of Internal Medicine, Haga-Hospital, Den Haag, The Netherlands; 7Department of Internal Medicine, Rijnstate Hospital, Arnhem, The Netherlands.
Email: *H.terHofstede@cbg.umn.nl
Received October 19th, 2011; revised November 24th, 2011; accepted December 16th, 2011
Keywords: HIV Infection; Lopinavir Plasma Concentrations; Hypertriglyceridaemia; Hypercholesterolaemia; Dyslipidaemia, Metabolic Toxicity
ABSTRACT
Antiretroviral therapy in HIV patients is known for its negative effect on the cardiovascular system. One of the major adverse events in patients on lopinavir is increasing lipids. Hyperlipidaemia together with chronic inflammation by HIV-infection itself makes these patients prone for cardiovascular diseases.The purpose of this study (a sub study within the FREE-study) was to determine if higher plasma lopinavir (LPV) concentrations lead to increase of serum lipids. Plasma drug concentrations were analysed up to week 24 in a prospective cohort of HIV antiretroviral therapy naive patients who started on a regimen of zidovudine, lamivudine and ritonavir-boosted lopinavir (FREE study). Prospectively we measured plasma lopinavir concentrations from baseline to week 24 in 72 naive HIV-patients starting on lopinavir (59 males and 13 females). A total of 210 samples were analysed, with at least 2 samples in every patient. Mean LPV trough concentration was 4.3 mg/L (± 2.1). The median intra-subject variation in LPV level was 38% (range 4% - 111%). Serum lipids were not correlated to LPV plasma concentrations possibly due to the wide intra-individual variability in LPV trough levels. Monitoring of plasma lopinavir and subsequent dose adjustment of LPV will not be useful to prevent hyperlipidaemia in HIV-patients treated with lopinavir.
1. Introduction
The high incidence of the metabolic syndrome is an increasing clinical problem in human immunodeficiency virus (HIV)-patients on antiretroviral therapy (ART) containing protease inhibitors (PIs). Lopinavir (LPV) is a potent PI, which is recommended in therapy-naive as well as heavily pre-treated HIV-patients (co-formulation with a low dose ritonavir; LPV/RTV).
Hyperlipidaemia is the most described adverse events in patients receiving lopinavir, together with abdominal discomfort and diarrhoea. Grade 3 or higher hypercholesterolaemia and hypertriglyceridaemia have been reported in around 10% of antiretroviral therapy-naive patients and in up to 30% of patients with prevous PI-experience [1-4]. Patients with initially high lipid levels are at higher risk of developing (severe) hyperlipidaemia. The pathogenic mechanism of this dyslipidaemia is multifactorial and includes effects of the virus itself and antiretroviral use [5].
Measurement of antiretroviral plasma concentrations has been proven to be useful for guidance in HIV-therapy, not only for adequate virus control but also for reducing adverse events. A series of trials have demonstrated the relationship between plasma levels of antiretrovirals and the presence of side effects [6-8]. For example, Gatti et al discovered a clear relationship between ritonavir plasma concentrations and side-effects [9]. Our own research demonstrated higher stavudine levels in patients experiencing lipoatrophy [10]. Previous data showed that higher plasma lopinavir concentrations are associated with a higher risk of elevated cholesterol levels [11,12].
The FREE-study (ClinicalTrials.gov NCT00405925) is a prospective multicenter cohort of HIV-patients starting with ART. In this study therapy-naive patients started on zidovudine (ZDV), lamivudine (3TC) and ritonavir (RTV) boosted lopinavir to achieve an undetectable viral load in short term. Patients with an undetectable viral load between week 12 and 24, were randomised to either continuation of the initial therapy or switch to 3 NRTIs (Trizivir® b.i.d.: each tablet contains 300 mg zidovudine, 150 mg lamivudine and 300 mg abacavir) in order to simplify treatment, facilitate drug adherence and prevent potential long term PI-toxicity. Within the FREE study we investigated whether serum lipid elevation was correlated to LPV exposure.
2. Methods
2.1. Study Design
The FREE study is a prospective, multi center cohort in which ART-naive HIV-infected patients were initially treated with zidovudine, lamivudine and ritonavir boosted lopinavir. When patients received undetectable viral load between week 12 till week 24, they were randomised to either continuation of this drug regimen or treatment with zidovudine, lamivudine and abacavir as a fixed-dose combination drug (trizivir®; ZDV/3TC/ABC). In this sub-study we measured lopinavir plasma levels in all patients up to randomisation (maximum week 24).
A total of 146 patients who started antiretroviral therapy between March 2003 and January 2006 were consecutively observed up to week 24. paper size.
2.2. Measurement of Lopinavir Drug Concentrations
Lopinavir plasma concentrations were determined by a high-performance liquid chromatography (HPLC) assay as previously reported. The lower limit of quantification is 0.07 mg/L. Average accuracy ranged from 97% - 106% and precision ranged from 2.4% - 8.1%, with inter-assay coefficient of variation 2.3% - 5.9% [13].
2.3. Study Population
Inclusion criteria in the cohort included: ³18 years of age, HIV-seropositivity, necessity to begin treatment with ART and informed consent. Inclusion criteria were: male or female older than 18 years, able and willing to sign informed consent, CD4 count £ 350/mm3 and HIV-1 RNA ³ 30.000 copies/ml. The following metabolic parameters were required for inclusion: Fasting glucose £ 7 mmol/L (non-fasting < 11 mmol/L), fasting triglycerides £ 2 mmol/L and LDL-cholesterol £ 4 mmol/L or LDL/ HDL ration £ 4.1. Patients with lipids or glucose levels increasing above the inclusion values (triglycerides > 8 mmol/L) could be switched to ZDV/3TC/ABC after week 18 if their viral load had become undetectable (<50 copies/ml). Otherwise (no undetectable viral load at week 24 or lipid increase before randomisation) they were defined as failures and discontinued the original study, however their lipid and LPV data could still be used for our subanalysis.
Patients enrolled in this ongoing trial comparing LPV/ TV with abacavir were selected for this analysis. Every patient started with LPV/RTV in combination with ZDV/ TC. Follow-up visits were carried out by each individual center at fixed timepoints, according to the study scheme. Nine hospitals enrolled patients for this trial. Triglycerides and cholesterol were measured at baseline, week 4, week 8, week 12, week 18 and week 24. Plasma lopinavir levels were measured in all patients if possible up to randomisation (week 4, 8, 12, 18 and 24 dependent on whether the patient was randomised to the LPV/RTV ongoing arm). In order to get a representative impression of the overall LPV exposure patients with at least 2 LPV trough levels were included in this study.
Patients were not allowed to use hypolipidaemic medication. Lopinavir/ritonavir was given in a fixed dose combination of 133/33 mg three capsules twice daily (the former formula Kaletra® capsules). For the evaluation of HIV-infection CD4 cell count and viral load were measured at baseline and at week 12 and 24.
2.4. Statistics
Statistical evaluation was performed with SPSS for windows, version 14.0. Mean and median values with 95% confidence intervals were calculated for all samples in each individual. For the analysis, a p-value of £0.05 was regarded as significant.
2.5. Ethics
The research protocol was approved by the National Medical Ethic Committee and written informed consent was obtained from all subjects.
3. Results
From the beginning of the study in March 2003 to January 2006 146 patients were included, in 132 patients LPV plasma samples were collected, in 93 patients lopinavir trough levels could be calculated and were enrolled for this analysis. Because LPV levels within 4 hours after dosing do not allow a representative calculation of trough concentrations, we did not use these levels for the analysis. All data of patients were collected from baseline till randomisation. Four patients were not enrolled due to incomplete lipid data. Since an elevated plasma concentration can be obtained during one of the visits, whereas the overall drug levels would be adequate, we enrolled only patients with at least two plasma LPV trough levels to get a representative overall impression of the mean individual drug levels. There were 17 patients left out of the study due to <2 LPV samples. Prospectively we measured plasma lopinavir concentrations in 72 naive HIV-patients starting therapy with zidovudine, lamivudine and ritonavir boosted lopinavir (59 males and 13 females) until randomisation (between week 12 - 24). Five patients used LPV until week 12, three patients until week 18 and of 64 patients we had LPV plasma data until week 24.
A total of 210 samples were analysed; 32 patients had 2, 22 patients had 3, 10 had 4 and 8 patients had 5 LPV trough levels. The range of samples per patients varied from 2 to 5 with a mean of 3 samples per individual. The mean age at the start of the study was 44 ± 9 years. The majority of patients were Caucasian (n = 49, 68%), there were 19 Black patients (26%) and 4 Asian (6%). The mean CD4 cell count at initiation of the study was 170 ± 94 cells/mm3. Characteristics of the groups are depicted in Table 1.
During the study period 64 (89%) patients experienced an increase in cholesterol. An increase of triglycerides compared to baseline was seen in 61 (85%) patients. None of these patients were treated with lipid lowering drugs. Grade 2 hypercholesterolaemia (>6.2 mmol/L; WHO toxicity scale) and hypertriglyceridaemia (>4.5 mmol/L) was seen in 10 (14%) and 6 (8%) patients respectively, of whom 4 (6%) had even grade 3 hypercholesterolaemia (>7.8 mmol/L) and only 1 (1.4%) had grade 3 hypertriglyceridaemia (>8.5 mmol/L). LDL cholesterol >4.8 mmol/L is an indication for lipid lowering drugs. Only one patient had a serum LDL cholesterol above this threshold, which was 6.4 mmol/L 24 weeks after start of LPV. This patient had a median LPV trough level of 4.6 mg/L compared to a median trough level of 4.0 mg/L for all patients.
Mean LPV trough concentration was 4.3 mg/L (± 2.1) and median 4.0 mg/L. Mean and median trough levels of LPV > 8 mg/L were seen in 6 and 5 patients respectively. Mean and median trough levels of LPV > 8 mg/L were seen in 6 and 5 patients respectively.
We did not found a correlation between lipids, glucose and LPV concentrations (lipid changes and lopinavir trough levels are depicted in Figures 1 and 2). We found a remarkable wide inter-subject variation concerning the LPV trough levels with a median of 38% (range 4% - 111%). Intra-subject variation was 19% (range 4% - 31%).
Table 1. Baseline characteristics of patients.
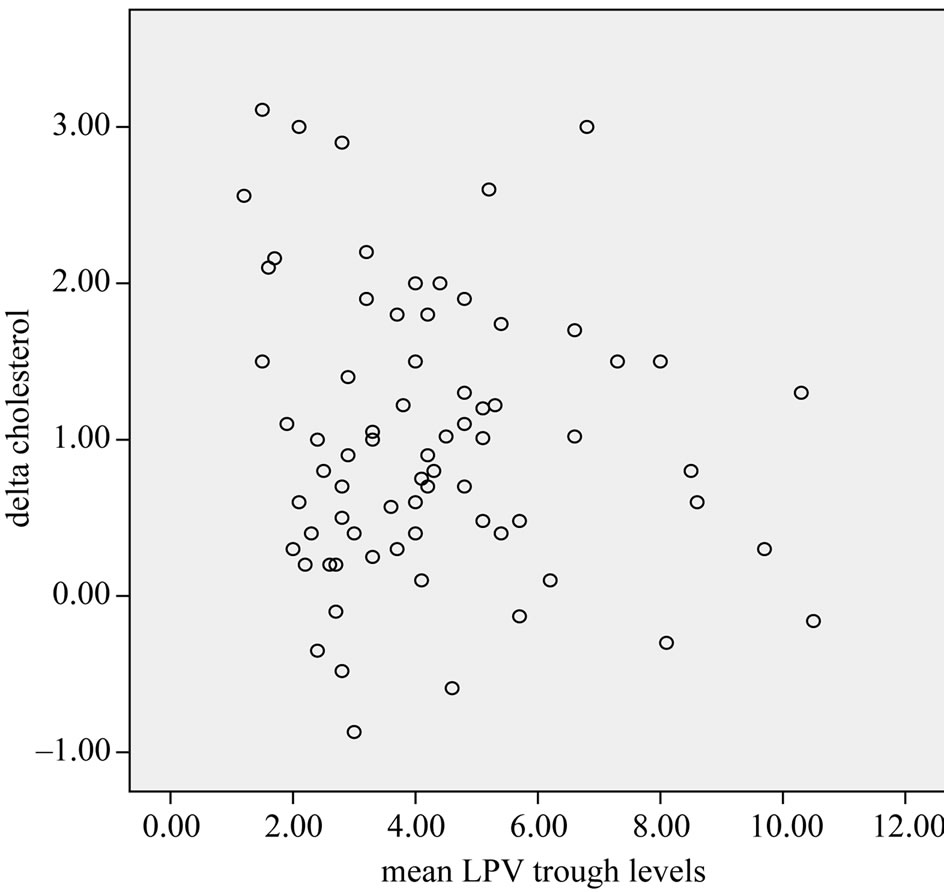
Figure 1. Cholesterol changes and lopinavir through concentrations.
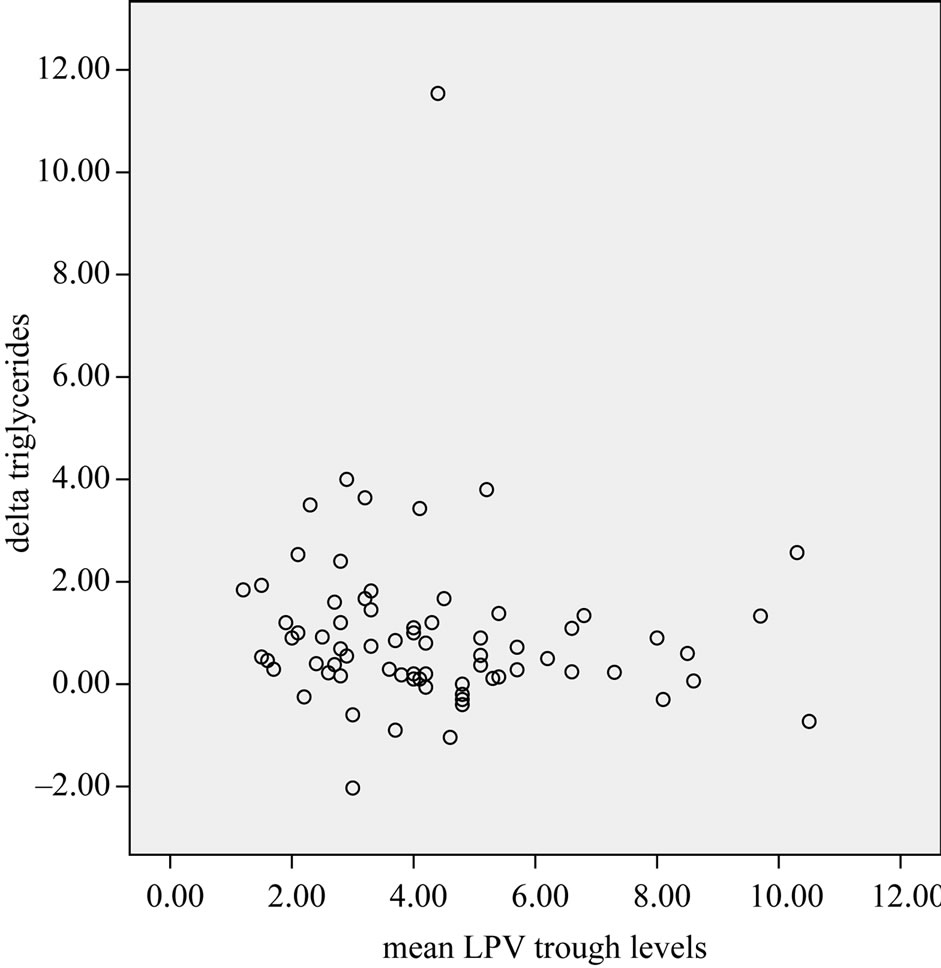
Figure 2. Triglycerides changes and lopinavir through concentrations.
As far as risk factors are concerned, slightly higher lopinavir through levels were observed in females compared to males however without statistical significant difference (4.8 and 3.4 mg/L in females and males respectively). In addition, no relation between LPV levels and race, age, BMI, CD4 cell count, HIV-RNA and CDC classification could be detected.
4. Discussions
Our data confirm the results of previous studies that revealed dyslipidaemia in patients on LPV. However, we could not demonstrate a correlation between lopinavir plasma through levels and dyslipidaemia. In addition, no other factors influencing lipid levels were defined.
There is a wide interand intra-patient variability when measuring drug exposure to a standard dose. In our study the inter-subject variation in LPV trough levels ranged from 4 to 111% with a median of 38% (intrasubject variation was less). This phenomenon might explain why no relation between LPV levels and serum lipids were detected. High variability in LPV concentrations has been found in several studies ranging from 15% - 54%; median of 35% [14,15]. This phenomenon might explane why no correlation between LPV trough levels and serum lipids could be detected. An alternative explanation might be that lipid alterations in LPV use is an intrinsic adverse event of LPV, independent of LPV concentrations.
There is a number of studies looking at different aspects of PI drug levels and the influence on serum lipids. Results from these studies show conflicting data about relations between drug concentrations and lipids. González De Requena et al. investigated lipids in HIV patients on salvage therapy with LPV/RTV from baseline to month 3. They found a positive correlation between the percentage increase in triglycerides and LPV trough levels, but no correlation was found between LPV trough levels and the percentage of increase in cholesterol levels. 12 In a small population all patients with higher LPV trough (especially trough levels > 8 mg/mL) levels were the ones at risk of dyslipidaemia [16,17]. Moreover, in a population of 142 ART-experienced patients high triglycerides were found in subjects with high LPV residual concentrations [11]. This contrasts with the PharmaAdapt study, where no relationship was demonstrated between PI drug concentrations and lipids between week 0 and 32 in 252 patients [18]. At week 24 increase of triglycerides and total cholesterol could not be correlated with LPV plasma levels by Leon et al. in a population of 26 patients [19]. Additionally, in a study by Torti et al no correlation between lipid abnormalities and LPV plasma concentrations was seen [20]. These were all trials in heavily pretreated HIV patients.
Of the PI-group lopinavir has been the most frequently associated with hyperlipidaemia. A retrospective study comparing patients on an indinavir/ritonavir (IDV/RTV) with a LPV/RTV containing regimen, noted higher serum cholesterol levels in the IDV/RTV group at 3 and 12 months [21]. Whereas, Antoniou et al. could not detect a significant difference in lipid alterations between ritonavir boosted indinavir and ritonavir in a small cohort of HIV patients [22]. However, these trials did not investigate plasma drug levels.
Elevated lipid values at baseline and high dietary fat intake are risk factors for hypertriglyceridaemia and hypercholesterolaemia [23]. These confounding factors cannot have played a role in our study because of strict criteria for inclusion and the measurement of fasting serum lipids. Other advantages of this study are the prospective design, the homogeneous study population, the sample size and no confounding by the use of statines or fibrates (lipid lowering drugs were only allowed after randomistation which is outside the scope of this study).
However, some limitations of our study should be noted. First, no RTV levels were measured thus the influence of this low dose booster PI cannot be ruled out. Secondly, we did not collect 5 LPV samples from each patient (from start of study up to randomization). This study only analysed data till week 24. We might have missed the occurrence of hyperlipidaemia as a result of longer duration of treatment, independent of lopinavir plasma concentrations. However, the increase of serum lipids was already within 24 weeks of LPV use in our ART naive patients. Other studies also describe lipid elevations even after short term use of LPV [19,24]. Data of lipid changes and LPV plasma levels after week 24 are needed for a better understanding of the effect of LPV levels on lipids. The total analysis of the FREE study might give more insight in this issue. A retrospective analysis of HIV-infected patients on LPV/RTV revealed an increase of total cholesterol and triglycerides early after introduction of LPV, which remained subsequently stable for a period of 15 months [3]. Finally, the overall incidence of grade 3 or more hyperlipidaemia might be underestimated due to the strict criteria for inclusion and continuation of the study. The percentage of patients presenting grade 2 or more hyperlipidaemia was lower during the study period compared to other studies. However, the populations described in literature were heterogeneous and even started with increased serum lipids due to previous therapy or stage of HIV disease.
Favourable changes in lipids and lipoproteins have been found in HIV-infected patients treated with a regimen of stavudine, didanosine and nevirapine [25]. An overall increase of HDL-cholesterol was seen in these patients compared to those treated with stavudine and didanosine combined with either lamivudine or indinavir. It is remarkable that some studies showed that NRTIs might have an additional effect on the development of lipid increase while others did not [26].
It is important to keep in mind that maybe LPV trough levels are not the best tool to investigate adverse events such as hyperlipidaemia. In order to gain further insight into the relevance of LPV plasma concentrations and lipid increase, additional studies have to be executed using peak levels. It might be possible that peak concentrations are the best representative to detect a correlation.
As a consequence of lower volume of distribution female patients tend to be more prone for side-effects, which has been observed in some clinical trials [27]. Slightly higher lopinavir levels were observed in females compared to males (not statistically significant). Our study was not intended to look at risk factors or to define predictive factors of hyperlipidaemia. It was intended to investigate the influence of LPV plasma levels.
Ritonavir boosted lopinavir is frequently associated with a significant increase in triglyceride and/or cholesterol levels soon after starting therapy. It is hypothesised that this dyslipidaemia is multifactorial and includes a direct effect of the PI and a more complex mechanism involveing immunologic, genetic and pharmacodynamic factors and HIV-infection itself [5,12,16,17,24]. To our knowledge this is the first prospective study analysing LPV levels with serum lipids in a cohort of only antiretroviral therapy-naive patients. Based on our data we can not recommend frequent measurements of serum (trough) levels in lopinavir use in order to prevent dyslipidaemia.
5. Acknowledgements
We kindly acknowledge all the trial nurses at the individual centres for their help with collection of the data. Furthermore, we kindly acknowledge Anita Huisman for the collection of the serum LPV samples. Finally we kindly acknowledge Glaxo-Smith-Kline for funding of the original trial.
REFERENCES
- E. Martinez, P. Domingo, M. J. Galindo, A. Milinkovic, J.A. Arroyo, F. Baldovi, M. Larrousse, A.Leon, E. de Lazzari and J. M. Gatell, “Risk of Metabolic Abnormalities in Patients Infected with HIV Receiving Antiretroviral Therapy That Contains Lopinavir-Ritonavir,” Clinical Infectious Diseases, Vol. 38, No. 7, 2004, pp. 1017-1023. doi:10.1086/382531
- L. Calza, R. Manfredi, B. Farneti and F. Chiodo, “Incidence of Hyperlipidaemia in a Cohort of 212 HIV-Infected Patients Receiving a Protease Inhibitor-Based Antiretroviral Therapy,” International Journal of Antimicrobial Agents, Vol. 22, No. 1, 2003, pp. 54-59. doi:10.1016/S0924-8579(03)00100-6
- A. Lafeuillade, G. Hittinger, G. Philip, V. Lambry, P. Jolly and C. Poggi, “Metabolic Evaluation of HIV-Infected Patients Receiving a Regimen Containing Lopinavir/Ritonavir (Kaletra),” HIV Clinical Trials, Vol. 5, No. 6, 2004, pp. 392-398. doi:10.1310/Q0TG-0V50-9JML-638U
- M. L. Montes, F. Pulido, C. Barros, E. Condes, R. Rubio, C. Cepeda, F. Dronda, A. Antela,, J. Sanz, E. Navas, P. Miralles, J. Berenguer, S. Perez, A. Zapata, J. J. Gonzalez-Garcia, J. M. Pena, J. J. Vazquez and J. R. Arribas, “Lipid Disorders in Antiretroviral-Naive Patients Treated with Lopinavir/Ritonavir-Based HAART: Frequency, Characterization and Risk Factors,” Journal of Antimicrobial Chemotherapy, Vol. 55, No. 5, 2005, pp. 800- 804. doi:10.1093/jac/dki063
- J. Oh and R. A. Hegele, “HIV-Associated Dyslipidaemia: Pathogenesis and Treatment,” Lancet Infectious Diseases, Vol. 7, No. 12, 2007, pp. 787-796. doi:10.1016/S1473-3099(07)70287-6
- J. P. Dieleman, I. C. Gyssens, M. E. van der Ende, S. de Marie and D. M. Burger, “Urological Complaints in Relation to Indinavir Plasma Concentrations in HIV-Infected Patients,” AIDS, Vol. 13, No. 4, 1999, pp. 473-478. doi:10.1097/00002030-199903110-00005
- F. Gutierrez, A. Navarro, S. Padilla, R. Anton, M. Masia, J. Borras and A. Martin-Hidalgo, “Prediction of Neuropsychiatric Adverse Events Associated with Long-Term Efavirenz Therapy, Using Plasma Drug Level Monitoring,” Clinical Infectious Diseases, Vol. 41, No. 11, 2005, pp. 1648-1653. doi:10.1086/497835
- R. Dicenzo, A. Luque, P. Larppanichpoonphol and R. Reichman, “Association of Total Bilirubin with Indinavir and Lopinavir Plasma Concentrations in HIV-Infected Patients Receiving Three Different Double-Boosted Dosing Regimens,” Journal of Antimicrobial Chemotherapy, Vol. 58, No. 2, 2006, pp. 393-400. doi:10.1093/jac/dkl238
- G. Gatti, B. A. Di, R. Casazza, C. De Pascalis, M. Bassetti, M. Cruciani, S. Vella and D. Bassetti, “The Relationship between Ritonavir Plasma Levels and Side-Effects: Implications for Therapeutic Drug Monitoring,” AIDS, Vol. 13, No. 15, 1999, pp. 2083-2089. doi:10.1097/00002030-199910220-00011
- H. J. M. Ter Hofstede, P. P. Koopmans and D. M. Burger, “Stavudine Plasma Concentrations and Lipoatrophy,” Journal of Antimicrobial Chemotherapy, Vol. 61, No. 4, 2008, pp. 933-938. doi:10.1093/jac/dkn041
- L. Valerio, E. Fontas, C. Pradier, T. Lavrut, R. Garraffo, B. Dunais, E. Cua and P. Dellamonica, “Lopinavir/Ritonavir Combination and Total/HDL Cholesterol Ratio,” Journal of Infection, Vol. 50, No. 3, 2005, pp. 229-235. doi:10.1016/j.jinf.2004.01.014
- R. D. de Gonzalez, F. Blanco, T. Garcia-Benayas, I. Jimenez-Nacher, J. Gonzalez-Lahoz and V. Soriano, “Correlation between Lopinavir Plasma Levels and Lipid Abnormalities in Patients Taking Lopinavir/Ritonavir,” AIDS Patient Care STDS, Vol. 17, No. 9, 2003, pp. 443- 445. doi:10.1089/108729103322395465
- J. A. Droste, C. P. Verweij-van Wissen and D. M. Burger, “Simultaneous Determination of the HIV Drugs Indinavir, Amprenavir, Saquinavir, Ritonavir, Lopinavir, Nelfinavir, the Nelfinavir Hydroxymetabolite M8, and Nevirapine in Human Plasma by Reversed-Phase High-Performance Liquid Chromatography,” Therapeutic Drug Monitoring, Vol. 25, No. 3, 2003, pp. 393-399. doi:10.1097/00007691-200306000-00023
- C. Torti, E. Quiros-Roldan, V. Tirelli, M. RegazziBonora, F. Moretti, P. Pierotti, A. Orani, P. Maggi, A. Cargnel, A. Patroni, A. De Luca and G. Carosi, “Lopinavir Plasma Levels in Salvage Regimes by a Population of Highly Active Antiretroviral Therapy-Treated HIV-1- Positive Patients,” AIDS Patient Care STDS, Vol. 18, No. 11, 2004, pp. 629-634. doi:10.1089/apc.2004.18.629
- M. Boffito, D. J. Back, P. G. Hoggard, A. Caci, S. Bonora, S. R. Raiteri, A. Sinicco, H. E. Reynolds, S. Khoo and G. Di Perri, “Intra-Individual Variability in Lopinavir Plasma Trough Concentrations Supports Therapeutic Drug Monitoring,” AIDS, Vol. 17, No. 7, 2003, pp. 1107-1108. doi:10.1097/00002030-200305020-00029
- F. Gutierrez, S. Padilla, A. Navarro, M. Masia, I. Hernandez, J. Ramos, A. Esteban and A. Martin-Hidalgo, “Lopinavir Plasma Concentrations and Changes in Lipid Levels during Salvage Therapy with Lopinavir/Ritonavir-Containing Regimens,” Journal of Acquired Immune Deficiency Syndromes, Vol. 33, No. 5, 2003, pp. 594-600. doi:10.1097/00126334-200308150-00007
- F. Gutierrez, S. Padilla, A. Navarro, M. Masia and I. Hernandez, “Lipid Abnormalities in HIV-Infected Patients and Lopinavir Plasma Concentrations,” Journal of Acquired Immune Deficiency Syndromes, Vol. 36, No. 5, 2004, pp. 1107-1109. doi:10.1097/00126334-200408150-00017
- P. Clevenbergh, R. Garraffo and P. Dellamonica, “Impact of Various Antiretroviral Drugs and Their Plasma Concentrations on Plasma Lipids in Heavily Pretreated HIVInfected Patients,” HIV Clinical Trials, Vol. 4, No. 5, 2003, pp. 330-336. doi:10.1310/8TXF-P814-8JPF-7TRY
- A. Leon, E. Martinez, M. Sarasa, Y. Lopez, J. Mallolas, E. De Lazzari, M. Laguno, A. Milincovic, J. L. Blanco, M. Larrousse, M. Lonca and J. M. Gatell, “Impact of SteadyState Lopinavir Plasma Levels on Plasma Lipids and Body Composition after 24 Weeks of Lopinavir/Ritonavir-Containing Therapy Free of Thymidine Analogues,” Journal of Antimicrobial Chemotherapy, Vol. 60, No. 4, 2007, pp. 824-830. doi:10.1093/jac/dkm285
- C. Torti, E. Quiros-Roldan, M. Regazzi-Bonora, A. De Luca, S. Lo, Caputo, S. Di Giambenedetto, A. Patroni, P. Villani, V. Micheli and G. Carosi, “Lipid Abnormalities in HIV-Infected Patients Are Not Correlated with Lopinavir Plasma Concentrations,” Journal of Acquired Immune Deficiency Syndromes, Vol. 35, No. 3, 2004, pp. 324-326. doi:10.1097/00126334-200403010-00017
- M. Bongiovanni, T. Bini, E. Chiesa, P. Cicconi, F. Adorni and A. Monforte d’Arminio, “Lopinavir/Ritonavir vs. Indinavir/Ritonavir in Antiretroviral Naive HIV-Infected Patients: Immunovirological Outcome and Side Effects,” Antiviral Research, Vol. 61, No. 1, 2004, pp. 53-56. doi:10.1016/j.antiviral.2003.12.002
- T. Antoniou, L. Park-Wyllie and E. Boyle, “A Comparison of Dyslipidemias Associated with Either Lopinavir/ Ritonaviror Indinavir/Ritonavir-Based Antiretroviral Therapy,” Journal of Acquired Immune Deficiency Syndromes, Vol. 37, No. 5, 2004, pp. 1666-1667. doi:10.1097/00126334-200412150-00023
- M. Bongiovanni, T. Bini, P. Cicconi, S. Landonio, P. Meraviglia, L. Testa, A. Di Biagio, E. Chiesa, F. Tordato, P. Biasi, F. Adorni and A. D. Monforte, “Predictive Factors of Hyperlipidemia in HIV-Infected Subjects Receiving Lopinavir/Ritonavir,” AIDS Research and Human Retroviruses, Vol. 22, No. 2, 2006, pp. 132-138. doi:10.1089/aid.2006.22.132
- M. Schambelan, C. A. Benson, A. Carr, J. S. Currier, M. P. Dube, J. G. Gerber, S. K. Grinspoon, C. Grunfeld, D. P. Kotler, K. Mulligan, W. G. Powderly and M. S. Saag, “Management of Metabolic Complications Associated with Antiretroviral Therapy for HIV-1 Infection: Recommendations of an International AIDS Society-USA Panel,” Journal of Acquired Immune Deficiency Syndromes, Vol. 31, No. 3, 2002, pp. 257-275. doi:10.1097/00126334-200211010-00001
- M. van de Valk, J. J. Kastelein, R. L. Murphy, F. van Leth, C. Katlama, A. Horban, M. Glesby, G. Behrens, B. Clotet, R. K. Stellato, H. O. Molhuizen and P. Reiss, “Nevirapine-Containing Antiretroviral Therapy in HIV-1 Infected Patients Results in an Anti-Atherogenic Lipid Profile,” AIDS, Vol. 15, No. 18, 2001, pp. 2407-2414. doi:10.1097/00002030-200112070-00008
- K. Anastos, D. Lu and Q. Shi, “Association of Serum Lipid Levels with HIV Serostatus, Specific Antiretroviral Agents, and Treatment Regimens,” Journal of Acquired Immune Deficiency Syndromes, Vol. 45, No. 1, 2007, pp. 34-42. doi:10.1097/QAI.0b013e318042d5fe
- M. Gandhi, F. Aweeka, R. M. Greenblatt and T. F. Blaschke, “Sex Differences in Pharmacokinetics and Pharmacodynamics,” Annual Review of Pharmacology and Toxicology, Vol. 44, 2004, pp. 499-523. doi:10.1146/annurev.pharmtox.44.101802.121453
NOTES
*Corresponding author.