Open Journal of Social Sciences
Vol.07 No.01(2019), Article ID:89987,13 pages
10.4236/jss.2019.71013
Integration of Socio-Spatial Approach in Land Use Planning for Agribusiness Commodities: A Case Study of Underdeveloped Districts in South Sulawesi, Indonesia
Isnam Junais1*, Samsuar Samsuar2, Daniel Useng2, Hikmah M. Ali2, Asriyanti Syarif1
1Agribusiness Study Program, Faculty of Agriculture, Muhammadiyah University of Makassar, Makassar, Indonesia
2Center for Research and Development of Natural Resources, Hasanuddin University, Makassar, Indonesia

Copyright © 2019 by author(s) and Scientific Research Publishing Inc.
This work is licensed under the Creative Commons Attribution International License (CC BY 4.0).
http://creativecommons.org/licenses/by/4.0/


Received: November 15, 2018; Accepted: January 15, 2019; Published: January 18, 2019
ABSTRACT
One of the advances in the current socio-economic science is to integrate the socio-spatial approach in various socio-economic studies. The socio-spatial approach method is one of the tools that play an important role in visualizing various social data into the dimensions of space and time. In this article, the author presents a model built on a socio-spatial approach in the effort to develop the potential of underdeveloped regions in Indonesia. This model provides input information on the suitability of land use in the development of agricultural commodities which is identified as an important factor to be used as a basic reference for regional development planning in disadvantaged areas. Furthermore, it’s relying on not only land suitability biophysical data but also the integration of social data into spatial models as part of limiting factors can provide more accurate results. The results suggest that biophysically appropriate commodities are not necessarily acceptable from the social aspects of society, as in the research that has been carried out, there are 12 types of commodities cultivated by farmers and 10 suitable types of commodities biophysically but only 6 commodities based on social aspects that are feasible to become development direction commodities agribusiness which consists of the main commodities namely coffee, chili, potatoes and onions and supporting commodities namely celery and leeks.
Keywords:
Socio-Spatial, Land Use Planning, Agricultural Information, Agribusiness Commodities

1. Introduction
Indonesia is a developing country with agriculture as the main income sector that supports most of its people. The agricultural sector as a driver of regional economic strength is still faced with a variety of complex problems. In the period of 2015-2019, there were 122 districts with status lagging behind a total of 508 regency areas spread mostly in eastern Indonesia. Underdeveloped areas are regions and their communities are less developed and many of them are still living below the poverty line. Determination of the status of underdeveloped regions is based on community economic benchmarks, human resources, facilities and infrastructures, regional financial capacities, accessibilities and regional characteristics [1] .
The inability of the region to manage resource potential in the agricultural sector has an impact on the regional economic decline. This is what happens in disadvantaged areas in Indonesia. One of the main factors that lead to the inability of regions to manage potential resources in agriculture is the inconsistency in development planning in the agricultural sector. In addition, the lack of clarity on the direction of agricultural development is because it is not supported by accurate data related to the potential of the area used in regional planning so that it will have an impact on changing policies towards agricultural development from time to time. The challenge for Indonesian policy makers in the future will be to build on the agricultural successes of the past two decades in order to create a more diversified economy and ensure sustained economic development [2] .
Agricultural development in Indonesia so far has only involved the study of the theory of relations among various interrelated variables, economic, social, cultural, policy, infrastructure and networks. But it has not fully involved space and time, so that agricultural development planning in practice experiences imbalances. Management of natural resources and human resources needs to take into account the spatial perspective, so that in a comprehensive series it can be made binder among objects in different dimensions. The pattern of socio spatial integration in agricultural development is very much needed in parsing various kinds of complexity of problems and gaps that occur. The socio-spatial approach is considered capable of working complex and in synergy with different approaches.
Each region must have superior potential that can be optimized to support regional economic development. Development of regional superior potential carried out in an integrated and sustainable manner in accordance with regional development planning which is expected to increase regional economic productivity. The ability to spur the growth of a region or region depends on the superiority or competitiveness of economic sectors in the region [3] .
The case study in this research will examine one of the disadvantaged areas, namely Jeneponto district, which is one of the few lagging districts in eastern Indonesia. Geographically, this area consists of a large part of the coastal area, so Kab. Jeneponto is known as the main salt producer in South Sulawesi. However, the income of the area in this sector is not sufficient to sustain regional income in the implementation of regional development so it needs to maximize the natural resource potential important to the economy, social, culture and environment directed at answering the opportunities and challenges faced by a region. The Ujung Bulu mountain region in Rumbia District is one of the areas that have good potential to be developed. Geographically, this region is a producer of horticulture and plantation crops.
This study is aimed at investigating the land use planning for leading agribusiness commodities has the prospect of being developed with a biophysical and socio-spatial approach by integrating land and social biophysical suitability and observing the spatial autocorrelation of influence factors in the study area.
2. Material and Methods
2.1. Study Area
The research location is in Jeneponto Regency, which is the district that still holds the status of being the only disadvantaged area in South Sulawesi Province. Underdeveloped areas are areas where people are less developed and many of them are still living below the poverty line. The sampling location is chosen in areas that have superior potential in mountainous areas (Figure 1; Table 1). The field survey was conducted in January to August 2018. Analysis of soil samples was carried out in the soil chemistry laboratory of the faculty of agriculture and soil chemistry laboratory of the Hasanuddin University natural resource research center.
2.2. Data Analysis and Land Evaluation
2.2.1. Evaluation of Biophysical Suitability of Land
Land suitability analysis is carried out on available land for the development of superior commodities which are declared feasible to be developed and cultivated. The method used is FAO Land Suitability Evaluation [4] . The Potential Land becomes a superior commodity area based on spatial and biophysical suitability is land that has a suitable class (S1, S2 and S3) for superior commodities

Figure 1. Location of study area.

Table 1. Land use area study.
among existing commodities. Unsuitable class (N) does not include the potential area in this study [4] .
In the class category, S and N are divided into S1 classes (very suitable), S2 (suitable) and S3 (marginal suitability) and N (unsuitable). Following is the description of each class [4] :
・ S1 Class: Very Suitable: Land does not have a meaningful or real limiting factor for sustainable use, or a limiting factor that is minor and will not significantly affect land productivity.
・ S2 Class: Suitable: Land has a limiting factor, and this limiting factor will affect its productivity, requiring additional input. These barriers can usually be overcome by their own farmers.
・ S3 Class: Marginal Suitability: Land has a heavy limiting factor, and this limiting factor will greatly affect its productivity, requiring more additional input than land classified as S2. To overcome the limiting factor on S3, it requires high capital, so there needs to be assistance or intervention by the government or the private sector.
・ N Class: Unsuitable: Land with very heavy boundaries so that it cannot be permanently pursued for certain types of use in any way for the success of sustainable land use.
The physical parameters used include soil depth, drainage, slope, erosion hazard level, flood hazard, surface rock. The chemical parameters used are soil ph, soil cation-exchange capacity, base saturation, organic C and salinity. The land suitability criteria used in this study are the criteria of the Center for Agricultural Land Research and Development of the Ministry of Agriculture [5] .
2.2.2. Evaluation of Social Preferences for Land Use
The factors of the use of planting land for the type of commodity cultivated based on social preferences are very complex and very static to make a measurement model. Especially for the agricultural situation in Indonesia, the use of agricultural land which is plotted on a small scale and so diverse is a complicated situation and becomes a challenge in making a planning model. In this study, we try to benchmark the social preferences of land use based on factors that influence the selection of planting commodities such as the level of land suitability according to farmers, community culture, level of commodity prices, market demand and social influence.
Furthermore, Social data is interpreted into the spatial context will appear more tangible and able to explain information visually. Various kinds of social data are very related to spatial, the spatial context will not be clear so that it can provide false information. When cross-sectional information is displayed in the form of a table, then the spatial context will disappear. Suppose, for example, that the same information about the comparative performance of the national economy, or the percentage of home ownership by the state, is displayed in the form of a map and not as a table. In this form it is easy to compare the level of each state of ownership to its neighbors [6] .
Analysis of the farming community preferences conducted by collecting data from interviews of 151 respondents selected. The instrument was given to measure the distribution of farmers’ preferences towards the selection of the main commodities as farming crops and to find out the distribution of the commodities most cultivated by farmers. The measurement results of farmers’ preference instruments will be interpreted as spatial forms after going through field checks.
2.2.3. Autocorrelation
Characteristics of the spatial autocorrelation according to Kosfeld [7] , namely,
1) If there is any systematic pattern in the spatial distribution of a variable X, it is said to be spatially auto-correlated.
2) If nearby or neighboring areas are more alike, this is positive spatial autocorrelation.
3) Negative autocorrelation describes patterns in which neighboring areas are unlike (e.g. by competition).
4) Random patterns exhibit no spatial autocorrelation.
The measurement of spatial autocorrelation for spatial data can be calculated using the Moran’s Index (Moran Index) method. In this study the method of analysis is only limited to the method of the Moran’s Index (Moran Index). The Moran Index (Moran’s I) is the most widely used method for calculating spatial autocorrelation globally. This method can be used to detect the beginning of spatial randomness. This spatial randomness can indicate the existence of patterns that cluster or form trends towards space [7] .
The Moran’s index has values varying from −1 to 1 even though values lower than −1 and higher than +1 can be obtained, with a value close to zero meaning that there is no autocorrelation. Positive autocorrelation means that spatial values that are nearby tend to be the same while negative autocorrelation indicates that neighboring values are more different than expected by chance [8] .
Local Moran’s I detects local spatial autocorrelation [8] and decomposes Moran’s I into contributions for each location, Ii. The sum of all Ii for all observations is proportional to Moran’s I. The local Moran index is given from the following formula:
where is the variance of variable y and is a distance weight between locations h and i. In this study, the inverse distance of the two locations was used. A high negative value of local Moran’s I implies that the sample plot under study is a spatial outlier, while a high positive value shows that the sample plot under study has similar values as its neighbors [9] .
The p-value is not statistically significant. You cannot reject the null hypothesis. It is quite possible that the spatial distribution of feature values is the result of random spatial processes. The observed spatial pattern of feature values could very well be one of many, many possible versions of complete spatial randomness (CSR). The p-value is statistically significant, and the z-score is positive. You may reject the null hypothesis. The spatial distribution of high values and/or low values in the dataset is more spatially clustered than would be expected if underlying spatial processes were random. The p-value is statistically significant, and the z-score is negative. You may reject the null hypothesis. The spatial distribution of high values and low values in the dataset is more spatially dispersed than would be expected if underlying spatial processes were random. A dispersed spatial pattern often reflects some type of competitive process―a feature with a high value repels other features with high values; similarly, a feature with a low value repels other features with low values [10] .
2.2.4. Software Used
Descriptive analysis used a scale comparison factor measured by using Expert choice tools. Spatial analysis of autocorrelation and geo-statistical was processed using GIS software ArcGIS version 10.4.1 with extension Spatial statistics analysis.
3. Results and Discussion
The initial paradigm in this study found the distribution of agricultural commodities cultivated by farmers in each study area, the distribution of which was divided into two parts, namely how large the farmers cultivated the commodity and how much the farmers made the commodity as the main commodity in their farming business. According to the results obtained from Graphic 1, there are 12 types of commodities cultivated by farmers in the study area. For plantation crops, coffee commodities (49.33%) are the most cultivated by farmers, and 54.30% make coffee as the main crop. Whereas for horticulture, chili is the most cultivated (63.72%) and 79.96% makes this commodity the main crop.
There are many types of commodities that farmers try on their land, ranging from horticulture to plantation crops. This diversity shows that in one area of
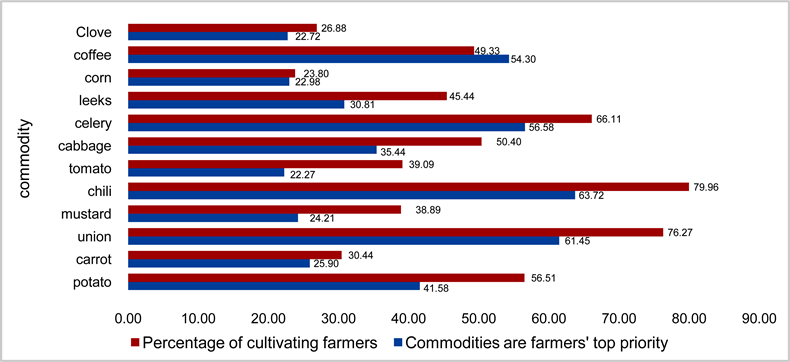
Graphic 1. Average percentage of commodities cultivated by farmers based on social preferences
the farmer in cultivating crops on his land tends to change, this also explains that there is no clear planning carried out by the government in directing land use in the agricultural sector in order to farmers can plan individually on their land.
If we associate it with the development of an agribusiness system, this is not in accordance with the concept of development and the concept of the agribusiness area. One of the problems of economic development in the agricultural sector is the difficulty of subsistence farmers breaking away from production activities only for home consumption to become profit-oriented commercial farmers by producing more for sale in the market [11] . Land use direction is needed for superior commodities that are feasible to be developed and competitive in the business sector.
Before testing the influence factor autocorrelation, it is necessary to look at the distribution of the main commodities cultivated by farmers after being integrated into Spatial (Figure 2). The distribution of this commodity in each region is not evenly distributed; each region shows strength in only one commodity. Among the types of commodities that exist, two types of commodities whose distribution is above 50% on average in each study area, namely coffee (a) and chili (e).
Abbreviations and Acronyms
Spatial autocorrelation shows the spread of social factors influencing grouping of commodity selection in each study area with the value of Moran’s index 0.613 (Figure 3). The Z score (10.35) shows the existence of spatial autocorrelation in the spread of commodities, the most dominant factor influencing is the influence of others and culture, these two factors are dominant factors affecting the distribution of commodity crops in the study area so as to form clusters. For some commodities in each region different, they depend on the form of influence

Figure 2. Map of commodity distribution percentage in the study area (a) coffee, (b) corn, (c) clove, (d) union, (e) chili, (f) leeks, (g) potato, (h) cabbage, (i) mustard, (j) celery, (k) tomato, and (l) carrot.

Figure 3. Spatial autocorerelation; social factors based on social influence.
that intervenes in the region. External influences usually under the collector traders have a comprehensive influence on all study areas such as coffee and chili commodities.
The level of suitability of land use according to the social characteristics of the community is based on people’s perceptions of the selection of plants and the social factors behind them. Factors involved as a form of social intervention include, the culture of farmers, which includes activities that have been handed down for generations by farmers so that culturally it has become a generally accepted habit. Factors of influence from others, social influences originating from outside are obtained from the influence of others, starting from the closest person/family, neighbors, and relatives in the community to those from outside the environment (Graphic 2). Socio-economic factors related to economic chains involving demand, prices and markets. The diversity of planting commodities is also influenced by the level of education of the people who use reason and farming experience.
The selection of staple crops as community farming is influenced by other factors (40%), this influence is sourced mostly from outside parties, namely the traders who enter to buy agricultural products. Limitations of market information that can be accessed by farmers are an opportunity for collectors to influence

Graphic 2. Factors that influence farmers to choose farming commodities.
and even drive farmers to determine the main crops. This practice has benefited many collectors.
Cultural factors (24%) also have a role in the farming community to determine the main crops, on average farmers are reluctant to replace the cultivated plants on the grounds that it has become a habit that has been handed down for generations by their families. They believe that what is their choice now is the best for them. On the other hand limited knowledge and information are the main causes that build perceptions of farmers who rely on culture. This can be seen from the practices of farmers in cultivating the main crops, which still use conventional techniques, even though new cultivation techniques are known.
Agribusiness commodities are commodities that can be developed on a commercial scale so that the commodity must be able to fulfilled in quantity so that all available land and biophysical suitability is fulfilled, the spread of commodity planting evenly within the region is also a concern to support commercially standardized productivity. Table 2 shows the commodities recommended for agribusiness development, there are 4 main types of plants which come from plantation crops are coffee and for hot pepper, potato and onion plants, while for the management of buffer plants recommended leeks and celery plants. Buffer plants are intercropping plants that are planted during the transition period. The choice of this plant for reasons other than the community has been cultivated for a long time; the demand for this commodity is also always there throughout the year. Generally, spatial description of the direction of land use of agribusiness commodities based on aspects biophysical analysis of land and socio-spatial can be seen in Figure 4.
Based on the results of biophysical analysis of land, the study area is a region that has the potential for the development of agricultural commodities, fertile soil types for horticulture and coffee plantations, climate, and geographical conditions. Various limiting factors such as short rainy months have no significant effect because this region has many water sources that can be utilized. The limiting factor actually comes from social variables, namely the incompatibility of commodity types from the social aspect, but the social criteria in general can be
Table 2. The direction of developing potential agribusiness plants.

Figure 4. Direction of land use for agribusiness commodities. Suitability class for biophysical aspects (obtained through biophysical and soil chemical analysis) (b) social aspects of land use suitability classes (obtained from a rating scale of 1 - 25 = N, 26 - 50 = S3, 51 - 75 = S2, and 76 - 100 = S1).
given intervention as the planning progresses.
4. Conclusions
The study results provide information that the study area is a region that has good agricultural potential. Planning for land use suitability in agribusiness-based commodity development does not only rely on biophysical information on land suitability but also integrates it with social variables as part of the limiting factor. Biophysically appropriate commodities are not necessarily acceptable from the social aspects of society, as in the research that has been carried out, there are 12 types of commodities cultivated by farmers and 10 suitable types of commodities biophysically but only 6 commodities based on social aspects that are feasible to become development direction commodities agribusiness which consists of the main commodities namely coffee, chili, potatoes and onions and supporting commodities namely celery and leeks.
The limiting factor for social aspects consists of community culture, community knowledge, market prices, market demand, and influence from other people, which influences the pattern of distribution of land use for planting commodities at the study site. With good land use referral planning, the study location is able to develop this potential to improve the economy through the agricultural sector.
Acknowledgements
The author would like to say thank you to the Ministry of Research & Higher Education for providing research funding, and to the Research and Development Center of Hasanuddin University’s Natural Resources with the support of facilities for this research.
Conflicts of Interest
The authors declare no conflicts of interest regarding the publication of this paper.
Cite this paper
Junais, I., Samsuar, S., Useng, D., Ali, H.M. and Syarif, A. (2019) Integration of Socio-Spatial Approach in Land Use Planning for Agribusiness Commodities: A Case Study of Underdeveloped Districts in South Sulawesi, Indonesia. Open Journal of Social Sciences, 7, 147-159. https://doi.org/10.4236/jss.2019.71013
References
- 1. Perpres No. 131/2015 (2015) Determination of Disadvantaged Regions 2015-2019. Government of the Republic of Indonesia, Indonesia.
- 2. Booth, A. (1989) Indonesian Agricultural Development in Comparative Perspective. World Development, 17, 1235-1254. https://doi.org/10.1016/0305-750X(89)90235-0
- 3. Rustiadi, E., Saefulhakim, S. and Panuju, D.R. (2011) Perencanaan dan Pengembangan Wilayah. Crestpent Press dan Yayasan Pustaka Obor Indonesia, Jakarta.
- 4. FAO (1976) A Framework of Land Evaluation. FAO Soil Bulletin, Rome, No. 6.
- 5. Balai Besar Penelitian dan Pengembangan Sumberdaya Lahan Pertanian (2011) Petunjuk Teknis Evaluasi Lahan Untuk Komoditas Pertanian. BBPPSDLP Badan Litbang Kementerian Pertanian, Bogor.
- 6. Goodchild, M.F. and Janelle, D.G. (2004) Thinking Spatially in the Social Sciences. Spatially Integrated Social Science, Oxford University Press, New York.
- 7. Kosfeld, R., Eckey, H.F. and Dreger, C. (2002) Regional Convergence in Unified Germany: A Spatial Econometric Perspective. Univ., Fachbereich Wirtschaftswiss, Germany.
- 8. Anselin, L. (1995) Local Indicators of Spatial Association-LISA. Geographical Analysis, 27, 93-115. https://doi.org/10.1111/j.1538-4632.1995.tb00338.x
- 9. Kalivas, D.P., Kollias, V.J. and Apostolidis, E.H. (2013) Evaluation of Three Spatial Interpolation Methods to Estimate Forest Volume in the Municipal Forest of the Greek Island Skyros. Geo-Spatial Information Science, 16, 100-112. https://doi.org/10.1080/10095020.2013.766398
- 10. ESRI (2015) ArcGIS Version 10.4.1.
- 11. Wharton, J. (2017) Subsistence Agriculture and Economic Development. Routledge, Abingdon-on-Thames. https://doi.org/10.4324/9781315130408