World Journal of Nuclear Science and Technology
Vol.2 No.4(2012), Article ID:23806,8 pages DOI:10.4236/wjnst.2012.24030
Development of New Methodology for Distinguishing Local Pipe Wall Thinning in Nuclear Power Plants
Power Engineering Research Institute, Yongin, Korea
Email: hkm@kepco-enc.com
Received September 17, 2012; revised October 17, 2012; accepted October 25, 2012
Keywords: Pipe Wall Thinning; Component; Multiple Inspection; ANOVA-1 Method; TPM (Total Point Method); NAM (Near Area of Minimum) Method
ABSTRACT
To manage the wall thinning of carbon steel piping in nuclear power plants, the utility of Korea has performed thickness inspection for some quantity of pipe components during every refueling outage and determined whether repair or replacement after evaluating UT data. Generally used UT thickness data evaluation methods are Band, Blanket, and PTP (Point to Point) methods. Those may not desirable to identify wall thinning on local area caused by erosion. This is because the space between inspecting points of those methods are wide for covering full surface being inspected components. When the evaluation methods are applied to a certain pipe component, unnecessary re-inspection may also be generated even though wall thinning of components does not progress. In those cases, economical loss caused by repeated inspection and problems of maintaining the pipe integrity followed by decreasing the number of newly inspected components may be generated. EPRI (Electric Power Research Institute in USA) has suggested several statistical methods such as FRIEDMAN test method, ANOVA (Analysis of Variance) method, Monte Carlo method, and TPM (Total Point Method) to distinguish whether multiple inspecting components have been thinned or not. This paper presents the NAM (Near Area of Minimum) method developed by KEPCO-E & C for distinguishing whether multiple inspecting components have been thinned or not. In addition, this paper presents the analysis results for multiple inspecting ones over three times based on the NAM method compared with the other methods suggested by EPRI.
1. Introduction
Pipe components made by carbon or low alloy steel placed on secondary system in nuclear power plants have experienced wall thinning caused by FAC (Flow Accelerated Corrosion) or erosion such as cavitation, flashing, and LDIE (Liquid Droplet Impingement Erosion) [1]. FAC is the corrosion phenomenon accelerated by high temperature and high velocity water and wet steam circumstance. LDIE is caused by the impact of high velocity droplets or liquid jets [2]. To manage the wall thinning in nuclear power plants, plant utilities have performed thickness inspection for some quantity of components during every refueling outage (RFO) and determined whether to perform repair or replacement after evaluating UT data.
Generally used UT data evaluation methods are Band, Blanket, and PTP (Point to Point) methods [3]. However, those are not desirable to identify wall thinning on local area caused by erosion. This is because the space between inspecting points are wide for covering full surface being inspected components. In addition, unnecessary re-inspection may be generated due to manufacturing or measurement errors for components in spite of no wearing. In such cases, economical loss caused by repeated inspection and problems of maintaining the pipe integrity followed by decreasing the number of newly inspected components may be generated. EPRI (Electric Power Research Institute in USA) has suggested several statistical methods [4] such as FRIEDMAN test method, ANOVA (Analysis of Variance) method, Monte Carlo method, and Total Point method to distinguish whether multiple inspecting components have been thinned or not. Although the suggested ones are applicable for distinguishing large area of wall thinning such as damages by FAC, those may not be applicable for distinguishing local area of wall thinning such as by erosion.
This paper presents the NAM (Near Area of Minimum) method developed for applicable both wide range of wall thinning caused by FAC and small range of wall thinning caused by erosion.
2. Features of Wall Thinning Area and UT Data Evaluation Methods
2.1. Features of Wall Thinning Area
For carbon steel pipe components installed secondary system in nuclear power plants, once FAC has been progressed, relatively large area of components has been affected. Meanwhile, once erosion has been occurred, relatively small area of components has been affected. Figure 1 shows wall thinned surface of elbow caused by FAC. Wide range of extrados surface was damaged. Figure 2 shows erosion surface caused by liquid droplet impingement. The wet steam, coming from the feedwater heater vent pipeline, collided with the other side surface of the vent line (middle of lower one in Figure 2) and generated local erosion.
2.2. Evaluation Methods for UT Data
The utility of Korea perform thickness inspection with a full-coverage grid layout on components being inspected. Figure 3 shows the grid layout for an elbow. With the full-coverage grid layout, local progressed erosion damage could not be found. When the existing UT data evaluation methods, such as Band, Blanket, PTP (Point to Point) Methods, etc. [3] are applied to a certain pipe component, unnecessary re-inspecting may be generated due to manufacturing or measurement errors for components even though wall thinning does not progress.
Therefore, for components being inspected several times, it is very important to distinguish whether the components have been thinned or not in order to decide whether future inspection should be done or not in light of cost effectiveness and maintaining pipe integrity.

Figure 1. Damaged surface by FAC.

Figure 2. Damaged surface by LDIE.

Figure 3. Full-coverage grid layout.
3. Review of Wall Thinning Distinction Methods
In all utilities through the world, unnecessary re-inspection for components even though wall thinning does not progress is an unsolved problem. EPRI suggested several methods for distinguishing whether multiple inspection components have been thinned or not. The suggested ones are FRIEDMAN test method, ANOVA-1 (One-way Analysis of Variance), ANOVA-2 (Two-way Analysis of Variance), Monte Carlo Method [4], and Total Point Method (TPM) [5].
FRIEDMAN test method uses a ranking of the measurements rather than the measurements themselves to determine whether components have been thinned or not. It is concluded that the Freidman test method is inappropriate for the determination desired purpose. This is because the method predicts many cases of wear while evidence indicates that the components are not wearing.
ANOVA-2 method uses the measurements themselves to determine whether components have been thinned or not by comparing two independent data sets of one case. It is concluded that the ANOVA-2 method is inappropriate for the determination desired purpose. This is because only fluctuation of thickness data by inspection terms can be considered as an independent variable.
Monte Carlo Method uses fictious data to calculate average wear rate in order to determinate the components will be thinned or not for next inspection period. It is concluded that the method is inappropriate for the determination whether the inspected components will experience wall thinning or not.
LSS (Least Square Slope) method is not explained in this paper. The results of LSS method are used to TPM for the desired determination.
It remains to be seen what is applicable for determination whether pipe component has been wall thinned or not. It is concluded that the ones capable for the purpose are ANOVA-1, TPM, and NAM methods. The NAM method is the new approach developed by KEPCO-E & C. Section 3.1 through 3.3 give explanations of those methods. Section 4 presents overview of analysis results for multiple inspection data.
3.1. TPM
In order to apply TPM for the desired determination, UT data matrix at least inspected two different terms should be presented. And, the number of rows and columns of data matrix should be same.
LSS method [6] is a way to obtain wear rate from the magnitude of least square slope in the same point on a component. The histogram is acquired by the magnitude of the wear rates obtained from the least squares slopes in the same points for all points on a component. Figure 4 shows the acquired histogram.
Components are “Wear” when the number of positive values is more than the number of negative values on inspected points. Components are “No Wear” when the number of negative values is more than the number of positive values on inspected all points. The component on Figure 4 is “Wear” which is indicated by most wear rate magnitude is positive, placed on 4.4 mils/year.
3.2. ANOVA-1 Method
This section presents the ANOVA-1 [4] approach for determination wether components has been thinned or not. The associations between mean values of data set and inspect outages are taken into account when the one way ANOVA performs analysis data sets.
Table 1 shows inspected measurement obtained at the four different outages on 38 components. The calculated results by ANOVA-1 are presented on Table 2. The null hypothesis for the desired determination is that there is no association between measurements and inspection outages. In other words, it is expected that the mean value of measurements at every inspection outages are identical. As shown in Table 2, the null hypothesis is not rejected because F ratio (0.026) is less than the critical F (2.67). The same conclusions can also be reached by examining P value. The P value (0.99) is greater than 0.05 with a 95% confidence level. It means that wall thinning is progressed.
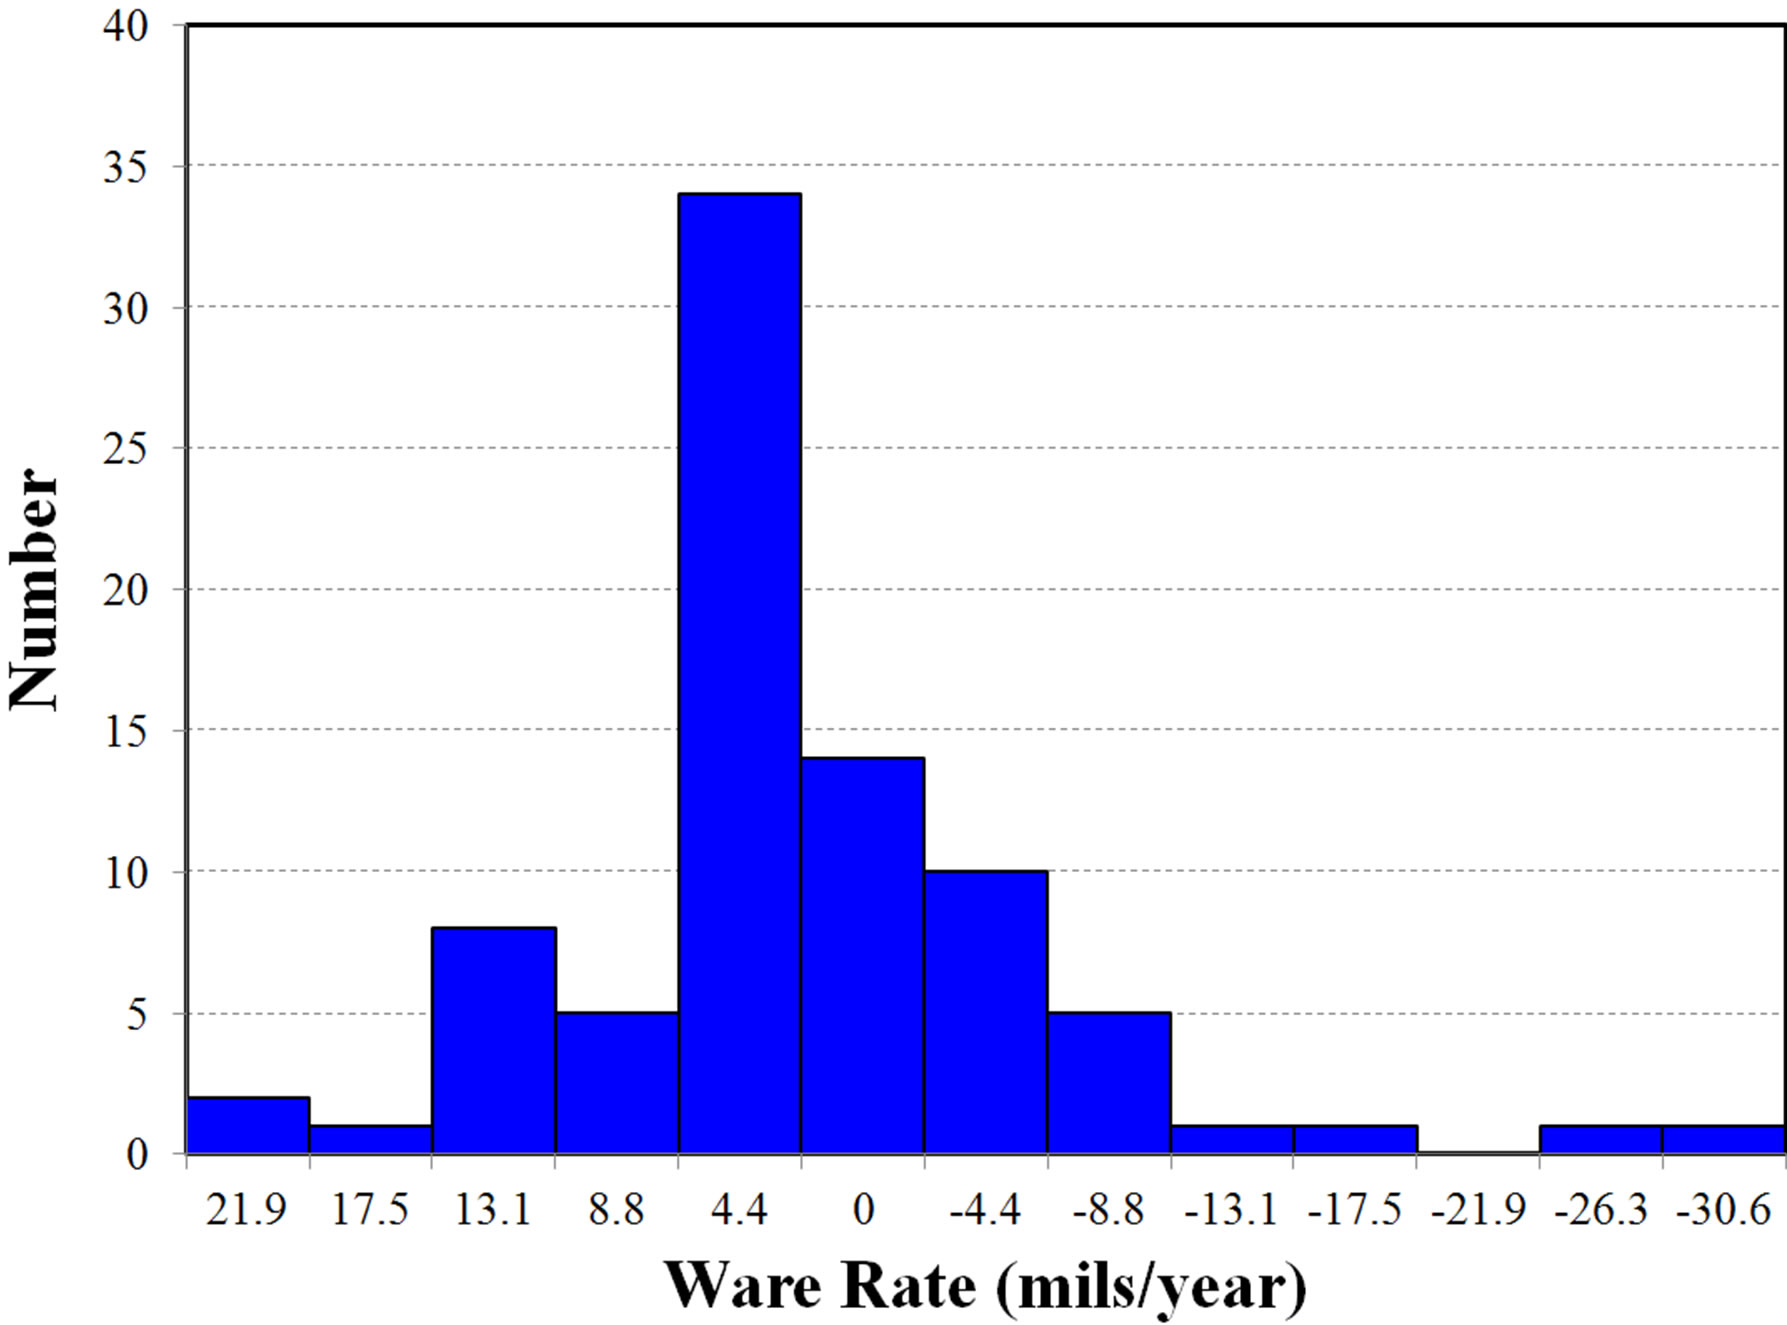
Figure 4. Sample histogram of TPM.

Table 1. UT data for each inspection outage.

Table 2. Calculation results for ANOVA-1.
3.3. NAM Method
NAM method is the new approach developed by KEPCO-E & C for determination whether components have been thinned or not. The calculation for NAM method is following. For last inspection period, select the minimum point and neighboring 8 points of it and calculate average slop of those 9 points by inspections outages. It is determined that thinning is progressed when the mean value of slops is negative. The evaluation work by NAM method is based on minimum point and neighboring 8 points of it. Therefore, the method is applicable to determine not only wide range of wall thinning caused by FAC but also small range of wall thinning caused by erosion. Followings are estimated results by NAM method. Tables 3-5 present measurement data obtained from a 90˚ elbow at RFO 13, RFO 16, and RFO 18. The minimum thickness data during RFO 18 is 0.434 inch on the point (a, 6). The extracted slops of the point and neighboring 8 points of it are presented on Figure 5. The average value of slops is 0.0003 that is, wear is not occurring.
Another 90˚ elbow (B) was examined at RFO 13, RFO 15 and RFO 18. Data set at each RFO is presented on Tables 6-8. The minimum thickness data during RFO 18 is 0.453 inch on the point (h, 7). The extracted slops by RFO of the point and neighboring 8 points of it are presented on Figure 6. Wear is occurring as the average value of slops is –0.0169.

Table 3. UT data of a 90˚ elbow (A) at RFO 13.

Table 4. UT data of a 90˚ elbow (A) at RFO 16.

Table 5. UT data of a 90˚ elbow (A) at RFO 18.

Table 6. UT data of a 90˚ elbow (B) at RFO 13.

Table 7. UT data of a 90˚ elbow (B) at RFO 15.

Table 8. UT data of a 90˚ elbow (B) at RFO 18.

Figure 5. Application of NAM method for a 90˚ elbow (A).

Figure 6. Application of NAM method for a 90˚ elbow (B).
When components are indicated wear is occurring by NAM method, further inspection is performed. As shown in Figure 7, to point out the presence of wear, the space between inspecting points is reduced to a fifth on the thinned area. By conducting evaluation process by NAM method based on the re-inspected data, it is determined whether the component has experienced wear or not.

Figure 7. Grid layout for a detailed UT examination.
4. Discussion of the Various Methods
This section presents availability of ANOVA-1, TPM, and NAM method for answering wall thinning determination on multiple inspection components. The availability above three methods explored based on at least three different multiple inspection data of 41 components in NPP (nuclear power plant) A and 40 components in NPP B. Then a close reading based on visual identification of the data made it clear that whether the actual wall thinned or not.
Table 9 shows the thickness data obtained from TE0- 17AXA (Expander) at each refueling outage. The evaluation results are “No Wear” by ANOVA-1, “Wear” by TPM, and “No Wear” by NAM. A close reading of the data table makes the component “No wear”. Average thickness of the minimum measurement area (inside small rectangular in the data matrix) at three different RFO is 1.060, 1.047, and 1.060. Also, the minimum thickness data is 0.966, 0.971, and 0.973. This indicates that there are no specific parts which have been gradually thinned. Therefore, the results by ANOVA-1 and NAM are appropriately evaluated.

Table 9. UT data on TE017AXA at each RFO.
Table 10 shows the thickness data obtained from TF124AXA (Expander) at each refueling outage. The evaluation results are “No Wear” by ANOVA-1, “No Wear” by TPM, and “Wear” by NAM method. A close reading of the table makes the component “Wear”. Average thickness of the minimum measurement area (inside small rectangular in the data matrix) at three different RFO is 0.350, 0.336, and 0.331. Also, the minimum thickness data is 0.231, 0.217, and 0.190. This indicates that there are specific parts which have been gradually thinned. Therefore, the results by NAM are only appropriately evaluated. TE017AXA, TF124AXA were given as component names.
The results of evaluation by the different methods based on 41 components in NPP A are tabulated Table 11. The results of evaluation by the different methods based on 40 components in NPP B are tabulated Table 12. The following two acronyms are tabulated in the column of TPM, ANOVA-1, and NAM. “W” represents wall thinning is occurring, “NW” represents wall thinning is not occurring. The last column on those tables presents the judgments by a close reading of the thickness data, visual identification. The following three features are tabulated in the column of visual identification. ○ represents wall thinning is occurring, × represents wall thinning is not occurring, and △ represents ambiguous to determine whether the wall thinning is occurring or not.
Assuming that the visual identification results for 41 components placed on NPP A is correct, results from ANOVA-1, TPM, and NAM methods shows 39%, 71%, and 85% accuracy, respectively. If ambiguous ones are being considered as wearing ones, the accuracy is 39%, 80%, and 100%. Assuming that the visual identification results for 40 components placed on NPP B is correct, results from ANOVA-1, TPM, and NAM methods shows 43%, 58%, and 68% accuracy. If ambiguous ones are being considered as a wearing, the accuracy is 43%, 70%, and 93%. Considering ambiguous ones as wearing ones, and put evaluation results from NPP A and NPP B together, the accuracy of ANOVA-1, TPM, NAM method is 42%, 76.5% and 97.5%. It clearly shows evaluation results from NAM are more accurate than results from the other two methods.

Table 10. UT data on TF124AX at each RFO.

Table 11. Comparison of accuracy among wall thinning distinction methods for NPP A.

Table 12. Comparison of accuracy among wall thinning distinction methods for NPP B.
5. Conclusions
To manage the wall thinning of carbon steel piping, thickness inspection for a certain amount of components has performed with the full-grid layout during every refueling outage. Then continue to use or replacement are determined by evaluating the UT inspection data. Yet, occasionally local wall thinning such as erosion damage cannot be examined with the full-grid layout due to the distance between inspection points is too large. In addition, unnecessary re-inspection may be generated due to manufacturing or measurement errors for components in spite of no wearing. Problems may appear economical loss due to unnecessary repeated inspection on components, wall thinning does not evidently progress, and unstable pipe integrity due to reduced new inspection components by increasing components needed to be checked in limited inspection period.
The NAM method, developed by KEPCO-E&C, is for distinguishing whether at least three different inspecting components have been thinned or not. The evaluation process of NAM method is first selecting the minimum thickness point and neighboring 8 points of it from the last order of inspection thickness data and then calculating average value of slopes for the 9 points by inspection period. Wear is indicated when the average value of slops is negative. When components are indicated wear is occurring by NAM method, detailed UT inspection is performed with reduced space between inspecting points. A total of 81 components, multiple inspection ones, placed on different two nuclear power plants were evaluated by ANOVA-1, TPM, and NAM method. The analysis results from NAM method show more high accuracy than results from the other two methods
REFERENCES
- J. Horowitz, “Recommendations for Controlling Cavitation, Flashing, Liquid Droplet Impingement Erosion, and Solid Particle Erosion in Nuclear Power Plant Piping Systems,” Electric Power Research Institute 1011231, Final Report, 2004.
- N. A. Barton, “Erosion in elbows in hydrocarbon production systems: Review document,” Health & Safety Executive, TUV NEL Limited, Glasgow, 2003.
- A. Machiels and D. Munson, “CHECWORKSTM Steam/ Feedwater Application, Guidelines for Plant Modeling and Evaluation of Component Inspection Data,” Electric Power Research Institute 1009599, Final Report, 2004.
- J. Horowitz, “Statistical Methods for the Analysis of Multiple-Inspection Flow-Accelerated Corrosion Data,” Electric Power Research Institute 1019175, Final Report, 2009.
- D. G. Gusso, “Implementation Test Project on the Total Points Method,” Electric Power Research Institute 1022575, Technical Update, 2011.
- J. Horowitz, “Least Squares Methods for Evaluation Inspection Data,” Electric Power Research Institute 1018456, Technical Update, 2008.