Journal of Environmental Protection
Vol.07 No.10(2016), Article ID:71078,27 pages
10.4236/jep.2016.710121
Environmental Studies on the Aqaba Gulf Coastal Waters during 2011-2013
Ahamed M. Abdel-Halim1, Mohamed A. Aly-Eldeen1, Laila M. Abdel Fattah1, Mamdouh A. Fahmy1, Ehssan M. Abo-El-Khair1, Azza M. Khaled1, Ahamed Abu El-Soud2, Mohamed A. Shreadah1*
1National Institute of Oceanography and Fisheries, Alexandria, Egypt
2Environmental Affairs Agency, Ministry of Environmental Affairs, Cairo, Egypt

Copyright © 2016 by authors and Scientific Research Publishing Inc.
This work is licensed under the Creative Commons Attribution International License (CC BY 4.0).
http://creativecommons.org/licenses/by/4.0/


Received: July 4, 2016; Accepted: September 27, 2016; Published: September 30, 2016
ABSTRACT
In order to assess the quality of the Aqaba Gulf coastal waters for the sustainable use and development, and consequently for the national income, four field campaigns were annually carried out during the period from 2011-2013 to monitor hydrographic variables, i.e. temperature, salinity, pH, etc., nutrients, some heavy metals, i.e. iron, lead, copper, cadmium, chromium, etc. in addition to petroleum hydrocarbons. Except for the area of Sharm El-Sheikh Harbor, the results for the density, composition, and distributions of beach litter cleared out that the Egyptian shoreline of the Aqaba Gulf is relatively not affected by man-made litter. The area of Sharm El-Sheikh Harbor was subjected to many factors which undoubtedly affected the rate of man-made litter accumulation, especially, oil contamination (oil and old or new tar) which is a good estimator of levels of oil contamination and an effective means of evaluating the potential threat of oil on coastal resources. The results of the present study cleared out also that water temperature followed seasonal changes in air temperature. Aqaba Gulf water is characterized by its high salinity and the presence of well oxygenated waters. Minor changes in the distribution of pH, BOD, DOM and COD, revealed limited effects of human impacts. Low levels of Chl-a and TSM concentrations and high transparency revealed also negligible effects for human impacts. Significantly higher sea water temperatures, TSM, DO, BOD, DOM, COD, NH4, NO2, PO4 and TP were observed in summer season compared to their corresponding values in winter season. On contrast, higher values of chlorophyll-a, NO2, TN, and SiO4 were observed in winter compared to summer season. Based on the mean annual values, Aqaba Gulf coastal waters are classified as oligotrophic to mesotrophic state. The concentrations of dissolved inorganic nitrogen forms followed the following order: . In general, the majority of TN in winter was in the form of organic-N (96.3%) compared to 91.7% in summer season. On the meantime, TP exhibited more or less comparable organic-P percentage in summer (86.2%) and winter (81.2%) seasons. Moreover, the DIN/DIP ratio showed relatively higher values in winter season (14.2:1) compared to summer season (12.4:1). This indicates high nitrogen concentrations in comparison with that of phosphorous in winter; yet it reflects the generally lower nutrient levels present in the coastal waters of the Aqaba Gulf due to the lack of significant nutrient input or oceanic upwelling. Concentrations of heavy metals were relatively low signifying that Aqaba Gulf Coastal waters are not yet seriously threatened in spite of the rapid recreational and human developments that are considered a challenge to the safety and viability of Aqaba Gulf marine environment. Furthermore, concentrations of petroleum hydrocarbons were significantly higher in summer than in winter that are mainly attributed to the increase in the levels of oil pollution that most probably resulted from the increase in accidental, deliberate or operational discharges and spills of oil from ships. In general, the maximum concentration was much lower than the harmful concentrations reported for seawater. A stepwise multiple linear regression, analysis of variance (ANOVA), and principle component analysis (PCA) were applied.
Keywords:
Physicochemical Properties, Nutrients, Heavy Metals, Petroleum Hydrocarbons, Coastal Water, Gulf of Aqaba

1. Introduction
Several coastal areas in some Arab countries have been upgraded for housing, tourism, and industrial purposes, and related infrastructure and service facilities have been developed leading to the degradation of environments, loss of their productivity and the gradual decline of their services, which negatively impacts human livelihood and well- being [1] - [13] . Concern has been raised over the environmental sustainability of these projects and the capacity of fragile ecosystems to absorb them taking in consideration that environmental protection should necessarily be included in all development strategies. Probably the greatest challenge facing coastal areas and their natural environments and urban structures is the adoption of an integrated coastal zone management approach that ensures reduction of pollution and treatment of its causes [1] [14] - [17] . Moreover, efforts should aim at creating opportunities for sustainable tourism and mitigating climate change risks and the consequential sea-level rise which poses a real threat to several coastal Arab areas. Undertaking quick measures and decisions and mobilizing resources are essential for resolving these issues and ensuring sustainability of resources.
The Red Sea, which contains globally unique ecosystems and biodiversity [18] - [24] is threatened with serious degradation as a result of pollution, physical destruction and unsustainable exploitation of marine and coastal natural resources [25] - [30] . The Gulf of Aqaba, like the coastal waters of the Red Sea, is one of the world’s premier diving locations. The area is especially rich in coral and other marine biodiversity [31] . It also contains a number of underwater wrecks, some accidental shipwrecks, others vessels deliberately sunk in an effort to provide a habitat for marine organisms and bolster the local dive tourism industry. As a result of its semi-enclosed nature, the Gulf of Aqaba is particularly susceptible to marine pollution and ecosystem degradation [18] [25] . The Gulf serves as a connecting point for the African and Asian continents. The semi enclosed characteristics of the Gulf of Aqaba have led to its rich biodiversity. The Gulf hosts an extraordinary diversity of coral and related marine life [32] . However the Gulf shows limited water exchange with the Red Sea and Indian Ocean [33] - [35] . Also the semi enclosed nature of the environment of the Gulf of Aqaba causes the sea to particularly susceptible to pollution. Marine pollution sources include urbanization, industrialization, aquatic tourism, oil spills, solid waste, waste oil contamination, phosphate dust, air pollution from land transportation, chemical pollution from industries, thermal pollution from power plant etc. [25] [36] - [39] . If these activities are not controlled in an environmentally sound and sustainable manner environmental degradation will worsen. A regional water-quality monitoring program has been established including seasonally baseline testing at selected locations along the coast of the Gulf of Aqaba so as to assess the marine pollution in the coastal area of the horizontal and vertical distribution of hydrochemical parameters such as temperature, salinity, dissolved oxygen, turbidity, total solids etc. in addition to eutrophication parameters, i.e. chlorophyll-a and nutrients. Microbiological, heavy metals and total petroleum hydrocarbons pollution were also investigated. The program addresses priority threats to the Egyptian coastal waters of the Gulf of Aqaba and Red Sea in a comprehensive manner. It facilitates development of an approach to halt and prevent marine pollution, and protect globally important coral reefs throughout the Red Sea area.
The main objective of the present paper is to the environmental impact assessment of the impacts of different human activities, massive commercial and industrial development; including the creation of pleasure boat marinas, a protected coral reef nature reserve, and numerous hotels, restaurants and other tourist activities. These developments have seriously disturbed the Gulf’s coastal and marine ecosystems which are important environmental, economical, and recreational areas in Egypt for their management and sustainable development.
2. Material and Methods
2.1. Study Area
The Red Sea is 1930 km long and averages 280 km in width. It is a gulf or basin of the Indian Ocean between Africa and Asia. In the north are the Sinai Peninsula, the Gulf of Aqaba and the Gulf of Suez. The Gulf of Aqaba is a large gulf of the Red Sea which is located to the east of the Sinai Peninsula and west of the Arabian mainland. The Gulf of Aqaba in the northern Red Sea is a warm water body, approximately 180 km long and on average 8 km wide, and attains a depth of about 1355 m. It is a deep basin with narrow shelves, which comprises two isolated depressions separated by a submarine sill (Figure 1). The northern depression is about 1100 m deep and the southern depression is about 1420 m deep. The maximum depth within the Gulf of Aqaba is observed near the east coast with a depth of 1829 m. The Gulf of Aqaba is a marine environment enclosed by arid lands that experience extremes of temperature and exceedingly low levels of precipitation. These conditions have led to the evolution of unique, and hence internationally important, coral reef and marine ecosystems, which are particularly susceptible to damage from pollution or other forms of environmental impact. The Gulf of Aqaba also represents a natural resource of major economic significance to the Egypt in terms of access to sea transportation and the development of tourism and other industries along its shores.
2.2. Sampling
Within the framework of the Environmental Information and Monitoring Program (EIMP), 12 field campaigns were carried out in 3 years (2011-2013). A total of 72 subsurface coastal water samples were seasonally collected, in duplicate, during March, May, August and October of 2011-2013. Six stations were selected along the Gulf of Aqaba (Figure 1). The latitude and longitude of each station are given in Table 1.
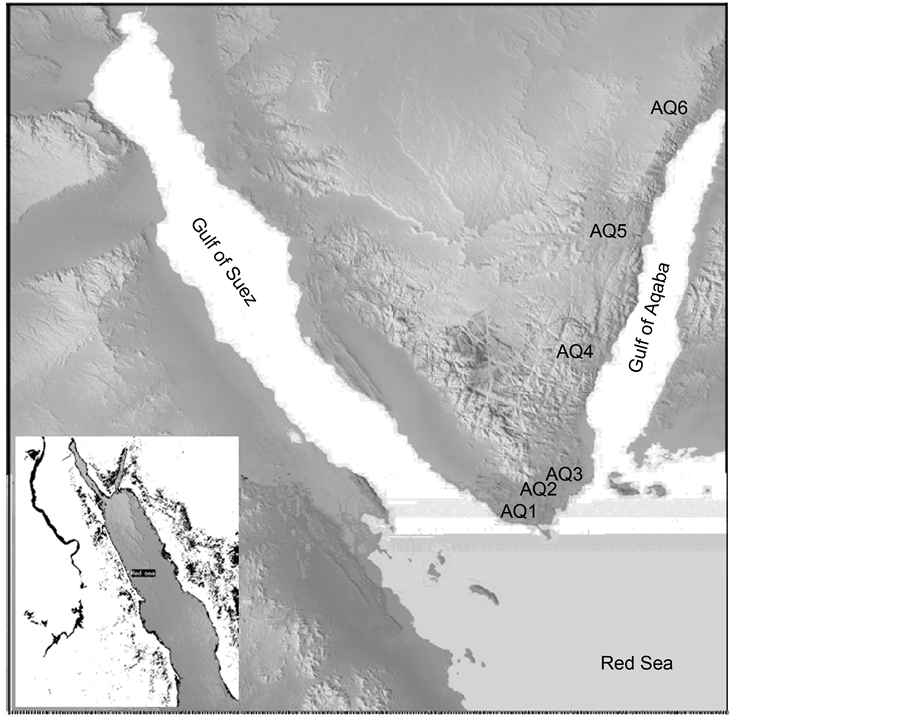
Figure 1. Locations of sampling sites along the coast of the Aqaba Gulf.

Table 1. Locations of different sampling sites in the study area.
2.3. Climatic Conditions in Gulf of Aqaba
Climatic conditions in the Gulf of Aqaba are described [40] [41] .
2.3.1. Air Temperature
The climate is arid, with a yearly average net evaporation of 1 cm/day. The monthly variations of air temperatures vary from 17.8˚C to 20.3˚C in winter, from 24.1˚C to 31.7˚C during spring, from 31.5˚C to 32.7˚C during summer, and from 20.4˚C to 26.8˚C during autumn.
2.3.2. Relative Humidity
The maximum values of humidity vary from 54.6% to 63.5% in the winter months (November to April), which is a relatively high relative humidity. In the summer months; from May to October; the maximum values of humidity vary from 47.5% to 55.6%, showing that the summer months are more arid.
2.3.3. Winds
Winds blow mainly from the north-northwest direction throughout the year. Winds also reach the area from other directions but with lower frequency; from April to October, winds are prevailing either from southeast or northeast direction. From November through March, winds swing less frequently from east to west beside the dominant northern winds.
2.3.4. Cloud Cover
The Red Sea is a very unclouded area. The cloudiest months are from December to March when more than one-quarter cover is to be expected for 30% - 40% of the time. For the rest of the year cloud cover is very small, 10% - 20%, with long cloudless period from June to September.
2.3.5. Rainfall
Rainfall in the region is extremely sparse and localized. The rain is mostly in the form of showers of short duration, often associated with thunderstorms and occasionally with dust storms, resulting in poor visibility. All of the rainfall in the region occurs within just a few days, mostly in December; during some years none falls. Measured during a 20-year period, the average annual rainfall was about 25 mm for the Gulf of Aqaba. Climatological studies of the area document the large deficit between the amount of precipitation and evaporation. Rainfall at the northern end of the Gulf of Aqaba is normally 22 mm per year. Evaporation is 179 mm, eight times precipitation, leaving a deficit of 157 mm per year. Inflow of waters from the Red Sea balances the deficit.
2.3.6. Tide
Tides are semi-daily and it is about 70 cm at Taba and 90 cm near Sharm El-Sheikh. No nodal point exists along the Gulf of Aqaba.
2.3.7. Water Movement and Current
The fundamental movements of surface water follow the winds, so a warm less saline surface water current flows into the gulf from the Red Sea replacing waters lost by evaporation and by an out flowing deeper density current of more saline cooler waters. Stormy winds in the Gulf of Aqaba accompanied by winds of up to 45 to 80 knots provide considerable bursts of energy to these currents. Because some of the high winds are southerly, especially in winter, one can expect to find the normal long shore current’s flow to be temporarily reversed. Currents in the southern part of the gulf are most affected by strong southerly winds.
2.4. Methods
2.4.1. Hydrographic Parameters
The hydrographic parameters (water temperature, salinity, pH, Transparency, dissolved oxygen (DO) were measured in situ at each station using CTD (YSI-6000). Transparency was measured by secchi disk. Dissolved oxygen was also measured using modified Winkler method [42] . Biological oxygen demand (BOD) samples were kept in incubator and fixed after 5 days and their DO contents were determined. Dissolved organic matter (DOM) was carried out using potassium permanganate according to the method described by [43] , and chemical oxygen demand (COD) was determined by the dichromate closed reflux titrimetric method [42] .
2.4.2. Chlorophyll-a, TSM, Transparency, and Nutrient Salts
Chlorophyll-a (Chl-a) was measured in 3L water samples after collection and filtration by using 0.45 µm filters. Chl-a was extracted using 90% acetone and measured spectrophotometerically according to [44] . Ammonium ion concentrations were determined according to [45] . Nitrite, Nitrate, reactive phosphate and reactive silicate concentrations were determined on pre-filtered seawater samples (Whatman GF/C) following the sepectrophotometric techniques described by [44] [45] by using HACH DR-2000 direct reading spectrophotometer. Total P and total N were estimated in unfiltered water samples following the procedure described by [46] . Total suspended matter (TSM) was collected from 3 L seawater samples by filtration through washed, dried and pre- weighed 0.45 µm membrane filter. The filters with the retained particles were washed then air dried in the oven at 60˚C for 24 - 48 hours until constant weight. The difference between the dry weight of membrane filters before and after filtration was expressed in mg/l [44] . Transparency was measured by secchi disk. The concentration of dissolved inorganic nitrogen (DIN as the sum of NH4-N + NO2-N + NO3-N) was calculated.
2.4.3. Heavy Metals
Dissolved heavy metals, i.e. Fe, Mn, Cu, Zn, Cd, etc. were determined after pre-con- centration from seawater by using chelex-100 cation-exchange resins according to [47] and [48] . Measurements were done by using the atomic absorption spectrophotometer (AAS)/flame mode (Shimadzu AA-6800).
2.4.4. Petroleum Hydrocarbons
Petroleum hydrocarbons were extracted from seawater samples by using dichloromethane. Sample extracts were concentrated by rotary evaporation to 5 ml. Finally, samples were concentrated under a gentle stream of pure nitrogen to a final volume of 1 ml, then measured using UV-spectrophotometer at 410 nm emission after excitation at 360 nm and chrysene as standard [49] .
2.5. Quality Control
Calibration curves for each variable of nutrient salts and heavy metals were constructed of a blank and four or more standards (Merck Germany). Accuracy and precision were confirmed using synthetic samples and/or reference materials of different nutrient salts and metals and measured every five samples as quality control tools.
2.6. Statistical Analysis
A stepwise multiple linear regression to give insight about the relationships between the independent variables and the dependent variables were calculated (n = 106, p ≤ 0.05) to test the relationship between variables. The correlation coefficient is significant at r ≥ 0.195. Analysis of variance (ANOVA) was applied to test significant differences in the measured variables and correlation matrices were constructed from the resulting coefficients with the aid of STATISTICA 10 program. Cluster analysis was applied to organize the observed data into meaningful structures and general categories with the aid of STATISTICA 10 program. Moreover, principle component analysis (PCA) and factor analysis as Varimax normalization rotated were applied with SPSS program version 15.0 for Windows. The number of factors was determined by the total variance explained, i.e. communality, usually more than 85% was necessary.
3. Results and Discussion
3.1. Visual Observations
Marine litter includes any manufactured or processed solid waste material that enters the marine environment from any source [50] . The main sources of marine litter at a coastal site are 1) offshore sources which include industrial and domestic waste disposed off at sea, fishing and shipping waste, and sewage related debris, and 2) land- based sources which include litter originating from visitors to the coast, or those originating from the unauthorized dumping of large items such as landfill materials [50] - [55] . The presence of marine debris on the Egyptian coastal areas of the Aqaba Gulf is parallel to the increase in urbanization, industrialization, shipping, fishing and tourism activities, and population growth. Beach litter of lumps of new and old tar, oil, feces, sewage disposal, general and harmful liters as well as seaweeds of coastal beach zones especially those used for recreational purposes including pollution index and the magnitudes of pollution for respective items [36] [37] [41] are assessed by eyes according to: none, light, moderate and heavy, allocating respective scores ranging from “0” to “3” (Table 2).
Besides affecting the fishing industry and scuba diving tourism, beach litter cause a destruction of living resources and reduces the recreational utility of coastal waters, especially the beaches through shore damage [2] [4] [5] [36] [37] [56] [57] .
Except for the area of Sharm El-Sheikh Harbor, the results of Table 3 of respective years and annual average monitoring for the density, composition, and distributions at different stations cleared out that the Egyptian shoreline of the Aqaba Gulf is relatively not affected by man-made litter. The area of Sharm El-Sheikh Harbor (AQ 02) was subjected to many factors which undoubtedly affected the rate of man-made litter accumulation, especially, oil contamination (oil and old or new tar) which is a good estimator of levels of oil contamination and an effective means of evaluating the potential threat of oil on coastal resources [7] [8] [56] [57] .
In general, the most abundant visible items were general litter as they represented
Table 2. The total scores of seven items stand for the pollution index.
Table 3. Magnitudes of pollution of respective years and annual average monitoring stations.
43.6% of the total items encountered. Faces, on the other hand, represented 16.2% followed by oil, seaweeds and harmful litter which constituted 14.8%, 11.3% and 10.6%; respectively. On contrast, no sewage could be observed during the three respective years (2011-2013).
3.2. Physicochemical Properties
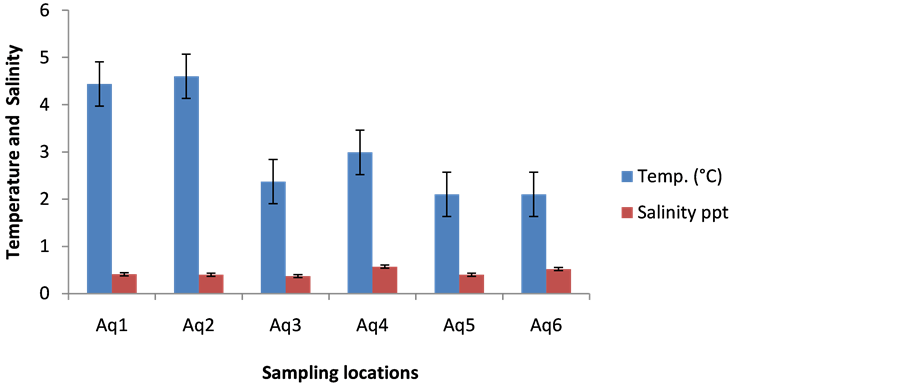
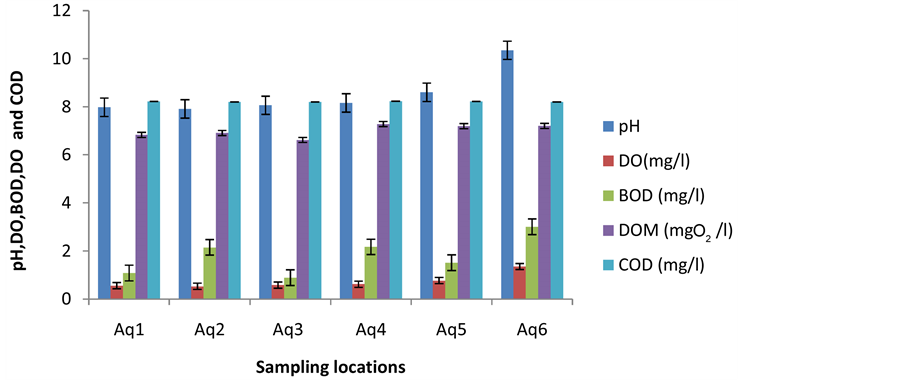
The ranges and average values of water temperature, salinity pH, DO, BOD, DOM and COD of the Aqaba Gulf surface coastal waters during 2011-2013 are listed in Table 4. The maximum water temperature was 39.56˚C in August, 2013 at AQ 02; while the minimum temperature was 20.14˚C in March, 2013 at AQ 04 following seasonal changes in air temperature [58] - [62] . No significant regional variations in the distribution of water temperatures (Figure 2(a)). Seasonal variations revealed higher temperatures in summer (39.32˚C) compared to their corresponding values (22.51˚C) in winter season (Figure 2(b)) suggesting more pronounced variability and variations in water temperature was normal and changed according to many variables such as season, day time, depth, tide, wind, current, water inflow and turbidity [22] [27] [63] [64] . Based on the distribution of surface salinity in the investigated area, the maximum regional value (40.46 ppt) was observed at AQ 04 in August, 2012, while the minimum one (38.88 ppt) was measured at AQ 06 in March, 2011 (Figure 2(a)). Due to the high temperatures and no rivers flow into the Gulf, no significant increase in the water salinity of the gulf area from the entrance of the Gulf in the south (39.24 ppt) towards the North (39.81 ppt) revealing a water mass with salinity > 39 ppt and occupying the whole Gulf area (Figure 2(a)). Moreover, seasonal variations showed no differences between winter (39.47 ppt) and summer values (39.92 ppt) of salinity (Figure 2(b)). pH values displayed no clear regional variations. It fluctuated between 8.14 at AQ 03 in March, 2011 and 8.30 at AQ 01 in August, 2013 with an average value of 8.24. The relatively observed high average value was mainly attributed to the photosynthetic activity and long light span and was accompanied by an increase in dissolved oxygen [26] [38] [64] .
Table 4. Ranges and averages ± standard division of the hydrographic parameters of the coastal water of Aqaba Gulf during 2011-2013.
 (a)
(a)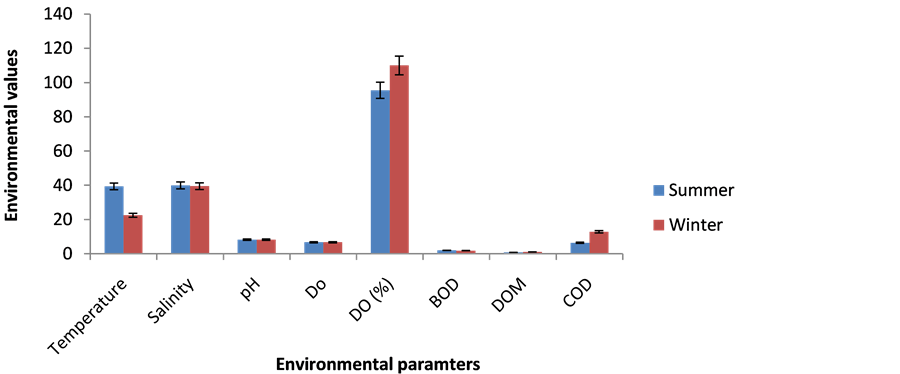 (b)
(b)
Figure 2. (a) Regional Variations of temperature (˚C), salinity (ppt) pH, DO (mg/l), DOM (mg O2/l), BOD (mg/l), and COD (mg/l) of the Aqaba Gulf coastal waters; (b) Seasonal Variations of temperature (˚C), salinity (ppt), pH, DO (mg/l), DOM (mg O2/l), BOD (mg/l), and COD (mg/l) of the Aqaba Gulf coastal waters.
Moreover, no obvious regional variations in the pH values were observed between different stations (Figure 2(a)) which is mainly associated with water temperature, dissolved oxygen, organic matter, chlorophyll-a etc. [1] [13] [19] [63] . In addition, pH showed more or less comparable values in summer season (8.20) and winter season (8.19) reflecting no seasonal variations (Figure 2(b)). The general distribution of DO revealed high values and presence of well oxygenated waters in the investigated area. It ranged from 5.12 mg/l (72.85%) at AQ 03 in August, 2011 and 9.84 mg/l (140%) at AQ 06 in March, 2011 with a spatial average 7.70 mg/l (109.56%). No significant regional and seasonal variations were observed in the distribution of dissolved oxygen (Figure 2(a) & Figure 2(b)). On the meantime, BOD fluctuated between 0.40 at AQ 01 in May, 2013 and 10.72 mg/l at AQ 06 in May, 2013 with a spatial average of 1.80 mg/l. Irregular regional distribution of BOD was observed (Figure 2(a)). Among all stations, AQ 02 (2.15 mg/l) and AQ 04 (2.17 mg/l) attained the high average values; while station AQ 03 exhibited the lowest (0.89 mg/l) average value. Slightly higher BOD values was observed during summer season (1.99 mg/l) compared to their values (1.80 mg/l) in winter season (Figure 2(b)). On the meantime, DOM and COD showed higher values in summer season (1.06 and 12.81 mg/l) compared to their corresponding values (0.79 and 6.39 mg/l) in winter season (Figure 2(b)). Except for station (AQ 06), minor changes in these variables between different locations (Figure 2(a)) revealed that the effects of human impacts on the distribution pattern of DOM and COD of the Aqaba Gulf coastal waters are still limited. Station (AQ 06) exhibited high average values of DOM (1.35 mg/l) and COD (10.35 mg/l) most probably due to relatively high population, especially in the summer season [18] [19] [25] .
3.3. Chlorophyll-a, TSM, Transparency, and Nutrient Salts
3.3.1. Chlorophyll-a, TSM and Transparency
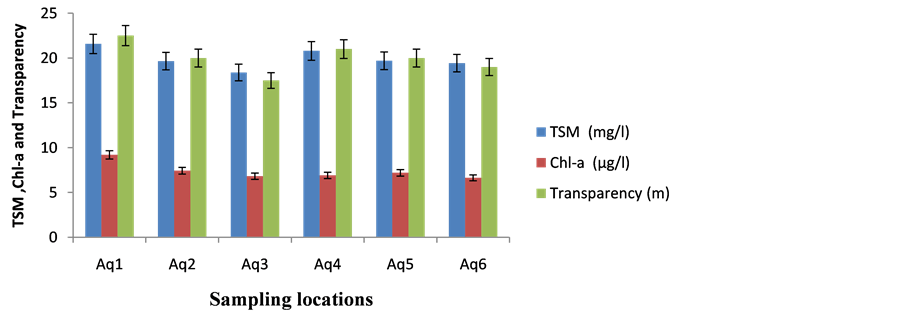
Ranges and regional average values of Chl-a, TSM and Secchi Disk depth are reported in Table 5. In general, low Chl-a and TSM concentrations and relatively high transparency were generally encountered at most stations revealing that the effect of human impacts in on the Aqaba Gulf coastal waters is still not significant [18] [19] [22] [25] [27] [65] . The levels of Chl-a were fluctuated between 0.014 μg/l at AQ 05 in August, 2012 to 2.38 μg/l at AQ 06 in May, 2012 with a spatial average of 0.40 μg/l. Total suspended matter ranged from 12.09 mg/l at AQ 01 in March, 2011 to 31.98 mg/l at AQ 05 in May, 2013 with a spatial average of 16.53 mg/l. Secchi disk transparency, on the other hand, ranged from 5.40 m at AQ 02 in March, 2011 to 12.00 m at AQ 06 in July and September, 2011 indicating the very limited impacts of human impacts due to the low population in the region, and the limitation of land-based sources, i.e., sewage, agriculture and/or industrial effluents [18] [19] [25] . Irregular regional distributions (Figure 3(a)) of total suspended matter, secchi disk transparency and chlorophyll-a were observed. The present study indicted higher total suspended matter (21.57 mg/l) at AQ 01, secchi disk transparency (12.0 m) at AQ 06, and chlorophyll-a (0.55 μg g/l) at AQ 03. On contrast, the lower values were (18.39 mg/l) at AQ 03, (6.0 m) at AQ 01 & AQ
Table 5. Ranges and averages ± standard division of the nutrients of the coastal water of Aqaba Gulf during 2011-2013.
02, and (0.0.26 μg∙g/l) at AQ 02; respectively. Seasonal variations cleared out that higher total suspended matter (22.03 mg/l) in summer than in winter (17.20 mg/l) which is mainly related to the increase in the number of visitors and aquatic tourism during summer season (Figure 3(b)). Worth mentioning that TSM values were lower than the maximum permissible limit of the Egyptian law 4\94 that TSM 25 mg/l. On contrast, higher values of chlorophyll-a (0.50 μg/l) were observed in winter season compared to their corresponding values (0.40 μg/l) in summer season (Figure 3(b)). The relatively high values of chlorophyll-a, especially in the winter season are due to the higher values of oxygen saturation percentages (110%), total nitrogen (911.6 μg/l), reactive silicate (76.3 μg/l) and reactive phosphate (7.75 μg/l). These nutrient salts contribute for the growth of phytoplankton expressed in high levels of Chl-a [19] [27] [38] [66] . Secchi Disk transparency exhibited more or less comparable values during summer (8.0 m) and winter (8.12 m) seasons.
3.3.2. Nutrient Salts
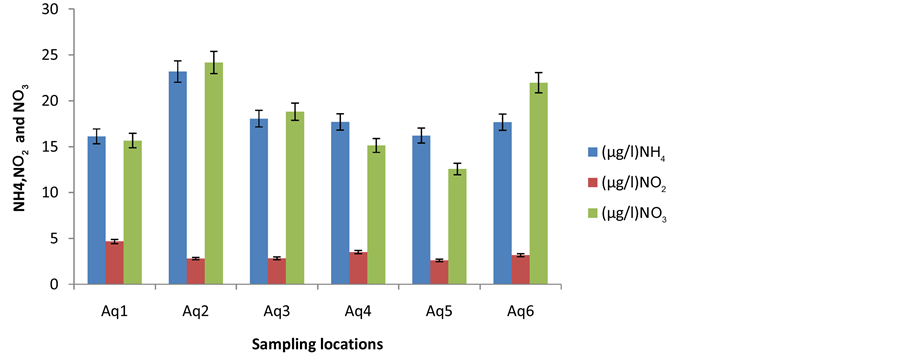
Ranges as well as regional average values of different nutrients are listed in Table 5. The results indicated that dissolved inorganic nitrogen concentrations were relatively low. Over most of the basin, Gulf of Aqaba surface waters are exceptionally clear and low in nutrients because the hot, and arid climate. On the meantime, there is little nutrient input from soil, agriculture and pollution on land. It also creates a permanent surface layer of warm, nutrient-poor water, which does not mix with nutrient-rich deeper water in a process called stratification [67] [68] . They ranged from 3.72 μg/l NH4-N at AQ 05 & AQ 06 to 92.95 μg/l NH4-N at AQ 02 for ammonium; 0.36 μg/l /l NO2-N at AQ 05 to 26.89 μg/l /l NO2-N at AQ 01 for nitrite; from 2.49 μg/l /l NO3-N at AQ 0 to 97.67 μg/l NO3-N at AQ 0 for nitrate and from 20.16 to 2878.40 μg/l N at AQ 0 and AQ 0, respectively for total nitrogen. In general, dissolved inorganic nitrogen constituted
 (a)
(a)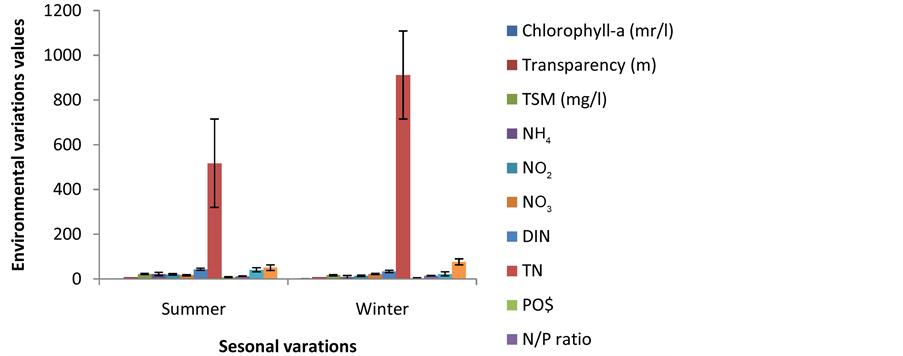 (b)
(b)
Figure 3. (a) Regional variations of chlorophyll-a, transparency, TSM, and nutrient salts of the Aqaba gulf coastal waters; (b) Seasonal variations of chlorophyll-a, transparency, TSM, and nutrient salts of the Aqaba gulf coastal waters.
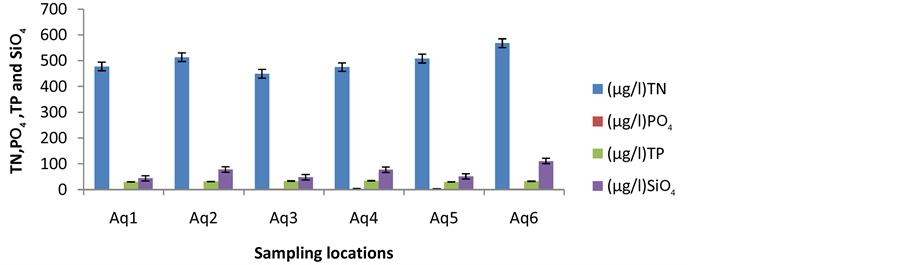
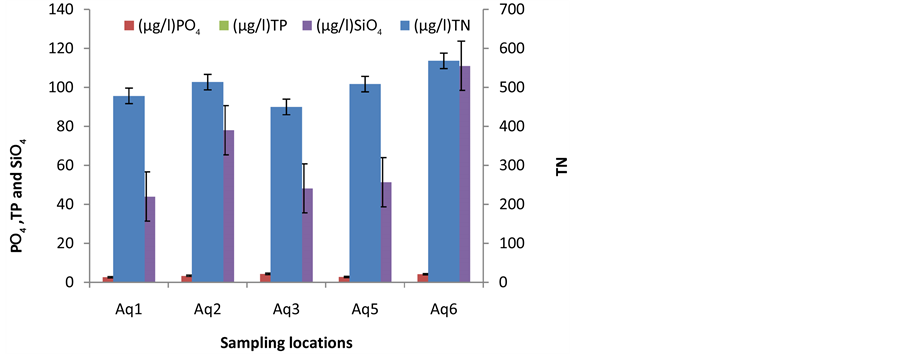
7.92% of the TN in the investigated area revealing that the majority of TN content were in the form of organic-N which constituted more than 92% of TN. Based on the mean annual values, the concentrations of dissolved inorganic nitrogen forms followed the following order: NH4 = NO3 ≥ NO2. [69] [70] reported that seawater with concentrations of 7.0 μg/l for each NH4 and NO3 is classified as oligotrophic. Whereas, in eutrophic waters the concentration of these nutrients are usually in order of 28.0 μg/l for NH4 and 56.0 μg/l for NO3. According to their classification, Aqaba Gulf sea coastal waters are classified as oligotrophic to mesotrophic state. On the meantime, PO4, ranged from ND μg/l PO4-P at AQ 01 & AQ 03 to 28.63 μg/l PO4-P at AQ 06, with an average value of 3.47 μg/l (Figure 3(a)). TP ranged from 9.29 μg/l PO4-P at AQ 06 to 65.13 μg/l P at AQ 0, with an average value of 31.91μg/l. An increase of PO4 concentration of 4.31 & 4.16 μg/l PO4-P were observed at stations AQ03 & AQ 06; respectively compared to other stations (Figure 3(a)). The high phosphorus concentrations at AQ 03 & AQ 06 were accompanied with increase in ammonia, nitrite and nitrate concentrations and were most probably due to allochthonous effluents enriched with phosphate from the main shipping. On contrast, the relatively low PO4 concentrations at other stations could be mostly related to their short life cycle, sorption and deposition on iron born dust conveyed to the basin from the surrounding deserts. [71] reported the effect of composition and physicochemical characteristics of natural particles on phosphate adsorption-desorption processes under various aquatic environment. The typical concentrations for eutrophic coastal waters are above 4.65 μg/l and for highly eutrophic system will be beyond9.3 μg/l [70] . Accordingly the obtained results are consistent with the oligotrophic characteristics of the Aqaba Gulf coastal waters [35] . The geographic and temporal distribution pattern of SiO4 displayed a large variability during the investigation period. They fluctuated between 18.98 μg/l SiO4 at station AQ 05 and 441.78 μg/l SiO4 at AQ 06, with an average value of 68.36 μg/l SiO4 (Figure 3(a)). A remarkable increase in SiO4 concentration (111.01 μg/l SiO4) was observed at AQ 06 of Aqaba Gulf coastal water which most probably due to the organic matter decomposition and the partial dissolution of quartz particle transported to the sea from the surrounding desert during sand storms. The cycles of the key nutrient elements nitrogen (N) and phosphorus (P) have been massively altered by anthropogenic activities [72] . In coastal marine systems, nitrogen has historically been considered to be the predominant limiting nutrient [73] . However, sequestration of P in calcareous sediments is thought to drive P limitation in the tropics [74] , while constraints on planktonic N-fixation caused by insufficient light [75] or trace metal supply [76] [77] are thought to influence the predominance of N or P limitation offshore. In order to understand weather the phytoplankton growth in the coastal waters of the Aqaba Gulf is, or is not, limited by N or P, The DIN/P ratio has been calculated. In the present study, DIN/DIP ratio regional average value of (16.6:1) for Aqaba Gulf coastal waters. This N/P ratio for the Aqaba Gulf agrees well with the stoichiometric ratio of Redfield (N:P = 16:1) revealing that this proportion agrees with those actually found in various members of the plankton community [78] . Seasonal variations (Figure 3(b)) showed average concentrations of ammonia (22.65 μg/l), nitrite (20.35 μg/l), phosphate (7.75 μg/l), and total phosphorus (41.2 μg/l) which were significantly higher in summer compared to their corresponding values (8.4, 14.0, 3.15, 22.8 μg/l; respectively) in winter. On contrast, seasonal distributions of nitrate (22.3 μg/l), TN (911.6 μg/l), and SiO4 (76.3 μg/l) exhibited significantly higher values in winter compared to their corresponding values (16.90, 517.2, 50.4 μg/l) in summer. In general, the majority of TN in winter was in the form of organic-N (96.3%) compared to 91.7% in summer season. On the meantime, TP exhibited more or less comparable organic-P percentage in summer (86.2%) and winter (81.2%) seasons. Moreover, the DIN/ DIP ratio showed relatively higher values in winter season (14.2:1) compared to summer season (12.4:1). This indicates high nitrogen concentrations in comparison with that of phosphorous in winter, yet it reflects the generally lower nutrient levels present in the coastal waters of the Aqaba Gulf due to the lack of significant nutrient input or oceanic upwelling [34] .
3.4. Heavy Metals
Within rapid industrialization and economic development in coastal areas around the world heavy metals are introduced to the coastal environment [3] [6] [66] [79] - [81] . Heavy metals are one of the most common pollutants which have severely deteriorated the aquatic ecosystems and can be hazardous to the local population which uses the coast area for fishing and recreation activities [3] [6] [15] [66] due to the toxicity, abundance, persistence, and subsequent bio-accumulation. Their release in aquatic ecosystem is triggered by both natural and anthropogenic processes [82] - [85] . Because of the non-degradability of heavy metals, toxic effects are often observed at points far away from the sources [86] . Variations of dissolved metal concentrations, i.e. Fe, Zn, Mn, Ni, Cu, Cr, Cd, Pb, and Hg in sea water samples from the investigated area revealed quite low concentrations (Table 6). The results of the present study indicated
Table 6. Range, averages ± standard division of the metals and Petroleum hydrocarbons of the coastal water of Aqaba Gulf during 2011-2013.
that concentrations of dissolved metals were in the order: Fe (34.11 μg/l)  Zn (14.19 μg/l)
  Cu (3.44 μg/l) > Pb (3.59 μg/l) > Mn (2.24 μg/l) > Ni (1.61 μg/l) > Cr (1.10 μg/l) > Cd (0.49 μg/l)
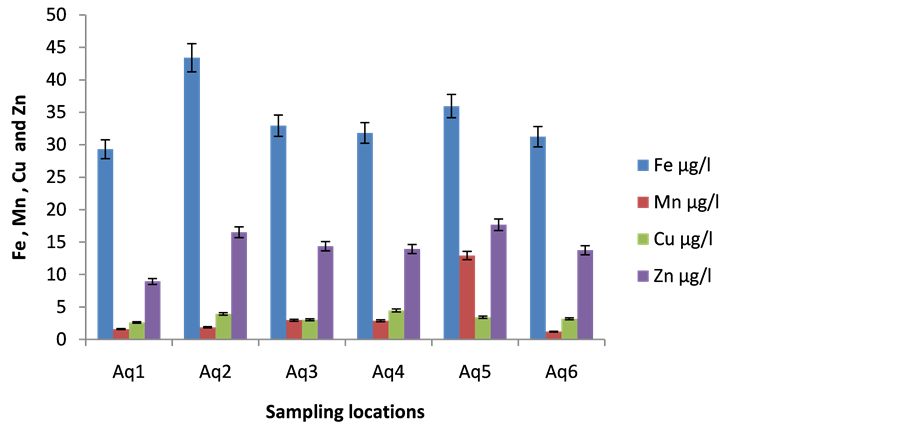
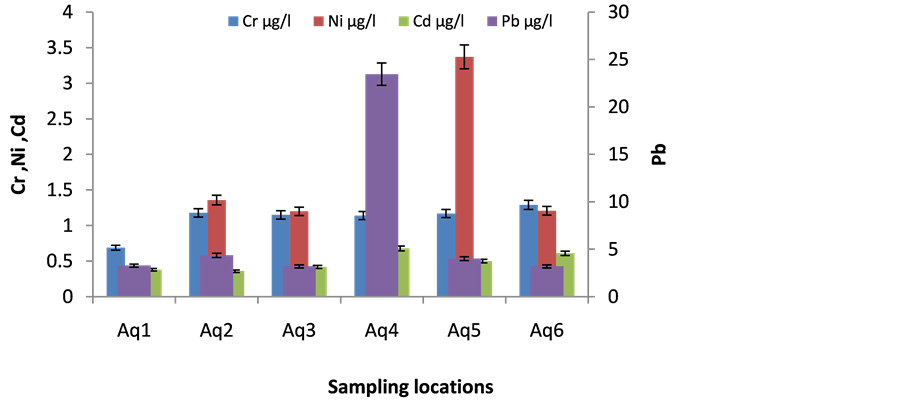
  Hg (0.05 μg/l). Generally, the concentrations of the examined metals were more or less comparable to the previously published papers and indicated lack of riverine input, the absence of major local impacts of any land-based sources and/or any major negative impacts of coastal tourism in the investigated area [18] [19] [25] [27] [79] . Although, station AQ 01 attained the lowest concentrations of Fe (29.31 μg/l), Cu (2.62 μg/l), Zn (8.94 μg/l), Cr (0.69 μg/l), Ni (1.18 μg/l), and Hg (0.07 μg/l), and AQ 06 was characterized by its highest concentrations of Cr (1.29 μg/l), and Hg (0.06 μg/l), irregular regional variations were observed in the distribution patterns of most metals (Figure 4(a)). Seasonal variations, on the other hand, showed higher concentrations for Fe (40.84 μg/l), Mn (3.18 μg/l), Zn (15.55 μg/l), Cr (1.19 μg/l), Cd (0.82 μg/l), Pb (3.50 μg/l), and Hg (0.065 μg/l) in winter season compared to their corresponding values (34.42, 2.27, 11.56, 1.06, 0.32, 3.40, and 0.05 μg/l) in summer season (Figure 4(b)). The higher concentrations in winter season are most probably related to impacts of any land-based sources in the investigated area. On contrast, Cu (4.72 μg/l), and Ni (1.82 μg/l) exhibited higher concentrations in summer season than their values (2.82 and 1.82; respectively) in winter season (Figure 4(b)). The higher concentrations of Cu and Ni during summer season may be due to negative impacts of coastal tourism. The present study revealed that all water samples had acceptable metals concentrations.
3.5. Petroleum Hydrocarbons
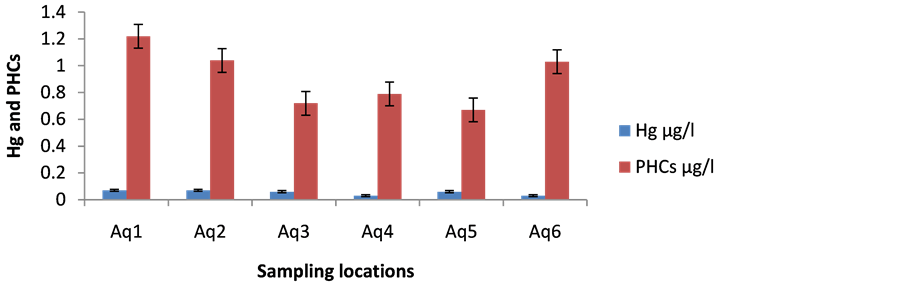
Total petroleum hydrocarbons in the investigated area ranged from 0.18 µg/l at AQ 01 and 5.50 µg/l at AQ 01, with an average of 0.91µg/l (Table 6). Among all studied locations, AQ 01 at Ras Mohamed area exhibited the maximum average concentration (1.22 µg/l) of petroleum hydrocarbons. AQ 05 at Neweiba Harbor El Saiadin area showed the minimum average one (0.67 µg/l). The coastal waters at AQ 01 (Ras Mohamed), AQ 02 (Sharm El-Sheih Harbor), and AQ 06 (Table 6) areas were much suffered from oil pollution compared to the other areas (Figure 4(a)) which is mainly due to accidental,
 (a)
(a)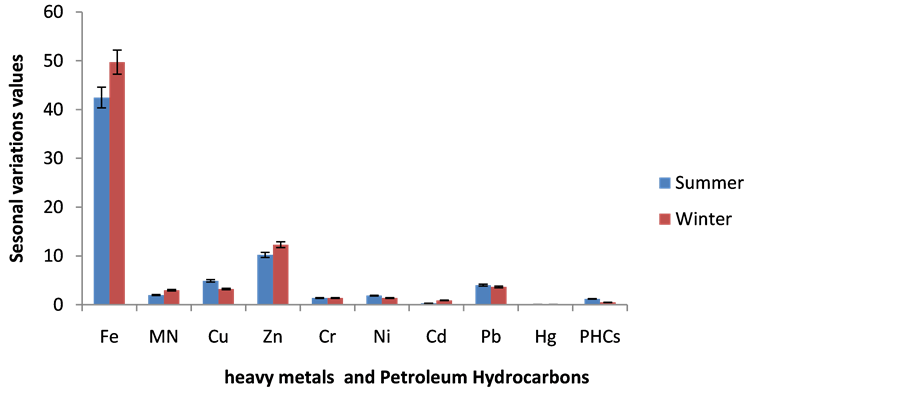 (b)
(b)
Figure 4. (a) Regional variations of heavy metals and petroleum hydrocarbons of the Aqaba Gulf coastal waters; (b) Seasonal variations of heavy metals and petroleum hydrocarbons of the Aqaba Gulf coastal waters.
deliberate or operational discharges and spills of oil from ships [2] - [5] [7] [8] . Furthermore, seasonal variations showed concentrations of petroleum hydrocarbons ranging from 0.18 to 1.07 μg/l, with an average value of 0.50 μg/l which were significantly lower in winter compared to their corresponding values (0.41 - 6.31 μg/l, av. 1.20 μg/l) in summer (Figure 4(b)). The higher concentrations of petroleum hydrocarbons in summer are mainly attributed to the increase in the levels of oil pollution that most probably resulted from an increase in accidental, deliberate or operational discharges and spills of oil from ships [2] - [5] [7] [8] . In general, the maximum concentration was much lower than the harmful concentrations reported for seawater. On the other hand, the reported concentrations are very far below the accepted level given by EEAA of Egypt and that recorded by the International level of 500 µg/l.
3.6. Statistical Analysis
3.6.1. Correlation Analysis
Pearson correlation matrix was studied on the present data for all investigated environmental parameters (26 parameters) during the study period (n = 72, p ≤ 0.05). The correlation analysis confirmed the significant interrelation among studied parameters (Table 7). It was showed that, water temperature represents a positive significant correlation with each of  (0.40),
  (0.32),
  (0.35) and a negative significant correlation with each of DO (−0.25), chl-a (−0.33), as well as a positive significant correlation between Chl-a and DO (0.26). The correlations among the nutrients illustrated that there was a positive significant correlation between TN and each of
  (0.50),
  (0.26), SiO4 (0.28) and TSM (0.55). Also, a positive significant correlation between TP and
  (0.67) as well as, between SiO4 and each of
  (0.25) and
  (0.45). The positive correlations among the nutrients may mean that, there are all
Table 7. Pearson correlation matrix on the present data for all investigated environmental parameters (26 parameters) during the study period (n = 96, p ≤ 0.05).
have the same source. It was observed that, there are strong relationships among the metals in the coastal water of Aqaba Gulf during the present study. There is a positive significant correlation between Fe and each of Mn (0.24), Cr (0.39) and Hg (0.27), and a positive significant correlation between Mn and each of Cu (0.24), Zn (0.40), Ni (0.44), Cd (0.38) and Hg (0.51). PHC was showed a negative significant correlation with each of OM (−0.26),  (−0.24), Chl-a (−0.28) and a positive significant correlation with each of
  (0.62), DO (0.23) and Cr (0.27). Metals give a negative significant correlation with each of nitrogen and phosphorus forms, TP was negative correlated with each of Zn (−0.27) and Pb (−0.29).
  was negative correlated with each of Fe (−0.26) and Cr (−0.24).
  was negative correlated with each of Cd (−0.38), Mn (−0.25) and significant positive correlated with Pb (0.58). A positive significant correlation between SiO4 and Zn (0.26) was deduced. The relationships between PHC and metals were weak except for a positive significant correlation with Cr (0.27). It was noticed that, PHC was strongly correlated with each of
  (0.62),
  (−0.24), OM (−0.31) and water temperature (0.23).
3.6.2. Principal Component Analysis (PCA)
PCA is an application for assessment of water pollution. PCA is a multivariate statistical technique employed to reduce the dimensionality of dataset while attempting to preserve the relationships present in the original data. The Eigen values were computed for the standardized data using specialized statistical software package (SPSS version 16). PCA is applied for multivariate data derived from the water analysis of 72 coastal water samples of Aqaba Gulf using 26 variables: water temperature, salinity, pH, DO, BOD, OM, COD, Chl-a, TSM,  ,
,  ,
,  , TN,
, TN,  , TP, SiO4, Fe, Mn, Ni, Zn, Cd, Cr, Pb, Cu, Hg and PHC. The output data revealed that ten factors (PC1-PC10) affected parameters distributions, association and sources, with cumulative covariance of 78.53%. Varimax rotation components matrix is given in Table 8 to give an overview on the nature of loading among the parameters.
PC1 represented loading for water temperature 0.39, salinity 0.42, Chl-a −0.49, OM −0.42, Pb 0.70 and positive high loading for  0.86 and PHC 0.76. PC2 represented
positive loading for metals: Mn 0.74, Zn 0.55, Ni 0.75 and Hg 0.70. PC3 represented high positive loading for TSM 0.84,  0.74 and TN 0.75. PC4 represented loading for BOD 0.75, OM 0.50 Zn 0.47 and high positive loading for SiO4 0.86. PC5 represented loading for OM 0.38 and high positive loading for
  0.83 and TP 0.90. PC6 represented loading for COD 0.66 and Cr 0.84. PC7 represented high positive loading for DO 0.83 and Ni 0.80. PC8 represented high positive loading for COD 0.88 and high negative loading for
  −0.74. PC9 represented loading for water temperature 0.52, Cu 0.77 and Chl-a −0.43. PC10 represented negative loading for salinity −0.44, pH −0.80 and positive loading for Hg 0.44.
Statistical analysis of the results for different investigated parameters revealed that there are several commutative and correlative relations between several physicochemical parameters, nutrient salts, heavy metals and petroleum hydrocarbons.
3.7. Conclusions and Recommendations
This study provides data to make baseline information’s on the anthropogenic impacts and natural inputs related to oceanographic characteristics of sea water of the Aqaba Gulf marine environment. The most important conclusions of the present study can be summarized as follows:
Table 8. Varimax rotated component matrix.
1) Except for the area of Sharm El-Sheikh Harbor, the results of respective years and annual average monitoring for the density, composition, and distributions at different stations cleared out that the Egyptian shoreline of the Aqaba Gulf is relatively not affected by man-made litter.
2) No significant variations for each of salinity and pH values.
3) The concentrations of pollution indicators such as BOD, DOM and COD are low.
4) Based on the annual average of the three years, low Chl-a and TSM concentrations and high transparency were generally encountered at the coastal water of the Aqaba Gulf.
5) Low levels for each of Chl-a, TSM, nitrogen, phosphorus and reactive silicate were deduced. Accordingly, it can be classified between oligotrophic to mesotrophic state.
6) The levels of heavy metals displayed remarkable variations during the three years and still under the permissible levels for all elements.
7) The concentration of petroleum hydrocarbons was much lower than the harmful concentrations reported for seawater and are very far below the accepted level given by EEAA of Egypt and that recorded by the International level of 500 µg/l.
8) Therefore, it is safe to conclude that, the main body of the Aqaba Gulf coastal regions of Egypt is not yet seriously threatened in spite of recently rapid recreational and human development taken place on its coast.
9) There are several commutative and correlative relations between physicochemical parameters, nutrient salts, heavy metals and petroleum hydrocarbons.
Cite this paper
Abdel-Halim, A.M., Aly-Eldeen, M.A., Fattah, L.M.A., Fahmy, M.A., Abo-El-Khair, E.M., Khaled, A.M., El-Soud, A.A. and Shreadah, M.A. (2016) Environmental Studies on the Aqaba Gulf Coastal Waters during 2011-2013. Journal of Environmental Protection, 7, 1411-1437. http://dx.doi.org/10.4236/jep.2016.710121
References
- 1. Wahby, S.D. and Shriadah, M.A. (1984) The Effect of Sewage Discharge on Some Chemical Characteristics of Seawater. VII Journees Etud Pollutions, Lvcerene, CIESM, 81-90.
- 2. Shriadah, M.A. (1998) Impacts of an Oil Spill on the Marine Environment of the United Arab Emirates along the Gulf of Oman. Marine Pollution Bulletin, 36, 876-879.
http://dx.doi.org/10.1016/S0025-326X(98)00055-1 - 3. Shriadah, M.A. (1998) Metals Pollution in Marine Sediments of the United Arab Emirates Creeks along the Arabian Gulf Shoreline. Bulletin of Environmental Contamination and Toxicology, 60, 417-424.
http://dx.doi.org/10.1007/s001289900642 - 4. Shriadah, M.A. (1999) Oil Contamination along Oil Tanker Routes off the United Arab Emirates (The Arabian Gulf and The Gulf of Oman). Bulletin of Environmental Contamination and Toxicology, 63, 203-210.
http://dx.doi.org/10.1007/s001289900967 - 5. Shriadah, M.A. (1999) Petroleum Hydrocarbons along the Arabian Gulf Coast of the United Arab Emirates. Indian Journal of Marine Science, 28, 10-16.
- 6. Shriadah, M.A. (1999) Occurrence of Trace Metals in the Arabian Gulf and the Gulf of Oman Sediments off the United Arab Emirates. Oebailla, 25, 43-52.
- 7. Shriadah, M.A. (2000) Chemistry of the Mangrove Waters and Sediments along the Arabian Gulf Shoreline of the United Arab Emirates. Indian Journal of Marine Sciences, 29, 224-229.
- 8. Shriadah, M.A. (2000) Contamination by Petroleum Hydrocarbons in Two Semi-Enclosed Areas along the Arabian Gulf Coast of the United Arab Emirates. Oebailla, 26, 49-62.
- 9. Shriadah, M.A. (2000) Levels and Distributions of Petroleum Hydrocarbons in the Coastal Waters and Sediments of the United Arab Emirates in the Arabian Gulf and the Gulf of Oman. Water, Air, and Soil Pollution, 119, 247-256.
http://dx.doi.org/10.1023/A:1005192523876 - 10. Pekey, H., Karakas, D., Ayberk, S., Tolum, L. and Bakoglu, M. (2004) Ecological Risk Assessment Using Trace Elements from Surface Sediments of Izmir Bay (Northeastern Marmara Sea) Turkey. Marine Pollution Bulletin, 48, 946-953.
http://dx.doi.org/10.1016/j.marpolbul.2003.11.023 - 11. Abrahim, G.M.S. and Parker, R.J. (2008) Assessment of Heavy Metal Enrichment Factors and the Degree of Contamination in Marine Sediments from Tamaki Estuary, Auckland, New Zealand. Environmental Monitoring and Assessment, 136, 227-238.
http://dx.doi.org/10.1007/s10661-007-9678-2 - 12. Hamed, M.A., Mohamedein, L.I., El-Sawy, M.A. and El-Moselhy, Kh.M. (2013) Mercury and Tin Contents in Water and Sediments along the Mediterranean Shoreline of Egypt. Egyptian Journal of Aquatic Research, 39, 75-81.
http://dx.doi.org/10.1016/j.ejar.2013.06.001 - 13. Shreadah, M.A., Masoud, M.S., Khattab, A.M. and El Zokm, G. (2014) Impacts of Different Drains on the Seawater Quality of El-Mex Bay (Alexandria, Egypt). Journal of Ecology and the Natural Environment, 8, 287-303.
- 14. Seshan, B.R.R., Natesan, U. and Deepthi, K. (2010) Geochemical and Statistical Approach for Evaluation of Heavy Metal Pollution in Core Sediments in Southeast Coast of India. International Journal of Environmental Science and Technology, 7, 291-306.
http://dx.doi.org/10.1007/BF03326139 - 15. Ali, Z., Malik, R.N. and Qadir, A. (2013) Heavy Metals Distribution and Risk Assessment in Soils Affected by Tannery Effluents. Chemistry and Ecology, 29, 676-692.
http://dx.doi.org/10.1080/02757540.2013.810728 - 16. Abdel Ghani, S.A., Shobier, A.H. and Shreadah, M.A. (2013) Assessment of Arsenic and Vanadium Pollution in Surface Sediments of the Egyptian Mediterranean Coast. Journal of Environmental Technology and Management, 16, 82-101.
- 17. Abdel Salam, S., El Zokm, G., Shobier, A., Othman, T. and Shreadah, M.A. (2013) Metal Pollution in Surface Sediments of Abu Qir Bay and the Eastern Harbour of Alexandria, Egypt. Egyptian Journal of Aquatic Research, 39, 1-12.
http://dx.doi.org/10.1016/j.ejar.2013.03.001 - 18. Okbah, M.A., Shata, M.A. and Shriadah, M.A. (2005) Gochemical Forms of Trace Metals in Mangrove Sediments—Red Sea (Egypt). Chemistry and Ecology, 21, 23-36.
http://dx.doi.org/10.1080/02757540512331323953 - 19. Abo-El Khair, E.M., Abdel Halim, A.M., Fahmy, M.A. and Shreadah, M.A. (2008) Environmental Impact Assessment of Northern Red Sea Regions during 2005-2007. Egyptian Journal of Aquatic Research, 34, 20-30.
- 20. Shreadah, M.A., Said, T.O., El Zokm, G. and Masoud, M.S. (2008) Physico-Chemical Characteristics of the Surficial Sediments along the Egyptian Red Sea Coasts. Egyptian Journal of Aquatic Research, 34, 16-34.
- 21. Shreadah, M.A., Masoud, M.S., Said, T.O. and El Zokm, G. (2008) Application of IR, X-Ray, TGA and DTA to Determine the Mineral Composition of the Sediments and Study of Reaction Kinetics along the Egyptian Red Sea Coasts. Egyptian Journal of Aquatic Research, 34, 83-95.
- 22. Gurguess, S.M., Shreadah, M.A., Fahmy, M.A., Aboul El Kheir, E.M. and Abdel Halim, A.M. (2009) Assessment of Water Quality in the Red Sea Using in Situ Measurements and Remote Sensing Data. Egyptian Journal of Aquatic Research, 35, 1-13.
- 23. Masoud, M.S., Said, T.O., El-Zokm, G. and Shreadah, M.A. (2012) Assessment of Heavy Metals Contamination in Surface Sediments of the Egyptian Red Sea Coasts. Australian Journal of Basic and Applied Sciences, 6, 44-58.
- 24. Aboul-Ela, H.M., Shreadah, M.A., Abdel-Monem, N.M., Yakout, G.A. and Van Soest, R.W.M. (2012) Isolation, Cytotoxic Activity and Phylogenetic Analysis of Bacillus sp. Bacteria Associated with the Red Sea Sponge Amphimedon ochracea. Advances in Bioscience and Biotechnology, 3, 815-823.
http://dx.doi.org/10.4236/abb.2012.37101 - 25. Shriadah, M.A., Okbah, M.A. and El-Deek, M.S. (2004) Trace Metals in the Water Columns of the Red Sea and the Gulf of Aqaba, Egypt. Water, Air, and Soil Pollution, 153, 115-124.
http://dx.doi.org/10.1023/B:WATE.0000019938.57041.21 - 26. Fahmy, M.A., Shriadah, M.A., Abul-Soud, A., Abdel Rahman, S.M. and Shindy, M. (2005) Hydrography and Chemical Characteristics of the Coastal Water along the Gulf of Suez. Egyptian Journal of Aquatic Research, 31, 1-14.
- 27. Abo-El-Khair, E.M., Abdel Halim, A.M., Shriadah, M.A. and Fahmy, M.A. (2007) Environmental Conditions of the Suez Gulf and the Red Sea Coastal Waters, Egypt. Proceedings of the 8th International Conference on the Mediterranean Coastal Environment, Alexandria, Egypt, 13-17 November 2007, 517-526.
- 28. Masoud, M.S., Said, T.O., El-Zokm, G. and Shreadah, M.A. (2010) Speciation of Fe, Mn and Zn in Surficial Sediments from the Egyptian Red Sea Coasts. Chemical Speciation and Biodiversity, 22, 257-269.
http://dx.doi.org/10.3184/095422910X12894975123773 - 29. Said, T.O., Shreadah, M.A., Abdel Ghani, S.A. and Ahmed, A.M. (2010) Alkyltin and Alkayllead Compounds in Coastal Water of Suez Gulf, Egypt. Egyptian Journal of Aquatic Research, 36, 33-42.
- 30. Shreadah, M.A., Said, T.O., Abdel Ghani, S.A. and Ahmed, A.M. (2011) Distribution of Different Organotin and Organolead Compounds in Sediment of Suez Gulf. Journal of Environmental Protection, 2, 545-554.
http://dx.doi.org/10.4236/jep.2011.25063 - 31. Maroof, A.K. and Kochzius, M. (2001) Community Structure and Biogeography of Shore Fishes in the Gulf of Aqaba, Red Sea. Helgoland Marine Research, 55, 252-284.
- 32. Dubinsky, Z. and Stambler, N. (1996) Marine Pollution and Coral Reefs. Global Change Biology, 2, 511-526.
http://dx.doi.org/10.1111/j.1365-2486.1996.tb00064.x - 33. Maillard, C. and Soliman, G. (1986) Hydrography of the Red Sea and Exchanges with the Indian Ocean in Summer. Oceanologia Acta, 9, 249-269.
- 34. Gerges, M.A. (2002) The Red Sea and Gulf of Aden Action Plan—Facing the Challenges of an Ocean Gateway. Ocean & Coastal Management, 45, 885-903.
http://dx.doi.org/10.1016/S0964-5691(02)00112-6 - 35. Kalmar, N.M. (2005) The Red Sea and the Gulf of Aden. Global International Waters Assessment (GIWA), Sub-regions Vol. 48-49, 135.
- 36. Abu-Hilal, A. and Al-Najar, T. (2004) Litter Pollution on the Jordanian Shores of the Gulf of Aqaba (Red Sea). Marine Environmental Research, 58, 39-63.
http://dx.doi.org/10.1016/j.marenvres.2003.12.003 - 37. Abu-Hilal, A. and Al-Najar, T. (2009) Marine Litter in Coral Reef Areas along the Jordan Gulf of Aqaba, Red Sea. Journal of Environmental Management, 90, 1043-1049.
http://dx.doi.org/10.1016/j.jenvman.2008.03.014 - 38. Abdel-Halim, M., Aboel-Khair, E.M., Fahmy, M.A. and Shreadah, M.A. (2007) Environmental Assessment on the Aqaba Gulf Coastal waters, Egypt. Egyptian Journal of Aquatic Research, 33, 1-14.
- 39. Al-Najar, T., Rasheed, M., Ababneh, Z., Abaneh, A. and Al-Omary, H. (2011) Heavy Metals Pollution in Sediment Cores from the Gulf of Aqaba, Red Sea. Natural Science, 3, 775-782.
http://dx.doi.org/10.4236/ns.2011.39102 - 40. Irrigation Support Project for Asia and the Near East (ISPAN) (1992) Gulf of Aqaba Environmental Data Survey. A Scientific Report Submitted to U.S. Agency for International Development, 1-263.
- 41. Regional Environmental Management Improvement Project (REMIP) (2008) State of Oil Pollution and Management in Suez Gulf Region. A Scientific Repot by Japan International Cooperation Agency (JICA) and Egyptian Environmental Affairs (EEAA), Technologies of Oil Fingerprint Analysis, Chapter 7, 1-133.
- 42. APHA (1995) Standard Methods for the Examination of Water and Wastewater. 19th Edition, American Public Health Association, Inc., New York.
- 43. Calberg, S.R. (1972) New Baltic Manual International Council for the Exploration of the Sea. Cooperative Research Report Copenhagen. Series A. N., 29.
- 44. Strickland, J.D.H. and Parsons, T.R. (1972) A Practical Handbook of Seawater Analysis. 2nd Edition, Fisheries Research Board of Canada Bulletin, No. 167, Fisheries Research Board of Canada, 310.
- 45. Intergovernmental Oceanographic Commission (IOC) (1983) Chemical Methods for Use in Marine Environmental Monitoring. Manuals and Guides, UNESCO, 53 p.
- 46. Valderrama, J.C. (1981) The Simultaneous Analysis of Total Nitrogen Total Phosphorus in Natural Waters. Marine Chemistry, 10, 109-122.
http://dx.doi.org/10.1016/0304-4203(81)90027-X - 47. Riley, J.P. and Taylor, D. (1968) Chelating Resins for the Concentration of Trace Elements from Sea Water and Their Analytical Use in Conjunction with Atomic Absorption Spectrophotometry. Analytica Chimica Acta, 40, 479-485.
http://dx.doi.org/10.1016/S0003-2670(00)86764-1 - 48. Abdullah, M.I. and Royle, L.G. (1974) A Study of the Dissolved and Particulate Trace Elements in the Bristol Channel. Journal of the Marine Biological Association of the United Kingdom, 54, 581-597.
http://dx.doi.org/10.1017/S0025315400022761 - 49. Parsons, T.R., Maita, Y. and Malli, G.M. (1985) Determination of Petroleum Hydrocarbons. In: A Manual of Chemical and Biological Method for Seawater Analysis, Pergamon Press, Oxford, 1-78.
- 50. Coe, J.M. and Rogers, D.B. (1997) Marine Debris: Sources, Impacts, and Solutions. Springer, New York, 161-170.
http://dx.doi.org/10.1007/978-1-4613-8486-1 - 51. Horsman, P.V. (1982) The Amount of Garbage Pollution from Merchant Ships. Marine Pollution Bulletin, 13, 167-169.
http://dx.doi.org/10.1016/0025-326X(82)90088-1 - 52. Jones, M.M. (1995) Fishing Debris in the Australian Marine Environment. Marine Pollution Bulletin, 30, 25-33.
http://dx.doi.org/10.1016/0025-326X(94)00108-L - 53. Derraik, J.G.B. (2002) The Pollution of Marine Environment by Plastic Debris: A Review. Marine Pollution Bulletin, 44, 842-852.
http://dx.doi.org/10.1016/S0025-326X(02)00220-5 - 54. Santos, I.R., Friedrich, A.C., Wallner-Kersaach, M. and Fillman, G. (2005) Influence of Socio-Economic Characteristics of Beach Users on Litter Generation. Ocean and Coastal Management, 48, 742-752.
http://dx.doi.org/10.1016/j.ocecoaman.2005.08.006 - 55. Lee, D.H., Cho, H. and Jeong, S. (2006) Distribution Characteristics of Marine Litter on the Sea Bed of the East China and the South Sea of Korea. Estuarine, Coastal and Shelf Science, 70, 187-194.
http://dx.doi.org/10.1016/j.ecss.2006.06.003 - 56. Shriadah, M.A. (2003) Tar Contamination on Beaches of the United Arab Emirates. Bulletin of Environmental Contamination and Toxicology, 70, 680-687.
http://dx.doi.org/10.1007/s00128-003-0038-9 - 57. Shriadah, M.A. (2008) Beach Litter along the Coastal Regions of the United Arab Emirates. Egyptian Journal of Aquatic Research, 34, 31-37.
- 58. Shriadah, M.A. and Tayel, F.R. (1991) Environmental Condition of the Western Harbor of Alexandria: Physico-Chemical Characteristics. Bulletin of High Institute of Public Health, XXII, 213-228.
- 59. Shriadah, M.A. and Tayel, F.R. (1992) Impacts of Industrial, Sewage and Agricultural Effluents on Lake Edku and Abu-Qir Bay. Bulletin of the Faculty of Science, University of Alexandria, 32, 103-155.
- 60. Emara, H.I., Shriadah, M.A., Maoustafa, Th.H. and El-Deek, M.S. (1992) Effects of Sewage and Industrial Wastes on the Chemical Characteristics of the Eastern Harbor and El-Max Bay Waters of Alexandria, Egypt. Science of the Total Environment, 112, 773-784.
- 61. Tayel, F.R., Fahmy, M.A. and Shriadah, M.A. (1996) Studies on the Physicochemical Characteristics of Mex Bay and New Dekhaila Harbor Waters of Alexandria, Egypt. Bulletin of the National Institute of Oceanography & Fisheries, 22, 1-18.
- 62. Shriadah, M.A. (1997) Observations on Some Hydrochemical Aspects of the United Arab Emirates Waters along the Arabian Gulf and the Gulf of Oman. Qatar University Science Journal, 17, 471-478.
- 63. Shriadah, M.A. and Al-Ghais, S.M. (1999) Environmental Characteristics of the United Arab Emirates Waters along the Arabian Gulf: Hydro Graphical Survey and Nutrient Salts. Indian Journal of Marine Sciences, 28, 225-232.
- 64. Shriadah, M.A. (2001) Physicochemical Properties of the United Arab Emirates Waters along the Arabian Gulf and the Gulf of Oman. Acta Adriatica, 42, 93-102.
- 65. Fahmy, M.A. (2003) Water Quality in the Red Sea Coastal Waters (Egypt): Analysis of Spatial and Temporal Variability. Chemistry and Ecology, 19, 67-77.
http://dx.doi.org/10.1080/0275754031000087074 - 66. Shreadah, M.A., Fahmy, M.A. and Abdel Fattah, L. (2015) Heavy Metals in Some Fish Species and Bivalves from the Mediterranean Coast of Egypt. Journal of Environmental Protection, 6, 1-9.
http://dx.doi.org/10.4236/jep.2015.61001 - 67. Miller, C.B. (2004) Biological Oceanography. Blackwell Publishing, Hoboken.
- 68. Iriarte, J.L., Gonzalez, H.E., Liu, K.K., Rivas, C. and Valenzuela, C. (2007) Spatial and Temporal Variability of Chlorophyll and Primary Productivity in Surface Waters of Southern Chile. Estuarine, Coastal and Shelf Science, 74, 471-480.
http://dx.doi.org/10.1016/j.ecss.2007.05.015 - 69. Vucak, Z.A.S. and Strin, J. (1982) Basic Physical Chemical and Biological Data Reports. R.V.A Mohorov ICIC Adriatic Cruises 1974-76, Hydrographic Institute of Yugoslav Navy split, 175.
- 70. Franco, P. (1983) Fatorri influent sulla productivita primaria dell Adriatico settentrionale. Proceeding of the International Conference Problems of the Adriatic Sea, Trieste, 155-174.
- 71. Suzumura, M., Ueda, S. and Suni, E. (2000) Control of Phosphate Concentration through Adsorption and Desorption Process in Ground Water and Sea Water Mixing at Sand Beaches in Tokyo Bay. Journal of Oceanography, 56, 667-673.
http://dx.doi.org/10.1023/A:1011125700301 - 72. Elser, J.J., Bracken, M.E.S., Cleland, E.E., Gruner, D.S., Harpole, W.S., Hillebrand, H., Ngai, J.T., Seabloom, E.W., Shurin, J.B. and Smith, J.E. (2007) Global Analysis of Nitrogen and Phosphorus Limitation of Primary Producers in Freshwater, Marine and Terrestrial Ecosystems. Ecology Letters, 10, 1135-1142.
http://dx.doi.org/10.1111/j.1461-0248.2007.01113.x - 73. Howarth, R.W. (1988) Nutrient Limitation of Net Primary Production in Marine Ecosystems. Annual Review of Ecology and Systematics, 19, 89-110.
http://dx.doi.org/10.1146/annurev.es.19.110188.000513 - 74. Smith, S.V. (1984) Phosphorus versus Nitrogen Limitation in the Marine Environment. Limnology & Oceanography, 29, 1149-1160.
http://dx.doi.org/10.4319/lo.1984.29.6.1149 - 75. Karl, D.M., Bjorkman, K.M., Dore, J.E., Fujieki, L., Hebel, D.V. and Houlihan, T. (2001) Ecological Nitrogen-to-Phosphorus Stoichiometry at Station ALOHA. Deep Sea Research Part II: Topical Studies in Oceanography, 48, 1529-1566.
http://dx.doi.org/10.1016/S0967-0645(00)00152-1 - 76. Falkowski, P.G., Barber, R.T. and Smetacek, V. (1998) Biogeochemical Controls and Feedbacks on Ocean Primary Production. Science, 281, 200-206.
http://dx.doi.org/10.1126/science.281.5374.200 - 77. Wu, J., Sunda, W., Boyle, E.A. and Karl, D.M. (2000) Phosphate Depletion in the Western North Atlantic Ocean. Science, 289, 759-762.
http://dx.doi.org/10.1126/science.289.5480.759 - 78. Redfield, A.C. (1934) On the Proportions of Organic Derivatives in Sea Water and Their Relation to the Composition of Plankton. James Johnstone Memorial Volume, University Press of Liverpool, 176-192.
- 79. Fahmy, M.A., Tayel, F.R. and Shriadah, M.A. (1997) Spatial and Seasonal Variations of Dissolved Trace Metals in Two Contaminated Basins of the Coastal Mediterranean Sea, Alexandria, Egypt. Bulletin of Faculty of Science, Alexandria University, 37, 187-198.
- 80. Abdel-Fatah, L., Fahmy, M.A. and Shriadah, M.A. (2003) Zn, Cu, Cd, Pb and Hg in the Egyptian Coastal Sediments along the Mediterranean Sea. Association for Modelling & Simulation and Enterprises, 64, 55-69.
- 81. Shakweer, L., Shriadah, M.A., Fahmy, M.A. and Abdel Fattah, L. (2006) Distributions and Concentrations of Trace Elements along the Mediterranean Coastal Water of Egypt. Egyptian Journal of Aquatic Research, 32, 95-127.
- 82. Emara, H.I. and Shriadah, M.A. (1991) Manganese, Iron, Cobalt, Nickel, and Zinc in the Eastern harbor and El-Mex Bay Waters (Alexandria). International Proceedings Symposium of Marine Chemistry in the Arab Region, Suez, April 1991, 97-112.
- 83. Emara, H.I., Shriadah, M.A., Maoustafa, Th.H. and El-Deek, M.S. (1995) Trace Metals-Nutrient Salts Relationship in Coastal Seawater of Alexandria. MEDCOAST, Tarragona, 24-27 October 1995, 1457-1464.
- 84. Tayel, F.R., Shriadah, M.A. and El-Shenawy, M. (1997) The Occurrence of Zinc, Copper, Cadmium, and Lead in the Seawater of Alexandria Harbor, Egypt. Proceedings of the 7th International Conference on Environmental Protection, Alexandria, Egypt, 20-22 May 1997, 106-116.
- 85. Zhang, C., Yu, Z., Zeng, G., Jiang, M., Yang, Z., Cui, F., Zhu, M., Shen, L. and Hu, L. (2014) Effects of Sediment Geochemical Properties in Heavy Metal Bioavailability. Environment International, 73, 270-281.
http://dx.doi.org/10.1016/j.envint.2014.08.010 - 86. Zhang, H. (1997) Chromium Contamination in the Soil from an Alloy Steel Factory in Nanjing. China. Environmental Science, 17, 80-82.