Theoretical Economics Letters
Vol.4 No.7(2014), Article ID:48732,10 pages
DOI:10.4236/tel.2014.47075
Fecundity and Husband-Wife Age Gap at First Marriage—Cross-Country Analysis
Xu Zhang
Department of Economics, Farmingdale State College, State University of New York, USA
Email: xu.zhang@farmingdale.edu
Copyright © 2014 by author and Scientific Research Publishing Inc.
This work is licensed under the Creative Commons Attribution International License (CC BY).
http://creativecommons.org/licenses/by/4.0/


Received 29 April 2014; revised 2 June 2014; accepted 6 July 2014
Abstract
One explanation given for the gender wage gap is the division of labor in the home. On the marriage outset, averagely speaking, husbands who are older invest more human capital in market activities than wives. This paper concentrates on the age gap at first marriage. It hypothesizes that the demand for children is one important reason for the husband-wife age gap. To show this, the paper extends a two-sided matching model of marriage (originally introduced by Eugenio Giolito [1] ) based on the biological fact that men have a longer fecundity horizon than women and examines cross-country data from World Marriage Patterns 2000 to show a higher marital age gap the greater the role children play in economic activities, the greater the importance of agriculture in an economy, the greater a country’s rural compared to total population, and the greater the population’s proportion of pro-natal religions.
Keywords:Age Gap at First Marriage, Fecundity, World Marriage Pattern 2000

1. Introduction
The prevalent age structure when a marriage union forms is that older men tend to marry younger women. However, the positive difference of SMAM (Singulate Mean Age at Marriage) between husband and wife varies across countries. According to World Marriage Pattern Report 2000, released by United Nations, the significant age difference of SMAM varies between countries and regions. In less developed countries and regions, the age difference of SMAM tends to be larger, while in relatively more developed areas, the age difference of SMAM tends to be smaller.
A large body of research on the timing of marriage suggests economic growth, availability of potential candidates for marriage, culture differences and social norms can all be possible explanations for the rising age at marriage for both males and females. However, most of the previous studies on timing of marriage pattern concentrate on one or two countries or part of regions. Saardchom and Lemaire [2] perform an international regression analysis on the timing of marriage pattern, but their explanation is based on several theories and is not attributable to a specific universal reason. In this paper, I concentrate on the age gap at first marriage. Similar to the model in Giolito [1] , asymmetric fecundity horizon between male and female is assumed. But instead of a constant utility multiplier of having children, I assume the utility from having children within marriage captures information about personal preferences and country-specific characteristics. I perform cross-country regression analysis and conclude the value of children in the marriage is the main driving force for the positive age gap at first marriage between husbands and wives. In another word, the more children within marriage are desired, the larger age gap at first marriage between male and female. Any country-specific characteristic affecting people’s value for children within the country will drive the age gap at first marriage flowing in magnitude.
The rest of the paper is organized as follows: marriage and fertility patterns around the world are present in section two; section three introduces the data; empirical methods and results are discussed in section four and section five concludes.
2. Marriage and Fertility Pattern around the World
Africa is a continent with the highest average age gap at first marriage. It also has one of the highest fertility levels in the world. The average SMAM difference between males and females is around 5 years, ranging from 9.2 years in Gambia to 1.8 years in South Africa. Also, females in Africa tend to marry early. Of the 20 countries with the highest age gaps in mean age at first marriage, 16 countries are in Africa. Though the overall fertility level is decreasing worldwide, there are a number of countries experiencing meager declines. These latter countries constitute 21 developing countries where fertility rates declined by less than one child since 1970. Of these 13 countries are from sub-Saharan Africa. The large age gap at first marriage and the high fertility level in Africa are basically associated with low healthcare conditions and fewer family planning policy controls.
The average SMAM difference between males and females in Asia is around 3 years. The age gap at first marriage varies dramatically with a minimum of around 1 year in Myannar and a maximum of around 7 years in Afghanistan and Bangladesh. Developed countries such as Japan, Korea and Singapore are experiencing low fertility level due to rapid growth in their economies and religion beliefs that don’t promote fertility. China has reduced her fertility level by 4 children per women since 1970 by taking on family planning policies.
Europe is the continent with lowest SMAM difference between males and females. The data shows a minimum of −0.2 years in San Marino (meaning that in San Marino wives are actually on average 0.2 years older than their husbands) and a maximum of 4.9 in Greece. North Europe is an area with a low age gap at first marriage and high social welfare.
The SMAM difference is smaller in Latin America and the Caribbean than in Africa or Asia. Similar to the North European countries, there are many consensual unions in this area, therefore, the data may not exactly reflect the age at first marriage.
3. Data Sources and Definitions
The age gap at first marriage is measured by the difference of singulate mean age at marriage (SMAM) between males and females. SMAM is a formulation developed by Hajnal [3] to indirectly compute a population’s mean age at first marriage from census type data on the proportion of a population’s single people at each age level (assuming all first marriages have taken place by age 50). It is expressed as
 (1)
(1)
Thus SMAM is the sum, up to age 50, of the difference between the proportion single at age x and the proportion single at age 50 divided by 1.0 minus the proportion single at age 50. Intuitively, this is the weighted average of the ages at which individuals get married up to age 50.
Fertility level is a proxy for the value of children. A greater number of children in a family indicate children are relatively more desired and valuable. In our model more children are associated with a larger age gap at marriage. Thus, a positive correlation between fertility level and the age gap at first marriage is expected.
Child labor also denotes the value of children. According to a report from UNICEF, an estimated 146 million children are engaged in child labor. The Asian and Pacific Regions have the largest number of child workers in the 5 - 14 age groups, with over 19% of child labor in the world, 127.3 million in total. Sub-Saharan Africa has about 48 million child workers. Latin America and the Caribbean countries have almost 17.4 million child workers. Other regions with large volumes of child labor include the Middle East, North Africa and some areas in industrialized and transition economics. In these regions children are desired in the sense that they either earn money to increase family income or provide paid or unpaid housework help at home or in agriculture. Therefore, I expect countries with prevalent child labor to have a larger age gap at marriage.
The difference in the value of children is also reflected by area of residence. Rural areas often motivate families to have more children since rural areas are usually agriculture-related so that parents can get help from children. Families in urban areas have fewer children. Thus I expect smaller marital age gap in urban compared to rural areas.
Also, with advancing medical technology, having children early in life has become less crucial in countries where better health care increased the female fecundity horizon. In such countries, the asymmetric gap in male and female fecundity horizons has becomes smaller, thereby narrowing the relative biological advantage young women have compared to older women. This narrowing of the gender fecundity horizon causes men to be less choosy, and as a result, my model suggests the age gap at marriage to be smaller.
Education usually indicates the development of a country. Becker [4] states highly educated people positively sort due to more mutual understanding and compatibility. Highly educated spouses are usually associated with a lower desire for children due to high opportunity costs of raising children. Thus, a negative correlation between the prevalence of education and the marital age gap is anticipated.
An ordinary least squares regression is applied to examine how much of age gap at first marriage between couples is explained by the value of children in the family across countries. All data are extracted from the World Bank’s World Development Indicators 2006, the World Bank’s, World Marriage Pattern 2000, from United Nations’ World Fact Book, from the UNESCO Institute for Statistics, and the US CIA website1 [5] -[14] . The explanatory variables and definitions are the following:
Child Labor is defined as percentage of children from age 10 to 14 who are involved in economic activities out of children in that age group.
Urban Population is defined as percentage urban population out of total population.
Employment in Agriculture measures percentage of employment in agriculture relative to total employment.
Tertiary Education of Females refers to post-secondary education, including universities, colleges, technical training institutes, community colleges, nursing schools, etc. The data on female tertiary education describes the percentage of females at age 15 or over who complete tertiary education out of total females.
Literacy Rate is based on the UNESCO definition: “Literacy is the ability to identify, understand, interpret, create, communicate and compute, using printed and written materials associated with varying contexts.” Higher literacy rates are associated with better average level of education in that country.
African Country Dummy is designed to display African regional effects. It is defined as one if data are from an African country, zero if not.
Muslim is defined as percentage of Muslim in the total population.
A summary of these variables is listed in Table1
The data on age gap at first marriage come from World Marriage Pattern 2000 [12] . The age gap at first marriage is calculated as the male-female difference in SMAM for 179 countries. Unfortunately the data are not uniformly available for the same year, but instead varies from 1970-1998. However, this is not a major problem since the age gap at first marriage changes slowly from year-to-year. Thus I match each country’s age gap at first marriage with corresponding explanatory variables for the appropriate year, and treat the data as a single cross-section. Thus each observation defines the characteristics for one country. All the data are extracted from World Development Indicators 2006 CD-ROM with the exception of the Tertiary Education of Female which is obtained from the Institute for Statistics of UNESCO and the data for the Muslim variable are from the World Facts Book. Summary statistics of all variables in the data are shown in Table2
Empirical Methods and Results
Define the econometric specification for regression is

Table 1. Summary statistics for dependent and explanatory variables of cross-country analysis.
Table 2. Summary statistics of all variables of cross-country analysis.
 (2)
(2)
or
 (3)
(3)
My model expects in a country where children are more valuable and desired, the
age gap at first marriage between male and female tends to be larger. In addition,
any factor leading to desire more children will tend to positively affect the age
gap while factors decreasing the quantity demand for children will have negative
impact on age gap. Therefore, holding other variables constant, I am expecting
 as the higher proportional child labor exists, the more important role children
play in economic activities. Similarly,
as the higher proportional child labor exists, the more important role children
play in economic activities. Similarly,
 is expected to be positive in the sense that inhabitants of
African countries tend to have more children than any other regions in the world.
The intuition behind this is the high death rate in Africa due to bad medical condition
forces people to have more children to maintain some level of population growth
and to deal with activities for a living. I take variable “Year of census” into
account for the various years associated with each country’s data, therefore,
is expected to be positive in the sense that inhabitants of
African countries tend to have more children than any other regions in the world.
The intuition behind this is the high death rate in Africa due to bad medical condition
forces people to have more children to maintain some level of population growth
and to deal with activities for a living. I take variable “Year of census” into
account for the various years associated with each country’s data, therefore,
 could be negative or positive.
 and
and
 are expected because agriculture industry is labor intensive, people living in urban
area are less likely to have as many children as people living in rural area do.
Children are more valuable in rural areas as important source of labor supply. The
higher population density in an urban area or the lower the employment coming from
agriculture the less the demand for children, and the smaller the age gap at first
marriage. Thus, these two variables somehow capture similar information, which may
lead to multicollinearity in the regression.
are expected because agriculture industry is labor intensive, people living in urban
area are less likely to have as many children as people living in rural area do.
Children are more valuable in rural areas as important source of labor supply. The
higher population density in an urban area or the lower the employment coming from
agriculture the less the demand for children, and the smaller the age gap at first
marriage. Thus, these two variables somehow capture similar information, which may
lead to multicollinearity in the regression.
 is estimated to display the relationship between the prevalence
of Muslim Religion and the age gap at first marriage. As we know, Muslim people
tend to have more children so a positive
is estimated to display the relationship between the prevalence
of Muslim Religion and the age gap at first marriage. As we know, Muslim people
tend to have more children so a positive
 is expected. As for the impact from level of education on the age gap at first marriage,
 is predicted because high education usually is related to demanding
fewer children due to high opportunity costs of raising children. The variables
Tertiary Education of Female and Literacy Rate both measure the average educational
attainment of a country, so one of these two variables will be employed in the regression,
though more data observations are available for Literacy Rate.
is predicted because high education usually is related to demanding
fewer children due to high opportunity costs of raising children. The variables
Tertiary Education of Female and Literacy Rate both measure the average educational
attainment of a country, so one of these two variables will be employed in the regression,
though more data observations are available for Literacy Rate.
As shown in Figure 1, the Age Gap at First Marriage is positively related to Child Labor and Employment in Agriculture while negatively related to the Urban Population and Literacy Rate [11] -[14] .
In order to verify the relationship between Tertiary Education of Female and Age Gap, I examine the scatter plot displayed in Figure 2. The graph shows a slightly positive pattern which contradicts with my expectation. However, Figure 3 shows a negative correlation between Age Gap and Literacy Rate, as expected. By running a simple regression of Age Gap on Tertiary education of female and Literacy Rate separately, as shown in Table 3, I find the impact of variable Tertiary Education of Female is insignificant while that of variable Literacy Rate is significant, which may be because of limited observations available for the variable Tertiary Education of Female. Therefore, Literacy Rate is chosen to measure the average educational attainment of a country.
Since the Urban Population and Employment in Agriculture capture overlapped information regarding the importance of agriculture relative to overall economy, variable Employment in Agriculture is dropped to reduce the problem of multi-collinearity. The regression results are shown in Table4
As expected, Childlabor and D_Africa have significantly positive effects on the Age Gap; Literacy shows a negative significant coefficient which means a country with higher literacy rate tends to have smaller age gap at first marriage. However, Year, Urban and Muslim are insignificant despite the correct signs as expected. Diagnostics indicates no serious collinearity among the predictors. All the coefficients of VIF are less than 10 and all the coefficients of Tolerance are greater than 0.1. Also the student—t normalized residuals displayed in Figure 4 do not show much deviation from the normal distribution thereby ensuring the validity of t and F tests.
Figure 5 checks the linearity between explanatory variables and the dependent variable Age Gap and some

Figure 1. Correlation graphs of the age gap and explanatory variables.

Figure 2. Scatter plot of the age gap and the tertiary variables.
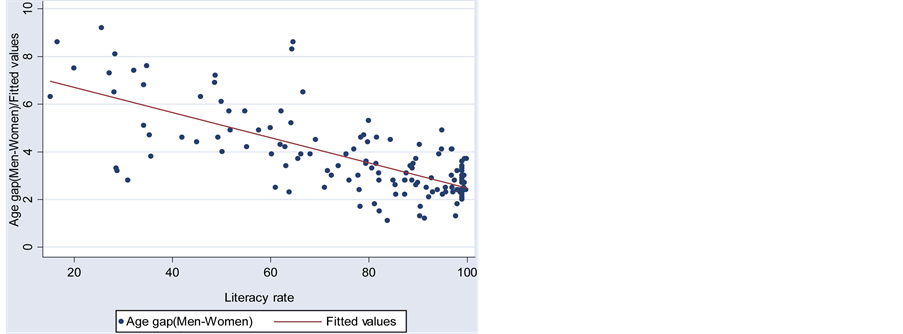
Figure 3. Scatter plot of the age gap and the literacy rate.
Table 3. Separate two-variable regression of the age gap at first marriage.
Table 4. OLS regression results and collinearity diagnostics (Model 1).
*,**,*** indicate significance level at 10%, 5% and 1%, respectively.

Figure 4. Regression residuals from Model 1.

Figure 5. Linearity of the literacy rate.
degree of non-linearity of Literacy Rate is found. Therefore, Lsquare as square of the Literacy Rate is included in the regression and the result is shown as in Table5
Model 2 has slightly smaller R-squared due to fewer explanatory variables. Child Labor is still significant with a coefficient 0.032143 meaning that one percentage increase of Child Labor will increase the Age Gap by 0.032143 years. The impact from being African Countries is also significant with a coefficient indicating a 0.9848378 year more of marital age gap among African Countries than in the other regions. The effect from Lsquare on Age Gap is negative and significant, implying the marginal effect to be decreasing as the Literacy Rate increase, which can be interpreted as the more literate the population, the greater a country’s socio-economic development, the more the non-agriculture economic activity, and the lower the desire for children, resulting in a smaller age gap at first marriage. It is more likely that marital partners tend to find a partner with similar education background when the level of literacy rate approaches higher levels. As Becker [4] indicates highly educated people tend to be positively sorted and have lower desire for children, thus, smaller age gap at first marriage. The variable Muslim shows a positive and significant impact as expected as the religion tend to be pro-natal and desire more children. Figure 6 plots the regression residuals of Model 2. Again, there is little deviation from the normal distribution.
Table 5. OLS regression results and collinearity diagnostics (Model 2).
*,**,*** indicate significance level at 10%, 5% and 1%, respectively.

Figure 6. Model 2 regression residuals.
One of main assumption of OLS regression is homoskedasticity of the variance of residuals. If the model fits the data well, there should be no explicit patterns to the residuals plotted against the fitted values. Figure 7 does not show very strong evidence for heteroskedasticity. However, it shows there are likely some influential outliers in the data. The square of residuals are plotted to look for observations that are jointly high on both of the two measures. As shown in Figure 8, the country Afghanistan easily catches my attention.
In order to check the overall measure of influence of this outlier, Cook’s D statistic which combines information on both leverage and residuals is examined. The higher the Cook’s d is, the more influential the data point. I do find the Cook’s d statistic for Afghanistan (at 0.1852593) is larger than that for any other countries whereas the cut-off point is 0.03007519 (4/133). For this reason, an OLS regression omitting “Afghanistan” is run and the results in Table 6 show significant changes on the coefficients.
In Model 3, variables Child Labor, D_Africa, Muslim and Lsquare are all significant with correct signs as predicted. When variable Literacy is added to the regression in Model 4, Child Labor, D_Africa and Muslim are still significant with correct signs. The linear impact from variable Literacy is negative and significant, while variable Lsquare becomes insignificant and the coefficient is positive though in a very small magnitude. The marginal effect of the average educational attainment of a country on the Age Gap at first marriage becomes −0.059, which means as literacy rate increases, the age gap at first marriage is decreasing, and the negative marginal effect of Literacy tends to be smaller as literacy rate approaches one. All in all, among different specifications of the model, variables Child Labor, D_Africa and Muslim always demonstrate positive significant effects on the Age Gap at first marriage between men and women, which is consistent to the prediction of the model

Figure 7. Residual homoskedasticity.

Figure 8. Country specific residual plot.
Table 6. Regression results of Models 3 & 4 (Omitting “Afghanistan”).
*,**,*** indicate significance level at 10%, 5% and 1%, respectively.
that, the more valuable of children or the higher demand for children, the larger age gap at first marriage.
4. Conclusion
It has receive well attention that, while the average age at first marriage for both men and women varies across countries, there is a persistent pattern of positive age gap between men and women around the world. Though a set of separate explanations has been investigated by existing literature, this paper recognizes a biological fact of the asymmetric fecundity horizon between men and women (that is, men have longer fecundity horizon than women) and verifies the demand for children is the driving force for the positive age difference at first marriage between men and women. Based upon the study on World Marriage Report 2000 [14] , this study finds any factor, which is positively correlated with the demand for children, tends to increase the age gap at first marriage. In particular, a higher marital age gap is found, the greater the role children play in economic activities, the greater the importance of agriculture in an economy, the greater a country’s rural compared to total population, and the greater the population’s proportion of pro-natal religions.
References
- Giolito, E.P. (2003) A Search Model of Marriage with Differential Fecundity. IZA Bonn Discussion Paper No.1082.
- Saardchom, N. and Lemaire, J. (2005) Causes of Increasing Age at Marriage: An International Regression Study. Marriage and Family Review, 3.
- Hajnal, J. (1953) Age at Marriage and Proportions Marrying. Journal of Population Studies, 7, 115-136.
- Becker, G.S. (1991) A Treatise on the Family. Harvard University Press, Cambridge, MA.
- Becker, G.S. (1973) A Theory of Marriage: Part I. Journal of Political Economy, 81, 813-846. http://dx.doi.org/10.1086/260084
- Bergstrom, T. and Bagnoli, M. (1993) Courtship as a Waiting Game. Journal of Political Economy, 101. http://dx.doi.org/10.1086/261871
- Brien, M. (1997) Racial Differences in Marriage and the Role of Marriage Markets. Journal of Human Resource, 32, 741-778. http://dx.doi.org/10.2307/146427
- Burdett, K. and Wright, R. (1998) Two-Sided Search with Nontransferable Utility. Review of Economic Dynamics, 1, 220-245. http://dx.doi.org/10.1006/redy.1997.0004
- Gale, D. and Shapley, L. (1962) College Admission and the Stability of Marriage. American Mathematical Monthly, 69, 9-15.
- Mortensen, D. (1988) Matching: Finding a Partner for Life or Otherwise. American Journal of Sociology, 94, S215-S240.
- The United States Median Age at First Marriage, 1890-2002, Data from US Bureau of Census.
- World Marriage Pattern 2000, the United Nations.
- World Development Indicators, 2006, the World Bank.
- World Fact Book, UNESCO Institute of Statistics.
NOTES

1www.cia.gov