Open Journal of Geology
Vol.05 No.06(2015), Article ID:57600,18 pages
10.4236/ojg.2015.56044
Structural and Fault Analysis of Haji Abad with Interpretation of Landsat 8 Satellite Images
Shima Rahmati Kamel, Mahmood Almasian, Mohsen Pourkermani, Soraya Dana
Faculty of Basic Sciences, Department of Geology, Islamic Azad University, North Tehran Branch, Tehran, Iran
Email: s.rahmati.k@gmail.com
Copyright © 2015 by authors and Scientific Research Publishing Inc.
This work is licensed under the Creative Commons Attribution International License (CC BY).
http://creativecommons.org/licenses/by/4.0/


Received 25 May 2015; accepted 27 June 2015; published 30 June 2015
ABSTRACT
Zagros orogenic belt has developed on northern-eastern edge of Arabian plate from Northern- Western-Southern-Eastern Turkey to Strait of Hormuz with a length of over 2000 km. Thick sedimentary series of the Zagros (6 - 12 km) has maintained complex tectonic history of the region, which represents all stages of development of a basin from a passive continental shelf to a rift. This finally represents various stages of deformation in relation to ophiolite obduction and continental collision. The study area is located in the south and southeastern part of Iran in the range of 28 and 29 to 55 and 57. The study area includes Hormozgan and Kerman Provinces in national classification. Geographic position of this region at the intersection of three sedimentary structural zones of Zagros, Makran and Central Iran has revealed that Hormozgan Province has specific geological and structural features. Nowadays, remote sensing techniques and particularly structural analysis with satellite images are supplement to the observation and field interpretation. Landsat satellites can be noted in this regard, which has helped the scientists to interprete natural science since a long time ago. Landsat 8 is equipped with panchromatic band and thus has a high spatial resolution. Therefore, the images obtained from this satellite are used. The images are raw and after application of various filters and image processing operations by ER mapper and Arc GIS the lineaments that have remained unidentified are observed. The discoveries are then introduced to the realm of construction geology in the form of a new map of regional faults using the remote sensing technologies.
Keywords:
Haji Abad, Landsat 8, Remote Sensing, Structural Analysis, ER Mapper 8

1. Introduction
In general, remote sensing can be called acquiring information technology and land imaging using aeronautical equipment such as aircraft, space equipment or satellite [1] [2] . Nowadays, remote sensing technology and satellite images are used in various fields such as fault detection, mine exploration, petrology and mapping [3] [4] . The required data is collected by a sensor. After analysis, the collected data is integrated with other layers of information in GIS system. The integrated data is prepared for the user. In this stage, the integrated data is interpreted by using various methods. In addition to data interpretation, images are interpreted to identify various phenomena with regard to their importance.
2. Materials and Methods
A scene of the study area is required in order to use Landsat satellite images. Each scene is determined with a path and a row. The study zone was located in one scene in Hormozgan Zone (Figure 1). As a case, this research selected Iran’s Zagros zone. This region due to the geological dynamics is considered by many geologists [5] . In this regard, the framework of Haji Abad was selected as a case study because of its convenient location for structural and fault analysis. The study area is located in the south of Iran in Hormozgan and Kerman provinces. It is also situated in the Zagros orogenic zone and Sanandaj-Sirjan volcanic zone. This area has a longitude of 28˚29' and latitude of 55˚57'. This region was selected because it has always been changed by active and non-active faults as a result of the compression caused by the Arabic plate to Iranian plate. The Arabic plate has always caused changes in the arrangement of faults in the region by imposing compression plate on the Iranian. Hence, scientists and researchers study this region to find new faults and examine the new discoveries. The area has a dominant fault structure with a southwest-southeast strike which is the result of the angle of the compression exerted by the Arabic plate on the central Iran plate.
The first stage in image processing is called pre-processing, which should be done before processing operations. Given that remote sensing data is mainly used as a background for other information embedded in the map, remote sensing data significantly shows surface of the earth with sufficient accuracy [6] . In other words, spectral ratios of the image should be close to the truth.
Usually, raster images are stored as raw images with geometric errors. Geometrically corrected images are needed for accurate coordinates, area and measurements [7] .
Geometric correction of satellite images resolve errors and distortions in the image such as changes in height and speed of the satellite, displacement in terms of height and lowness and other factors, which are cited in the following.
The purpose of processing images lies in clarifying geographical data in digital images in order to extract certain information for the user. A digital image is stored in a two-dimensional array by small limited areas, which

Figure 1. 1:250000 geological map and satellite images of the study area.
are called pixels [8] [9] .
Each pixel spatially coincides with an area on surface of the Earth. This orderly network structure is called raster. Digital data are generally in raster from, which are stored in horizontal and vertical rows. Each pixel in the raster image is a numerical value, which is called digital number (DN). In satellite images such as Landsat, DN represents intensity of the reflected energy in the visible spectrum, infrared or other electromagnetic rays. Mathematical transformations on digital numbers with ER Mapper software are used to extract and interpret digital data. This technique is impossible in manual interpretations. For this purpose, image processing has become an interpretation tool for various fields of Geoscience [9] [10] .
One scene of digital data and ETM Landsat satellite were used for structural analysis. RAW images (Figure 2) should be corrected using control points when precise coordinates, areas and measurements are needed. Here tectonic maps of Iran are used as a reference. Basic geometric corrections were made in compliance with image registration. Geological and tectonic maps of the area were digitized using ArcGIS software in order to adapt the maps with satellite images. The prepared images were processed. In this regard, ER-Mapper software was used due to different applications as well as easier and more accurate processing. This section briefly discusses the techniques used in this study.
2.1. Satellite Image Processing
Three methods were used to detect fracture lines in satellite images as follows:

Figure 2. Raw gray image of the study area with Landsat 8 Satellite.
1) Detection of displacement in layers and sudden changes in lithologic boundaries
2) A review of direct valleys as fracture zones
3) A review of fault bluff or dikes [9] [11]
In this section, remote sensing techniques were used for better visibility and drawing fracture lines using unique methods.
2.2. The Techniques Used in This Study
・ The techniques used in this project are as follows:
・ Using band ratios to eliminate the effects of topography and shadows
・ Color combination of RGB images to separate rock units based on color
・ Apply fusion in order to increase the spatial resolution
・ NDVI Vegetation to highlight begetation in the area
・ Apply Sunangle, Highpass and Edges filters to detect fractures lines, borders and sharp edges
・ Using DEM images for better visibility of valleys by the created shadows
・ Principal component analysis (PCA) in order to focus the data relevant to multiple bands in one band for better visibility from sharp edges
・ Band ratio to observe minerals and other complications associated with the fault
In this section, the techniques used in this project are discussed.
3. Result and Discussion
3.1. Using Band Ratio
This technique is used for distinguishing various phenomena by the differences in absorption and reflection of light in different phenomena (Figure 3). Eliminating the effect of topography and shadows can be cited among advantages of this method, which can be applied on two image types:
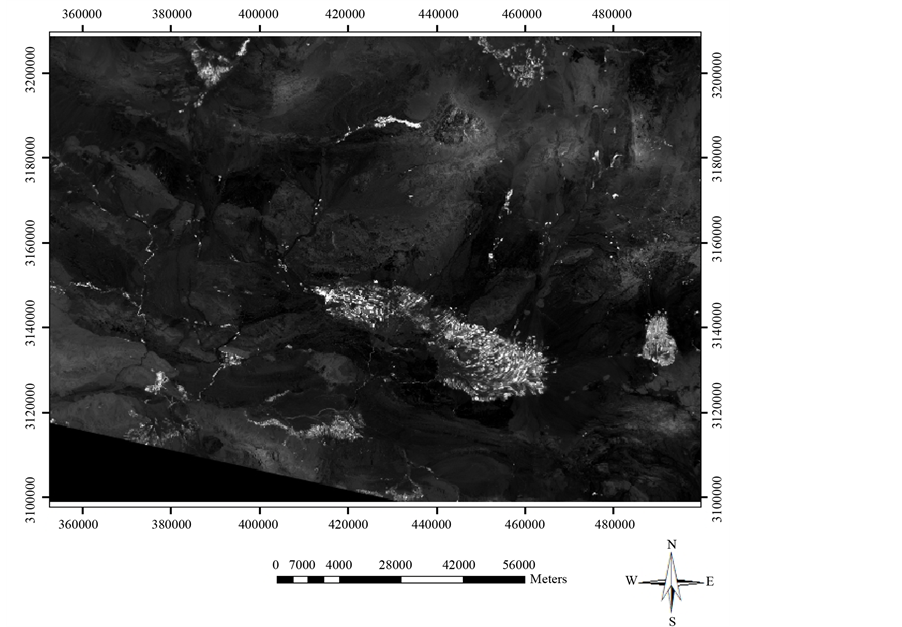
Figure 3. Vegetation appears brighter than other objects in grayscale at 5/4 ratio.
1) On grayscale images
2) On RGB color images
Grayscale images relevant to the above phenomenon are brighter due to maximum reflection and absorption properties compared to other image types. For example, vegetation and rocks in hydrothermal alteration appear brighter than other areas in grayscale images with 6/7 ratio.
3.2. Color Combination of RGB Images
Retina in human eyes is composed of a large number of rod and cone cells. The rod cells are sensitive to light and cone cells are sensitive to three primary colors of red, green and blue. In fact, the cone cells are commonly sensitive to a part of the electromagnetic rays. In color images, each phenomenon is assigned to one of the three primary colors. Each color represents a phenomenon in the image. The images were displayed in RGB space in order to separate phenomena (vegetation, rocks with hydrothermal alteration) from each other (Figure 4). In general, phenomena are clarified better and are interpreted easier using color images compared to black and white images. In fact, RGB false color images (red-green-blue) is one of the most common approaches in pro- cessing satellite data [12] . A color image is constructed by a combination of three different bands and assigning each one of the three primary colors to one band. The band combination of RGB = 432 shows true color in nature, which is called true color composite. Any other combination except RGB = 432 is called false color composite [13] .
Since three bands are needed to construct an RGB image, it should be considered how many unique combination modes are possible using 2, 3, 4, 5, 7, 8, 10 and 11 bands.

n is the number of total bands
r is the number of applied bands
Then, 56 combination modes are possible by inserting the numbers in the formula. However, more information is needed to select the best combination among possible ones. Thereby, statistical parameters should be used.
Optimum Index Factor (OIF) should be used to calculate statistical parameters of the images [10] [14] . In this parameter, sum of standard deviations of k bands are calculated with respect to sum of correlation matrix. Accordingly, three bands with the greatest information and the least share are determined. At the end, combination

Figure 4. LANDSAT satellite image, RGB = 543.
band = 741 was selected as the optimum combination (Figure 5).
![]()
Sk = Standard Deviation
Abs (rj) = correlation matrix value
3.3. Applying Fusion
Fusion integration of ordinary images with panchromatic images or any other image improves spatial resolution. At this stage, RGB images were converted into HSI. The band with high special resolution was replaced with intensity. As shown in Figure 6, the image is retransferred from HSI space to RGB space. Then, panchromatic band or the eight bands was applied to the Landsat satellite images in order to reduce spatial resolution from 30 m to 15 m. This improved spatial resolution of satellite images. RGB = 345 was one of the best virtual color combinations used to more clearly identify the faults and geological units.
3.4. Normalized Difference Vegetation Index (NDVI)
Normalized difference vegetation index (NDVI) is one of the oldest and most widely used vegetation index.
![]()
Figure 5. LANDSAT satellite image RGB = 752.
![]()
Figure 6. Fused image of the study area.
According to Figure 7, normalized equation of the index and on the other hand, a wide range of the electromagnetic spectrum including maximum absorption and reflection of chlorophyll revealed that this index is stable and reliable in a wide range of different conditions. It should be noted that this index is saturated in case of high LAI values. The value of this index varies for different vegetation [15] .
For example, total values of this index for sparse vegetation are (0.05, 0, 2), for regular and semi-dense vegetation are (0.2, 0.6), for very dense and rich vegetation are (0.6, 0.8), for water, snow and ice are negative. Values of this index are less than 0.05 in soil. Value of this index in overcast (cloudy) areas is equal to zero. This method is used to identify faults in the region.
![]()
3.5. Filtering
Spectral values are modified in filtering operation in which value of each pixel changes with respect to value of the neighbor pixel. Contrast is changed as filtering is used on the original image. A matrix is filtered with odd cells (this is because a pixel should be located at the center). Depending on the application, some changes are made in the number of central cells with respect to the surrounding cells. Filters are in 3 × 3 (Figure 8), 5 × 5
![]()
Figure 7. Image of normalized vegetation index, the vegetative areas are brighter than other areas in this image.
(Figure 9) and 7 × 7 (Figure 10) sizes.
Filtering is one important method for better visibility and detection of phenomena.
The filters used in this section are as follows:
・ High-pass filters
・ Edge detector filters
・ Sunangle filters
These filters are briefly discussed here.
High-pass filters act as edge detector and only allow passage of high frequency gray pixels. The filter not only detects the edges, but also does not obliterate other phenomena [16] [17] .
The edge detector filters as the name suggests detect edges in images such as structural lineaments, roads and rivers (Figure 11). This filter is considerably important in geological structure for detecting fault lineament [18] [19] . Sunangle filter is one simple and helpful technique for detection of sharp edges and borders such as fault lines and joints.
3.6. Using DEM Images
Sun-shading technique is used in DEM images to identify topography of the region. This technique can make
![]()

Figure 8. High pass sharpen filter, the matrix contained in the filter is a 3 × 3 matrix which shows the processes applied to the image.
![]()
Figure 9. 5 × 5 high pass sharpen filter, the matrix contained in the filter is a 5 × 5 matrix which shows the processes applied to the image.
![]()
Figure 10. Image with Sharpen11 filter.
![]()
Figure 11. Drawing new lineaments and faults.
the sun shine in the desired direction to review the created shadows [20] . In Figure 12, the sun shine is coming from the North West so lineaments in the North East, South West are visible. Similarly, in Figure 13 the sun shine set on the North East and in Figure 14 is twisted in the South West.
![]()
Figure 12. The angle of the sun shine from the North West.

Figure 13. The angle of the sun shine from the North East.

Figure 14. The angle of the sun shine from the South West.
3.7. Principal Component Analysis
Principal Components Analysis (PCA) is one technique used to detect phenomena. There is a usually high correlation between different bands of satellite images. This duplicates a series of information. PCA method reduces duplicate data or disturbing phenomena such as shadows, effects of topography and angle of solar radiation (Figure 15). In fact, this method reduces compatibility between different bands of data in multi-dimensional space, which detects special phenomenon. In PCA method, band data with high correlation are focused on a band with high variance. The principal components are calculated based on standard deviation, variance and covariance. PCA is a linear transformation in which coordinate axes of multi-band space are rotated in such a way that the first axis is located in direction of maximum variance and the second axis is perpendicular to the first axis in line with the residual variance. In this method, n new PC bands are created from n bands participating in the conversion. The participating bands were correlated with each other. The matrices associated with analysis show that PC 1 has the greatest information and rate of information lessen in other PCs is descending order. The desired PC for the given phenomenon can be specified by taking into account spectral behavior of the phenomenon and evaluating maximum reflection and absorption of the phenomena between the bands and examining the correlation matrix. Principal components analysis (PCA) is a well-known method in remote sensing image analysis. Several objectives are determined for using this technique such as reducing data size, discovering changes in multi-temporal images and detecting specific phenomena. In this method, data or image bands are placed in a new space and new components are replaced by new bands or previous components. In this new space, each new component is a linear combination of the previous bands as follows (Figure 16). There is no correlation between the bands in this new space and independent bands are created:

Figure 15. RGB Pc1 Pc2 Pc3 image.

Figure 16. PC = RGB Landsat image after applying PCA 1 technique.

In this equation,
 represents Kth component, wi denotes eigen vector, DNi represents the rate of brightness of ith band [3] .
3.8. Using Band Ratio Method
Band Ratio is one common method in image processing. This method either increases or decreases a series of noises. This method also eliminates the effects of topography and shadows. This method also highlights the borders. Thereby, this method is used to separate the boundary between rock units and detect the rocks [21] . As shown in Figure 17, vegetation has the maximum reflection in the fourth band of Landsat satellite and the maximum absorption in the third band of Landsat satellite. The vegetation can be detected with regard to this property as well as dividing the fourth band to the third band. Some of those commonly used ratios are as follows:
Ratio of the third band to the fourth band = separating vegetative from non-vegetative areas
Ratio of the seventh band to the fifth band = detecting hydrothermal altered rocks
Ratio of the first band to the third band = separation of iron oxide
3.9. A Three-Dimensional Image of the Region
A three-dimensional view of the study area can be created using Digital Elevation Model (DEM) (Figure 18).

Figure 17. RGB image of band ratios of 4/2, 5/4 and 6/7.
The most useful types of data are SRTM sensor images used in this project. ER Mapper Software was also used to create three-dimensional image of the region with various RGB. The images suggest that the northern part of the study area has greater topography than southern part of the study area.
4. Drawing the Structural Map
Tectonic lineaments in the study area were drawn using images obtained from the above techniques including RGB = 345 image and grayscale image and filtered images and PC1 single-band image and DEM images with directed shadows and images with certain band ratios. The final map was prepared using structural map of fractures with RGB = 345 (optimal combination) (Figures 19-22).

Figure 18. Three-dimensional image RGB752.

Figure 19. Map of identified structures on 543 image.

Figure 20. Map of main, secondary, and new structures.
5. Conclusion
Following results are obtained according to remote sensing studies using satellite images of geo-magnetic aerial impression
1) Remote sensing studies with ER-mapper software being relevant to extraction of lineament represents that Sharpen

Figure 21. Map of minor and major faults in the study area.
11 filter is the best filter, which shows the lineament.
2) The main structure extracted by remote sensing shows the same trend in accordance with the main zone of Zagros in direction of Khavari Bakhtari area.
3) Deformations and ophiolites are located in Zagros main thrust zone.

Figure 22. Map of faults detected in the study area.
4) According to geomagnetic studies, slope of the main thrust is towards the North East.
5) The most important phenomenon in deformation in the area is Arabian Plate subduction beneath central Iran. Therefore, the farther from the main thrust is the more simplified structure. Farther faults have greater distances from the thrust.
All extracted faults are recommended for further studies because some of these lineaments and faults are hidden and are located near residential areas and some of them are beneath the cities. Geophysical studies and regional seismicity are recommended in general fault map of Iran.
References
- Blaschke, T. (2010) Object Based Image Analysis for Remote Sensing. ISPRS journal of Photogrammetry and Remote Sensing, 65, 2-16. http://dx.doi.org/10.1016/j.isprsjprs.2009.06.004
- Richards, J.A. and Jia, X.P. (1999) Remote Sensing Digital Image Analysis. Vol. 3, Springer, Berlin Heidelberg. http://dx.doi.org/10.1007/978-3-662-03978-6
- Campbell, J.B. (2002) Introduction to Remote Sensing, CRC Press, Boca Raton.
- Rogan, J. and Chen, D. (2004) Remote Sensing Technology for Mapping and Monitoring Land-Cover and Land-Use Change. Progress in Planning, 61, 301-325. http://dx.doi.org/10.1016/S0305-9006(03)00066-7
- Rahmati Kamel, S., Almasian, M. and Pourkermani, M. (2015) Review and Analysis of Geological Structural Model by Using Geomagnetic, Case Study: Haji Abad Region in Iran’s Zagros Zone. Open Journal of Geology, 5, 39-54. http://dx.doi.org/10.4236/ojg.2015.52004
- Arian, M. and Nouri, R. (2015) Lineament Tectonics and Mineralizatin in Tarom Area, North Iran. Open Journal of Geology, 5, 115-125. http://dx.doi.org/10.4236/ojg.2015.53011
- Hajibapir, G., Lotfi, M., Zarifi, A.Z. and Nezafati, N. (2014) Application of Different Image Processing Techniques on Aster and ETM+ Images for Exploration of Hydrothermal Alteration Associated with Copper Mineralizations Mapping Kehdolan Area (Eastern Azarbaijan Province-Iran). Open Journal of Geology, 4, 582-597. http://dx.doi.org/10.4236/ojg.2014.411043
- Gupta, R.P. (2003) Remote Sensing Geology. Springer Science & Business Media, Springer, Berlin Heidelberg. http://dx.doi.org/10.1007/978-3-662-05283-9
- Drury, S.A. and Drury, S. (2001) Image Interpretation in Geology. Blackwell Science, London.
- Rees, W.G. (2013) Physical Principles of Remote Sensing. Cambridge University Press, Cambridge.
- Ricchetti, E. (2000) Multispectral Satellite Image and Ancillary Data Integration for Geological Classification. Photogrammetric Engineering and Remote Sensing, 66, 429-435.
- Pohl, C. and Van Genderen, J.L. (1998) Review Article Multisensor Image Fusion in Remote Sensing: Concepts, Methods and Applications. International Journal of Remote Sensing, 19, 823-854. http://dx.doi.org/10.1080/014311698215748
- Alavi Panah, S. (2003) Application of Remote Sensing in Geology (Earth Sciences). Vol. 1, University of Tehran, Tehran.
- Chavez, P., Berlin, G. and Sowers, L. (1982) Statistical Method for Selecting Landsat MSS Ratios. Journal of Applied Photographic Engineering, 8, 23-30.
- Yang, J., Weisberg, P.J. and Bristow, N.A. (2012) Landsat Remote Sensing Approaches for Monitoring Long-Term Tree cover Dynamics in Semi-Arid Woodlands: Comparison of Vegetation Indices and Spectral Mixture Analysis. Remote Sensing of Environment, 119, 62-71. http://dx.doi.org/10.1016/j.rse.2011.12.004
- Babaahmadi, A., et al. (2012) An Investigation into the Fault Patterns in the Chadegan Region, West Iran: Evidence for Dextral Brittle Transpressional Tectonics in the Sanandaj-Sirjan Zone. Journal of Asian Earth Sciences, 43, 77-88. http://dx.doi.org/10.1016/j.jseaes.2011.08.012
- Soille, P. and Pesaresi, M. (2002) Advances in Mathematical Morphology Applied to Geoscience and Remote Sensing. IEEE Transactions on Geoscience and Remote Sensing, 40, 2042-2055. http://dx.doi.org/10.1109/TGRS.2002.804618
- Babaahmadi, A. and Rosenbaum, G. (2013) Kinematics of the Demon Fault: Implications for Mesozoic Strike-Slip Faulting in Eastern Australia. Australian Journal of Earth Sciences, 60, 255-269. http://dx.doi.org/10.1080/08120099.2013.762943
- Lu, Y., Sutanudjaja, E.H., Drost, N., Steele-Dunne, S., van de Giesen, N., et al. (2014) Assimilating Data from Remote Sensing into a High-Resolution Global Hydrological Model. EGU General Assembly Conference Abstracts, Vienna, 27 April-2 May 2014, 10714.
- Schowengerdt, R.A. (2006) Remote Sensing: Models and Methods for Image Processing. Academic Press, Waltham.
- Konecny, G. (2014) Geoinformation: Remote Sensing, Photogrammetry and Geographic Information Systems. CRC Press, Boca Raton.