Journal of Intelligent Learning Systems and Applications
Vol.5 No.3(2013), Article ID:35391,8 pages DOI:10.4236/jilsa.2013.53015
Identification of Diabetic Retinal Exudates in Digital Color Images Using Support Vector Machine
![]()
1Department of Computer Science , Faculty of Science, Northern Borders University, Arar, Saudi Arabia; 2Department of Mathematics, Faculty of Science, Northern Borders University, Arar, Saudi Arabia.
Email: romanyf@aun.edu.eg
Copyright © 2013 R. F. Mansour et al. This is an open access article distributed under the Creative Commons Attribution License, which permits unrestricted use, distribution, and reproduction in any medium, provided the original work is properly cited.
Received March 3rd, 2013; revised April 3rd, 2013; accepted April 10th, 2013
Keywords: Hard Exudates; Diabetic Retinal; Support Vector Machine; Discrete Cosine Transform
ABSTRACT
Support vector machine (SVM) has become an increasingly popular tool for machine learning tasks involving classification. In this paper, we present a simple and effective method of detect and classify hard exudates. Automatic detection of hard exudates from retinal images is worth-studying problem since hard exudates are associated with diabetic retinopathy and have been found to be one of the most prevalent earliest signs of retinopathy. The algorithm is based on Discrete Cosine Transform (DCT) analysis and SVM makes use of color information to perform the classification of retinal exudates. We prospectively assessed the algorithm performance using a database containing 1200 retinal images with variable color, brightness, and quality. Results of the proposed system can achieve a diagnostic accuracy with 97.0% sensitivity and 98.7% specificity for the identification of images containing any evidence of retinopathy.
1. Introduction
Diabetic retinopathy (DR) is the most common cause of blindness and vision defects in developed countries [1]. Due to its prevalence and clinical significance the research community has attempted to improve its diagnosis and treatment by developing algorithms to perform retinal image analysis, fundus image enhancement [2-4], and monitoring [5]. Of special significance is automatic image analysis algorithms designed to detect hard exudates (HEs) [6]. Early detection enables laser therapy to be performed to prevent or delay visual loss and may be used to encourage improvement in diabetic control. Current methods of detection and assessment of diabetic retinopathy are manual, expensive and require trainedophthalmologists. Exudates are one of the primary signs of diabetic retinopathy [7,8]. Automatic exudates detection would be helpful for diabetic retinopathy screening process.
The eye is an organ associated with vision. The eye is housed in a socket of bone called the orbit and is protected from the external air by the eyelids [9]. A cross section of the eye is shown in Figure 1. Light entering the eye through the pupil is focused on the retina. The retina is a multi-layered sensory tissue that lines the back of the eye. It contains millions of photoreceptors that capture light rays and convert them into electrical impulses [10]. These impulses travel along the optic nerve to the brain where they are turned into images. In a normal FI, the optic disk is brighter than any part of the retina and is normally circular in shape. It is also the entry and exit point for nerves entering and leaving the retina to and from the brain. A typical retina fundus image looks like the one shown in Figure 2. The bright optic disc and the vascular network can clearly be seen in the image.
The paper is organized as follows. Section 2 provides a related work on diabetic retinal exudates. The technique uses Discrete Cosine Transform (DCT) and Fast Fourier Transform (FFT) to create feature vector for retina images in Section 3, and diabetic retinal classification by color histogram clustering technique and SVM in Section 4. Finally, Section 5 presents the results and discussion of the experiments that have been conducted to compare the performance of the diabetic retinal exudates based on SVM and traditional methods.
2. Related Works
Automatic exudates detection would be helpful for dia-
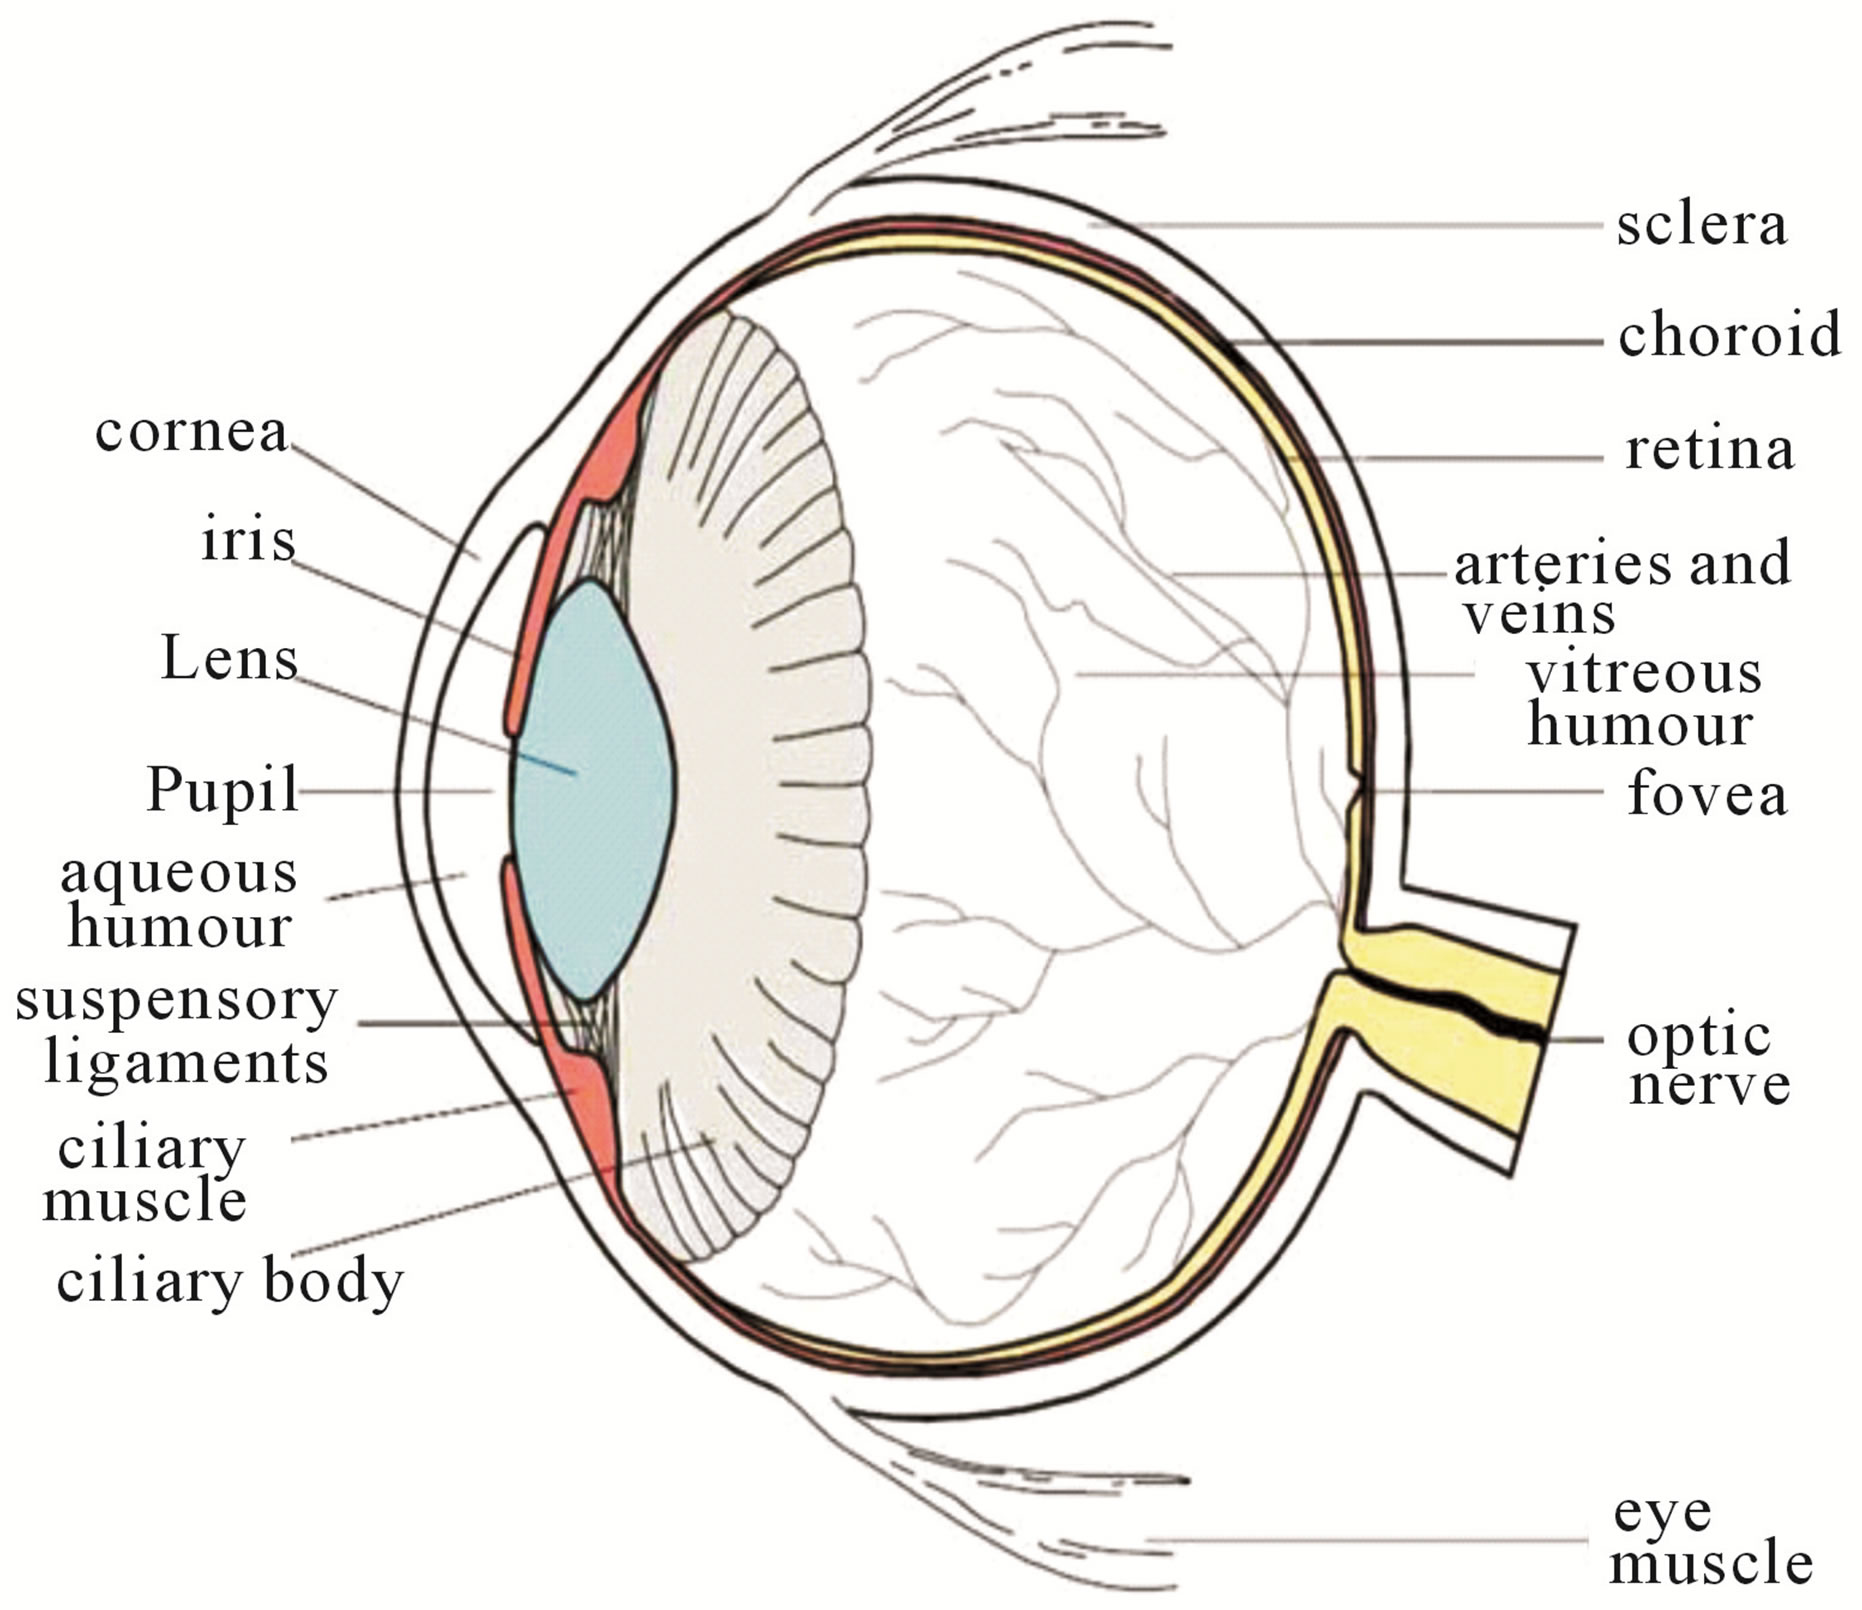
Figure 1. Cross sectional diagram of human eye [1].
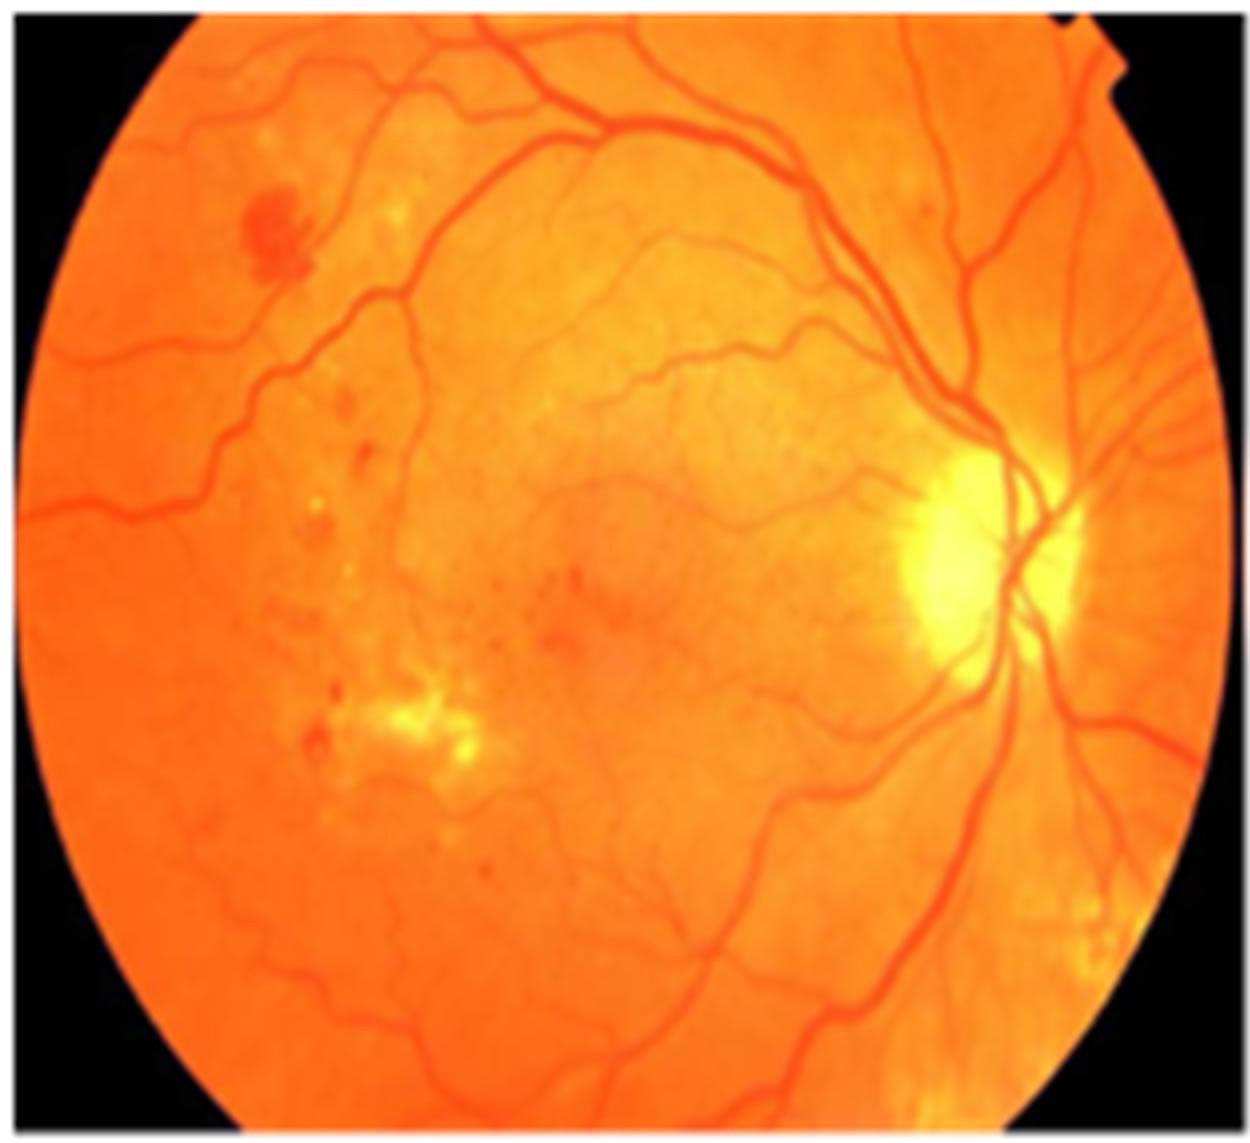
Figure 2. Retinal fundus image.
betic retinopathy screening process. Gardner et al. proposed an automatic detection of diabetic retinopathy using an artificial neural network. The exudates are identified from grey level images and the fundus image is analyzed using a back propagation neural network. The classification of a 20 × 20 region is used instead of a pixellevel classification [11].
In the preprocessing step, adaptive, local, contrast enhancement is applied. The optic disc, blood vessels and fovea detection are also localized [12]. Wang et al. used color features on a Bayesian statistical classifier to classify each pixel into lesion or non-lesion classes [13]. Huiqi Li et al. proposed an exudates extraction technique by using a combination of region growing and edge detection techniques. The optic disc is also detected by Principal Component Analysis (PCA). The shape of the optic disc is detected using a modified active shape model [14]. Usher et al. detected the candidate exudates region by using a combination of RRGS and adaptive intensity thresholding [15].
Goh et al. used the minimum distance discriminated to detect the exudates. The spectrum feature center of exudates and background are computed and then the distance from each pixel to class center is calculated. The pixel is classified as exudate if it falls within the minimum distance [16]. Ege et al. used a median filter to remove noise. Bright lesions and dark lesions are separated by thresholding. A region growing algorithm is used to locate exudates. Bayesian, Mahalanobis and K-Nearest Neighbor classifier were tested. From these experiments, the Mahalanobis classifier was shown to yield the best results [17]. The comparative exudate classification using Support Vector Machines (SVM) and neural networks was also applied. They showed that SVM are more practical than the other approaches [18].
Many techniques have been performed for exudate detection, but they have limitations. Poor quality images affect the separation result of bright and dark lesions using thresholding and exudate feature extraction using the RRGS algorithm, while other classification techniques require intensive computing power for training and classification. Furthermore, based on experimental work report in the previous work, most of techniques mentioned above worked on images taken when the patient had dilated pupils. Good quality retinal images with large fields that are clear enough to show retinal detail are required to achieve good algorithm performance. Low quality images (non-uniform illumination, low contrast, blurred or faint images) do not give good results even when enhancement processes are included. The examination time and effect on the patient could be reduced if the automated system could succeed on non-dilated pupils.
Tang et al. [19] used watershed algorithm for segmentation of splats, a collection of pixels with similar color and spatial location. The connected vasculatures were removed by automated vessels segmentation method. The KNN classifier was applied with 42 features in training and reduced to 7 features using forward feature selection method in testing stage. A set of 20 images from DRIVE database [20] was used for training and then 1200 images from MESSIDOR database [21] are used in testing.
Zhang and Chutatape [22] proposed the bottom-up strategy to detection of bright lesions and the top-down strategy in dark lesions detection. In hemorrhage detection, hemorrhages are located in the ROI firstly by calculating the evidence value of every pixel using SVM. The kernel PCA and PCA are used to selection features. SVM Classifier with kernel yields 90.6% true positive while PCA is 89.1%.
3. Feature Extraction
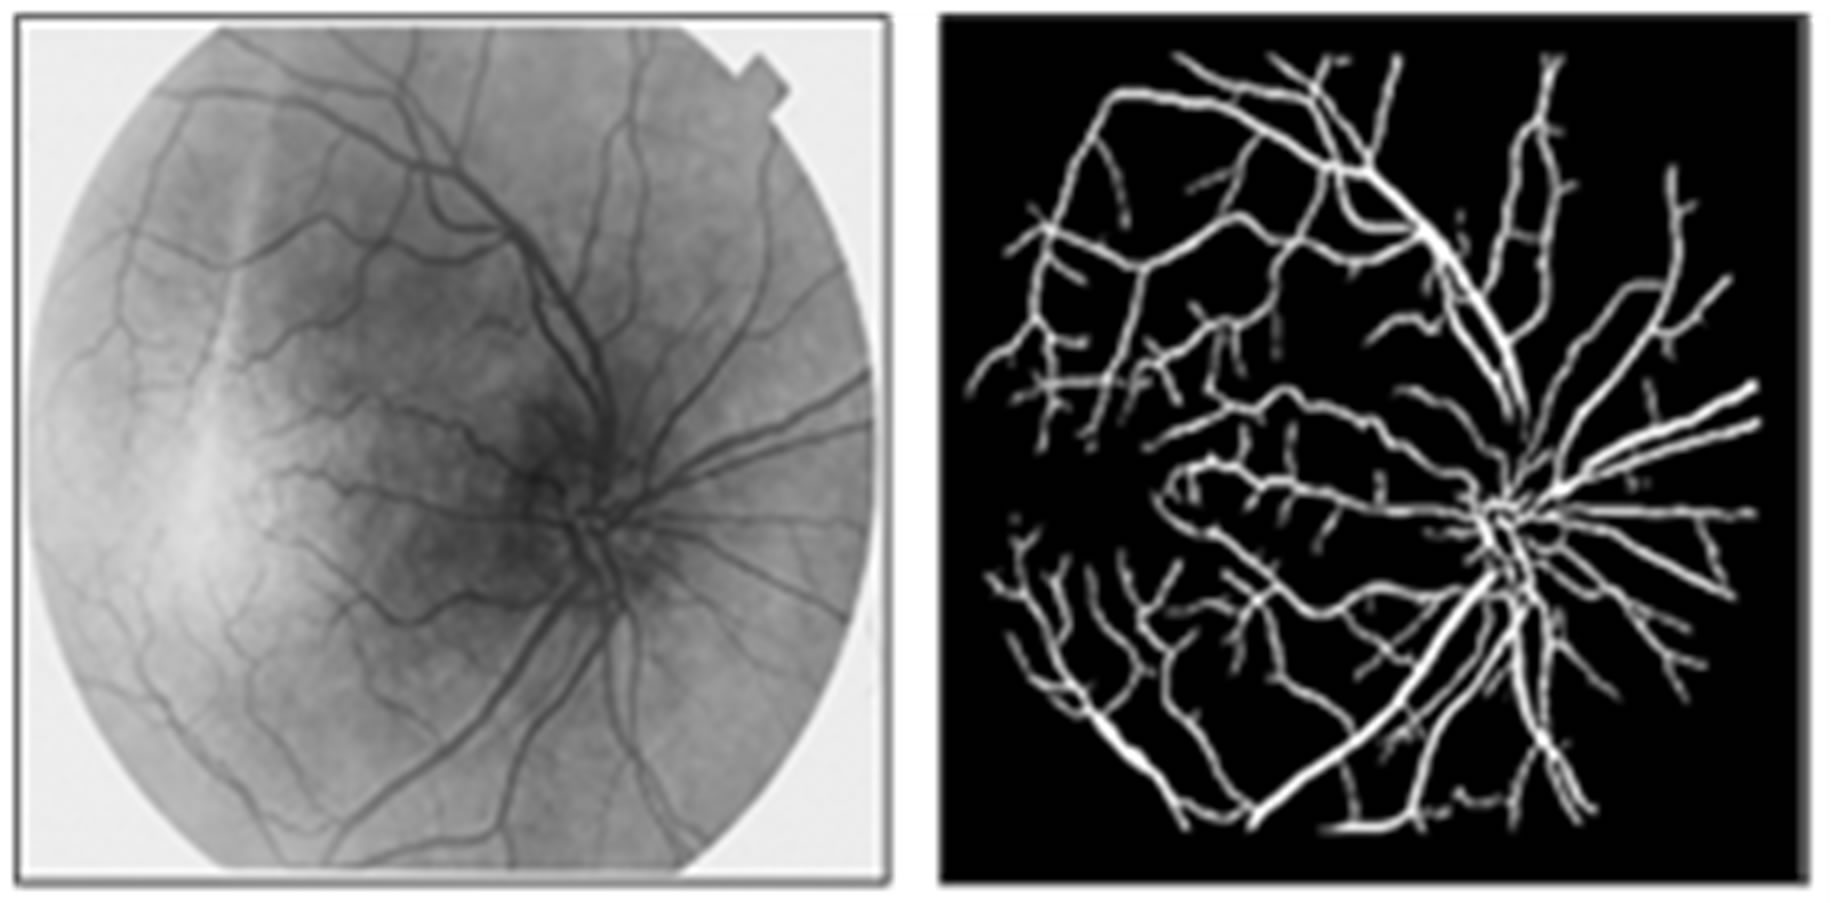
In this section we applied the stages of preprocessing that describe in [23]. Figure 3 shown the steps of segmentation and enhancement retina image. We asked ophthalmologists how to identify exudates in an image so that
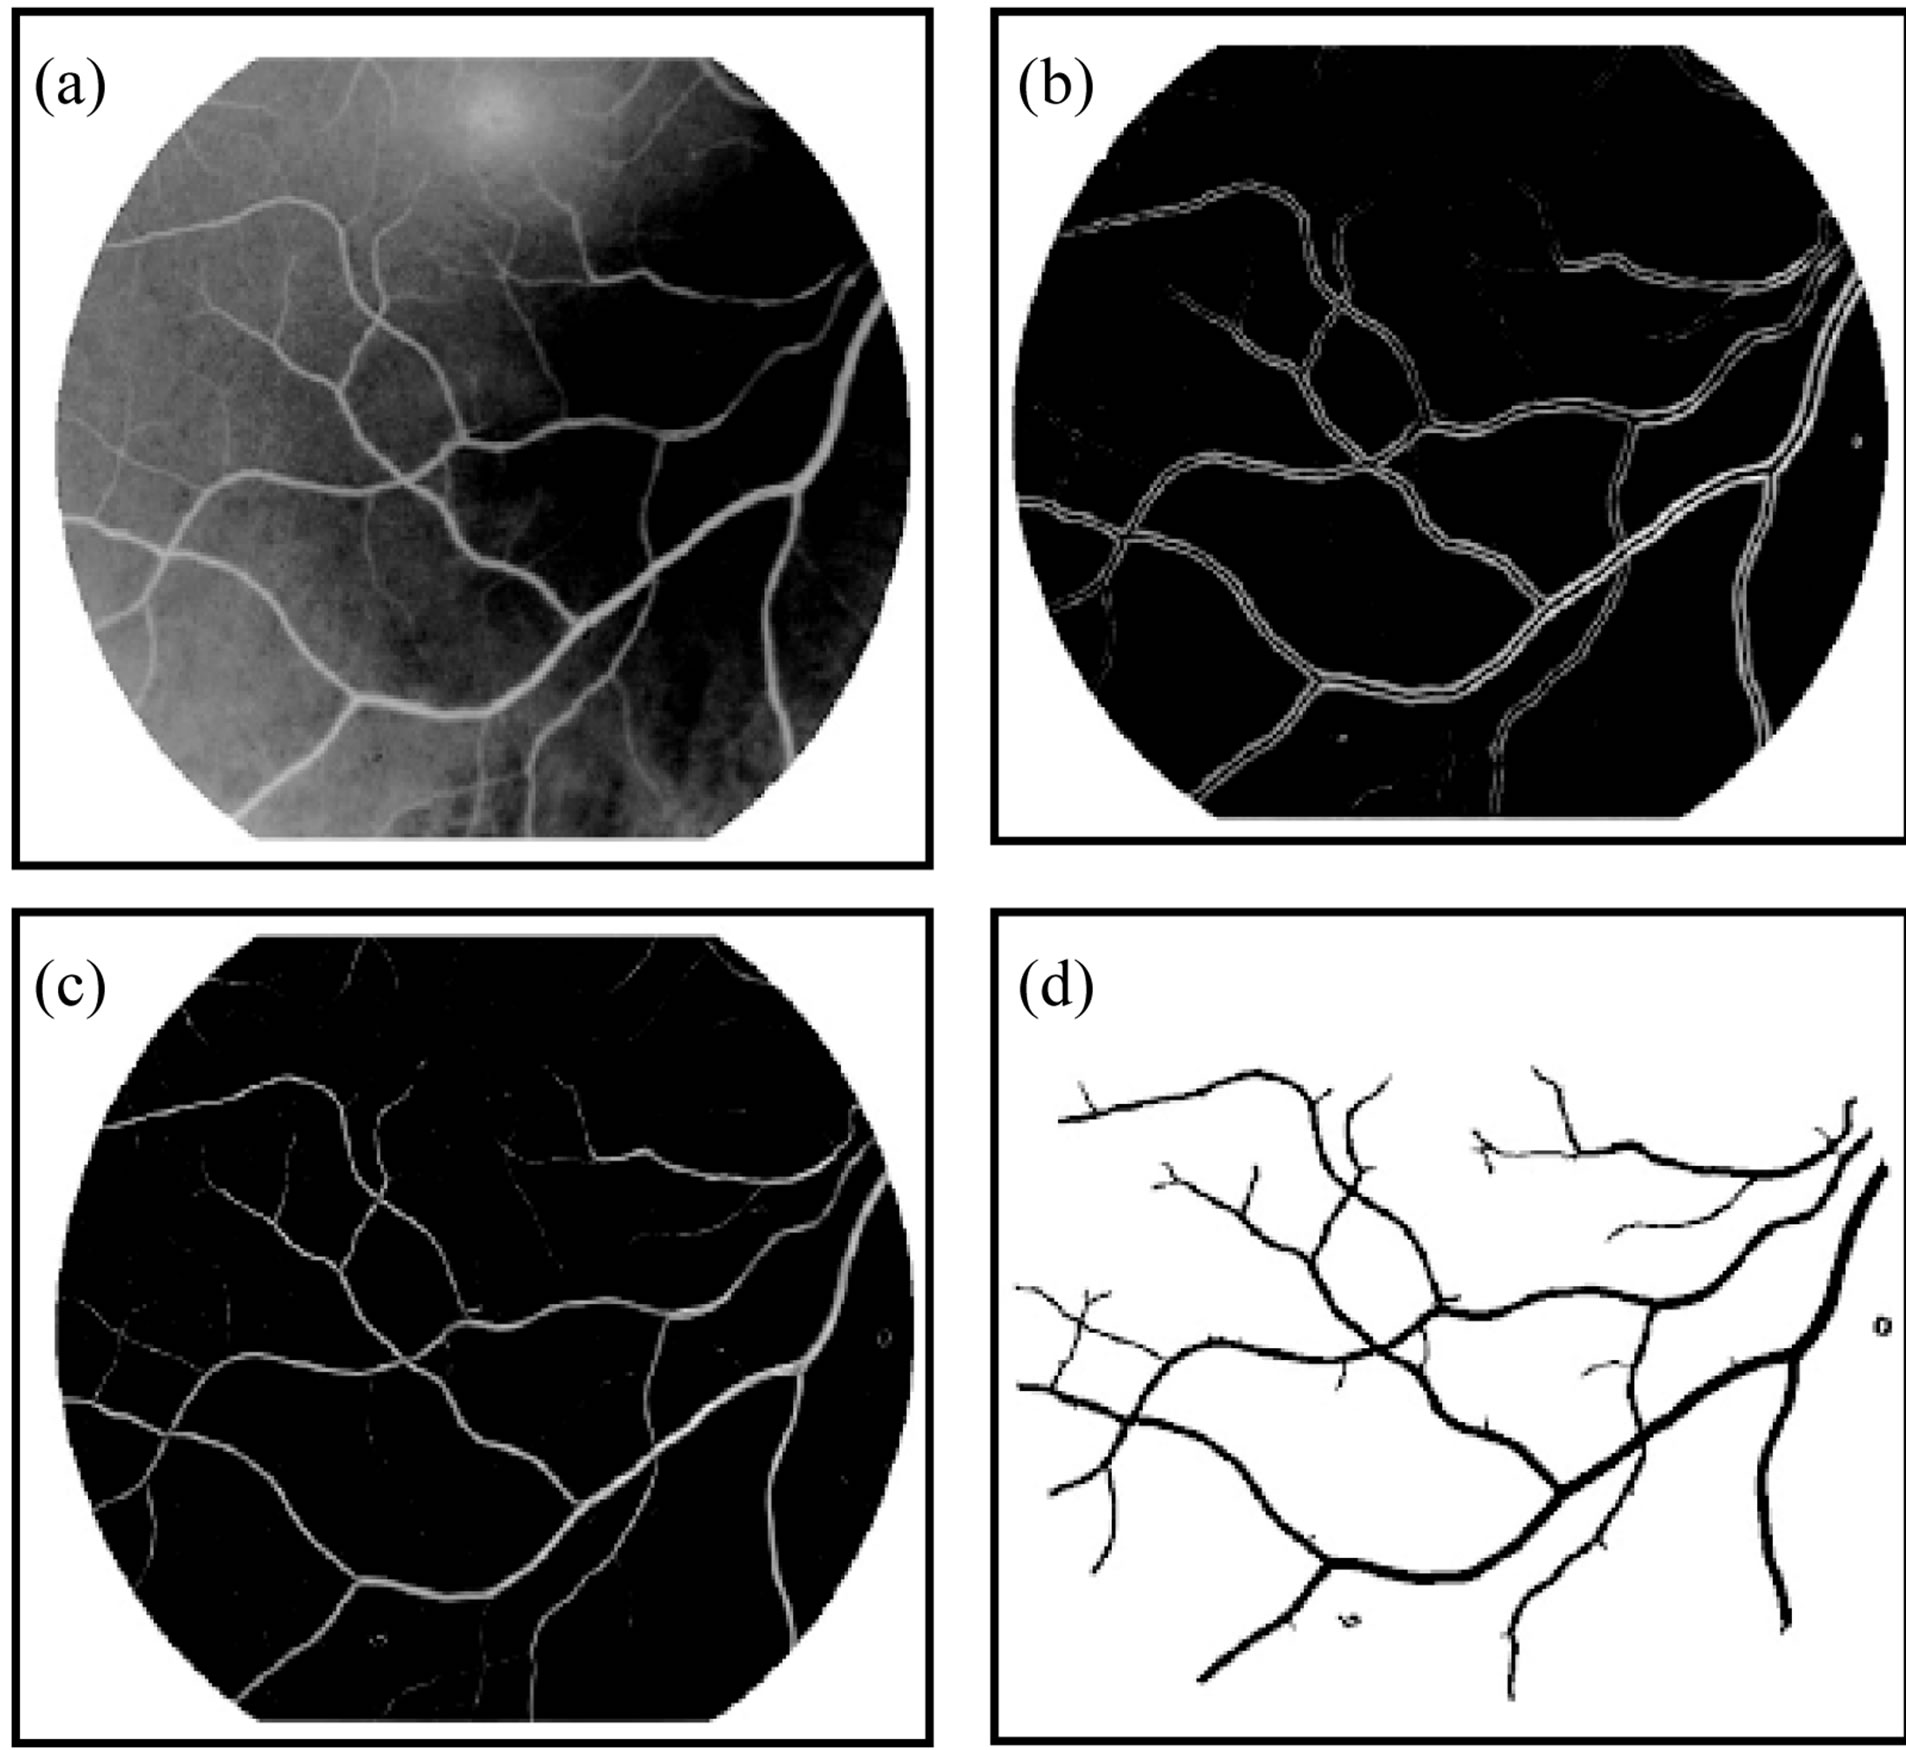
Figure 3. The segmentation method and enhancement (a) Original image; (b) Enhanced image; (c) Binary image; (d) Thinned and separated vassals image.
our feature selection would reflex “ophthalmologists” expertise. We found that color, shape and texture are among those top features they looked at. To differentiate exudates pixels from non-exudates pixels, we attempt to mimic ophthalmologist expertise by extracting these relevant and significant features. Features are empirically selected and used as input for SVM clustering.
3.1. Feature Extraction and Analysis Using DCT
The most commonly employed method of feature extraction is the Crossing Number (CN), with comparison with other methods which are based on Fourier transform of retinal images and Two-dimensional Wavelet Transform [24] more efficient. The concept this method involves is the use of the skeleton image where the ridge flow pattern is eight-connected.
The landmarks are extracted by scanning the local neighborhood of each ridge pixel in the image using a 3 × 3 window. The CN value is then computed, which is defined as half the sum of the differences between pairs of adjacent pixels in the eight-neighborhoods. Using the properties of the CN, shown in Table 1, the ridge pixel can then be classified as a ridge ending, bifurcation or non-minutiae point. For example, a vascular pixel with a CN of one corresponds to a ridge ending, and a CN of three corresponds to a bifurcation.
Identification of diabetic retinal in digital color images is made through the frequency domain instead of the traditional spatial domain. The FFT and DCT transforms are chosen for diabetic retinal exudates image fingerprint analysis. Fourier transform plays a vital role in image processing applications. It contains most of the informa-
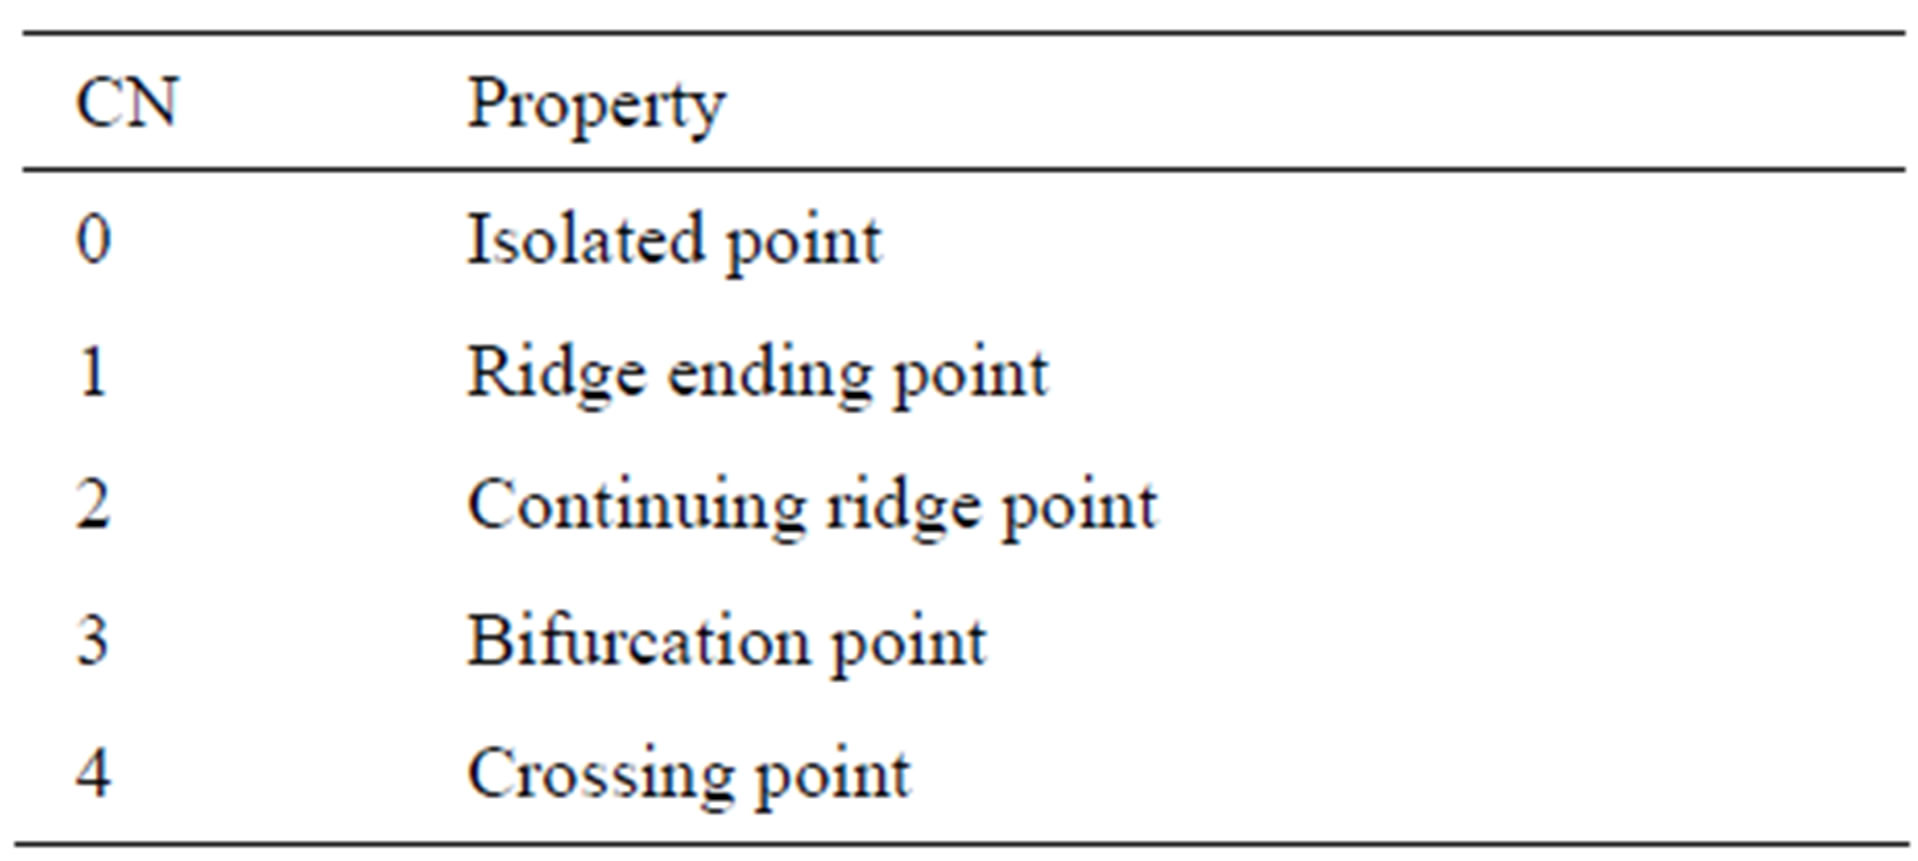
Table 1. Properties of the crossing number.
tion in the spatial domain image. DCT transforms an image from the spatial domain to the frequency domain and provides a better approximation of the image. DCT transforms a set of data that is sampled at a given sampling frequency to frequency components. The fundamental frequencies of these transformations are used to identify the infected or uninfected. The two FFT pair dimension is given as:
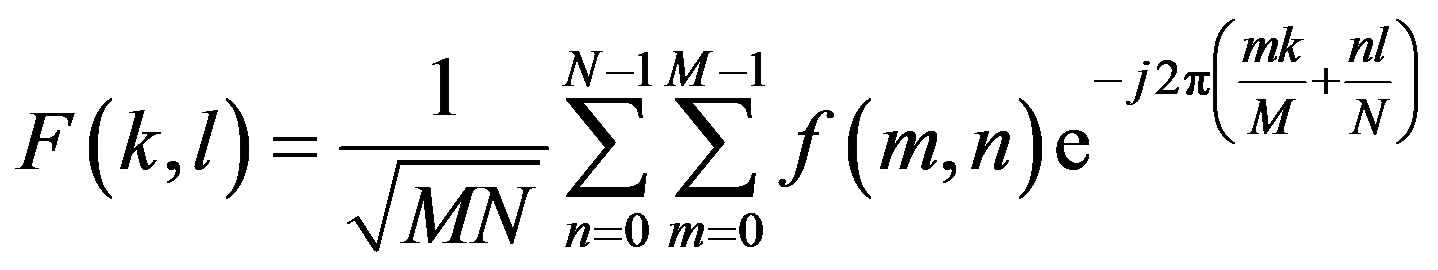
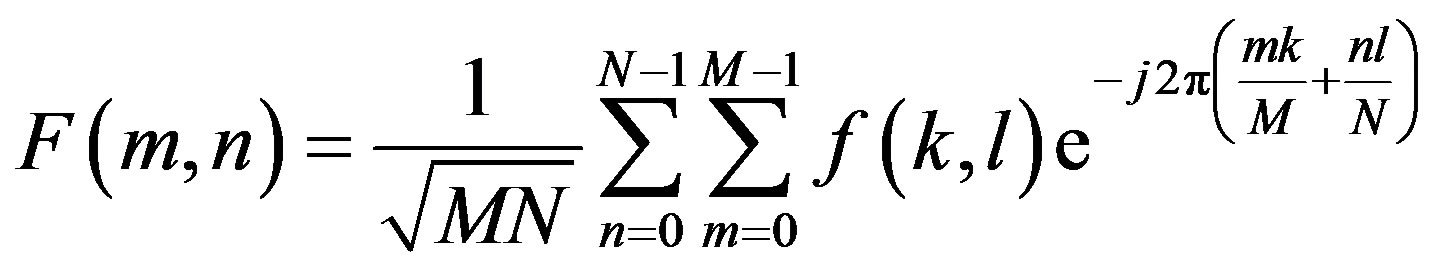
where  is image intensity of size M × N and the variable k and l are the frequency variable [25] and
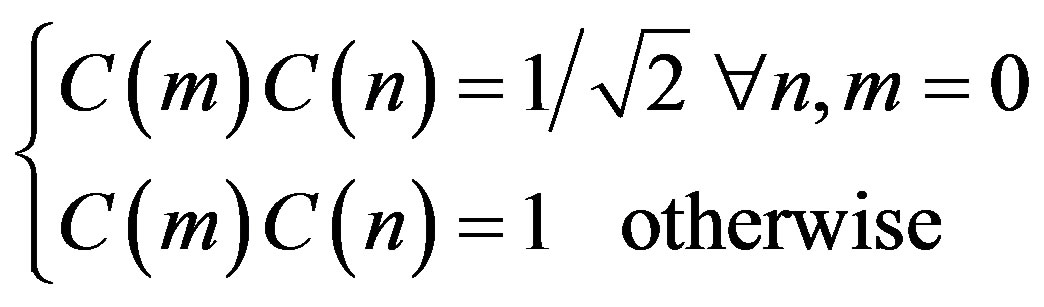
The discrete cosine transform (DCT) is a Fourier-related transform similar to the Discrete Fourier Transform (DFT), but using only real numbers. The equation for the two-dimensional DCT is
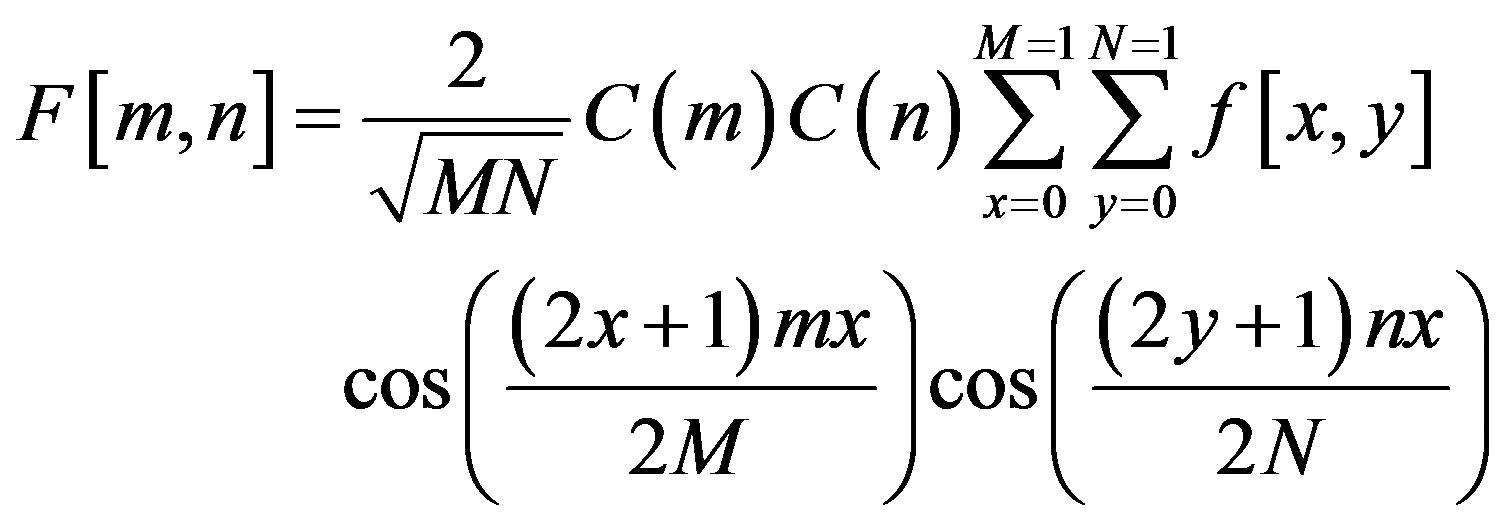
where
The two dimension DCT is computed by applying one dimension DCT (vertically) to columns and the resulting vertical DCT is applied with one DCT (horizontally). Then an SVM classifier is employed to classify infected or uninfected vessels in the diabetic retinal exudates images.
3.2. Principal Component Analysis (PCA) [26]
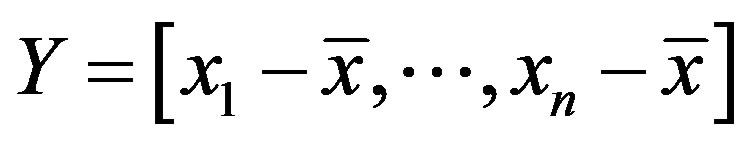
Once a database of images of diabetic retinal is obtained, a test print can be recognized by comparing a set of unique characteristics like the ridge density or the number of broken ridges. These characteristics are called the principal components or eigenvalues. These eigenvalues can be obtained by principal component analysis. Every original print transforms into an Eigen value and the print can be reconstructed by combining these Eigen values. Principal component analysis involves the steps of prediction, redundancy removal, feature extraction and data compression. Also (PCA) is a very well-known approach for reducing the dimensionality of data. For applying PCA to images, the image is first represented as a column of vectors. A matrix is formed by concatenating the column of training set images. Let this matrix be ,
,
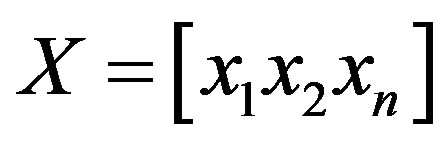 Where
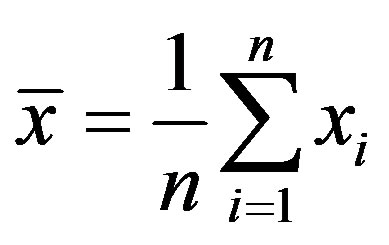
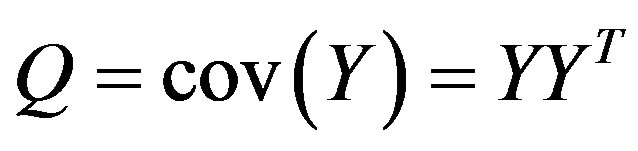
Where  is the ith column vector representing the ith training image. Then, the mean is subtracted from each column and the covariance matrix is computed. Let the mean image be:
The covariance matrix 
Finally, eigenvalue decomposition is performed to find the highest ranking (based on eigenvalues) eigenvectors. These vectors, known as principal components span the low dimensional subspace. Out of these eigenvectors m most significant vectors are chosen, let these vectors be . The value of m is chosen by considering the cumulative sum of the eigenvalues. The features of an image x is then computed by projecting it onto the space spanned by the eigenvectors as follows
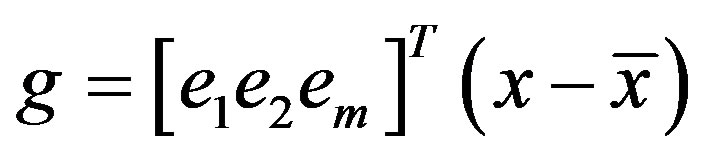
where g is an m dimensional vector of features. This feature vector g is used during training and classification.
4. Color Histogram Clustering Technique
Color histogram thresholding is used to detect exudates. This is done by splitting the color fundus image into a number of overlapping blocks. Thresholding is done to detect exudates [27]. Accurate choice of threshold value can be used to differentiate between hard and soft exudates. The characteristics of the histogram are observed for each non overlapping block. It is seen that the histogram of the blocks containing exudates ranges approximately between 90 and 175, whereas the histogram of the blocks not containing exudates ranges between 0 to 160 as shown in Figures 4 and 5.
Diabetic Retinal Classification by SVM
Support Vector Machines (SVMs) are classifiers that con-
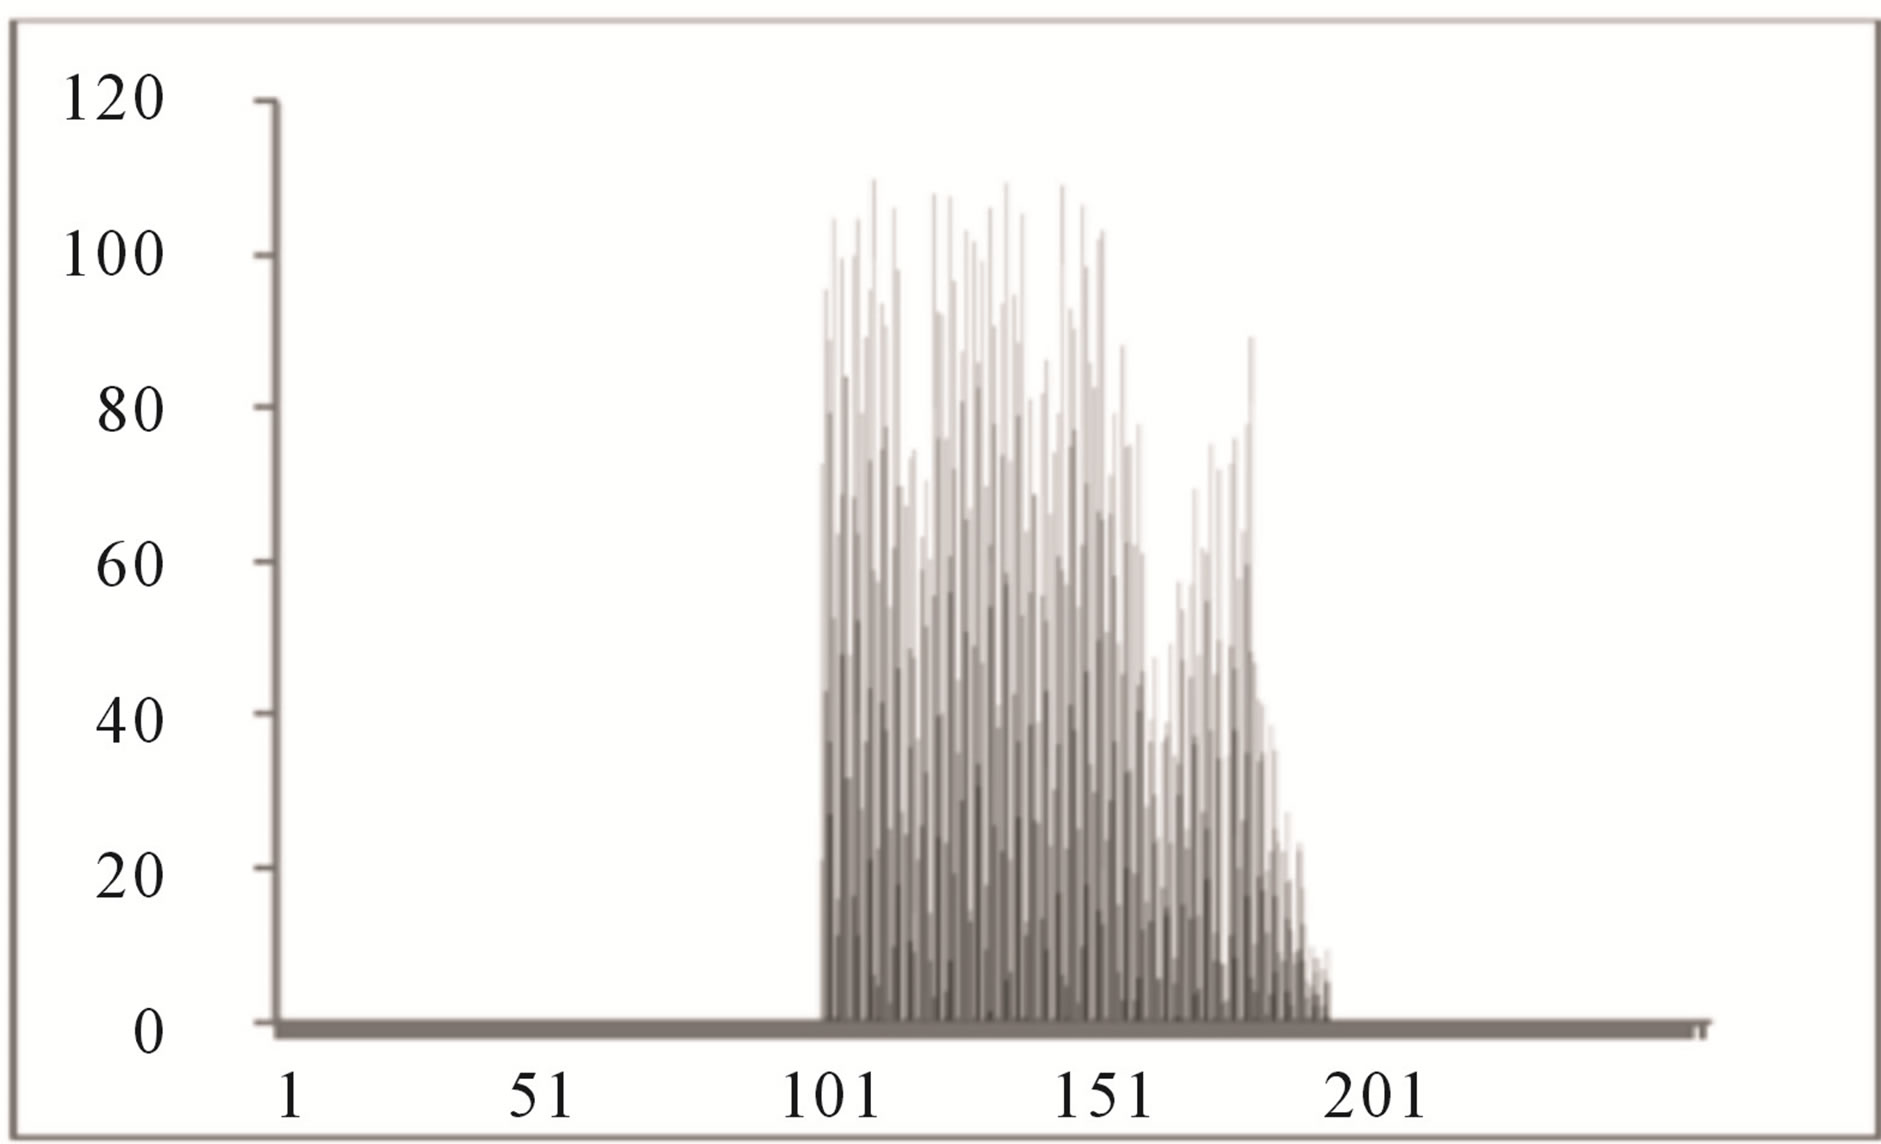
Figure 4. Histogram of block containing exudates.
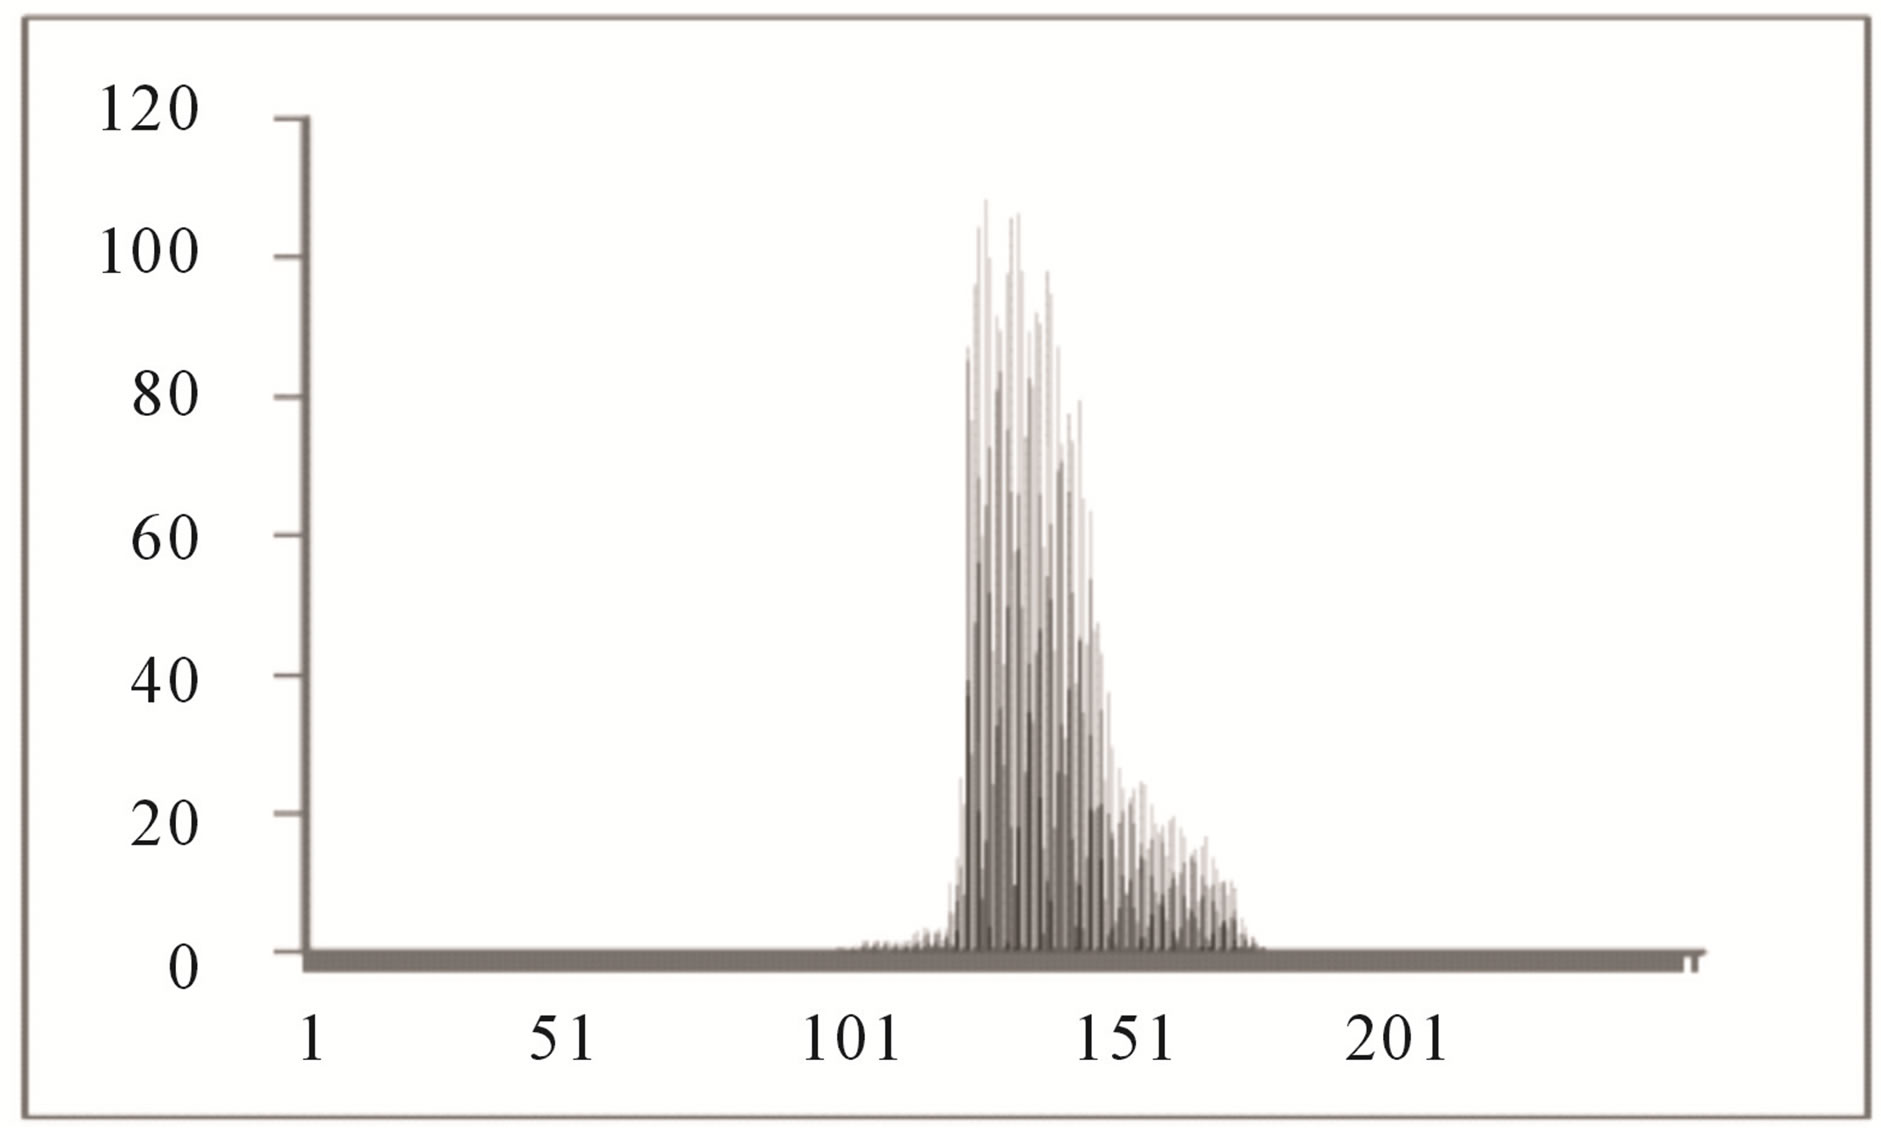
Figure 5. Histogram of block not containing exudates.
struct a maximal separating hyper plane between two classes so that the classification error is minimized. For linearly no separable data the input is mapped to highdimensional feature space where they can be separated by a hyper plane. This projection into high-dimensional feature space is efficiently performed by using kernels. For instance-label pair  with
with  for
for  where n is the number of instances, the following optimization problem needs to be solved for SVMs
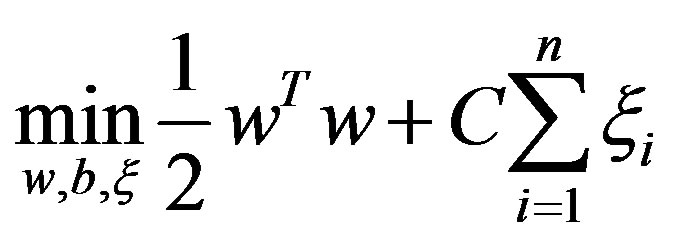
subject to

In the above equation,  is decision hyperplane normal vector, C is the penalty parameter for error term and
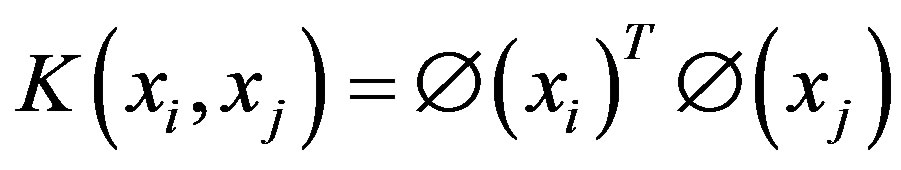
  maps a traininginstance
  to higher dimensional space. The kernel K is defined as:
In this paper, a Radial Basis Function (RBF) kernel was used. RBF is defined as:
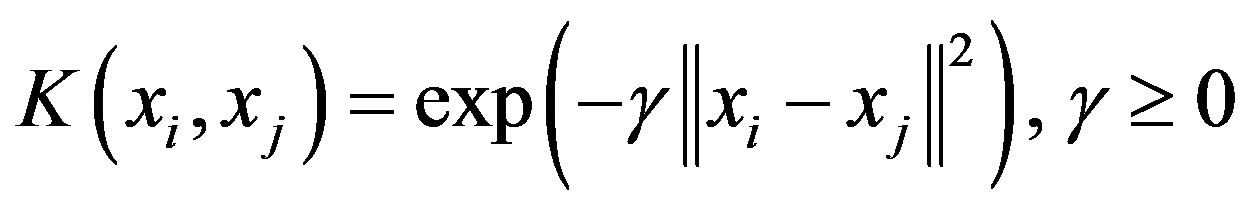
where  is kernel parameter, the spread of a therefore in the above formulation there are two parameters, C and
  to control the performance of the classifier [28,29].
5. Experimental
Figure 6(a) shows a sample original image from ten normotensive images. Figure 6(b) shows the segmentation image of the original image (a). Figure 6(c) shows the thinning of image (b). Figure 6(d) shows the detection results of number of terminal, number of bifurcation and number crossover landmarks points in image (c).
In evaluating the accuracy and appropriateness of the proposed technique in detecting BPs and CPs from FI, the proposed techniques have been applied to two publicly available FI databases, namely the Stare databases [22]. A performance evaluation of the proposed method has been done with the help of receiver operating characteristics (ROC). Other methods have also been investigated for both of the image databases for comparison.
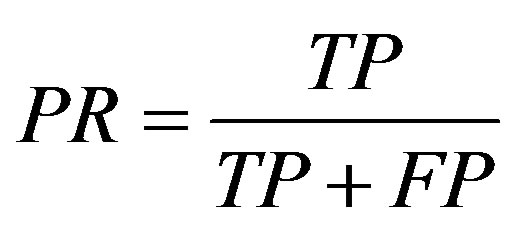
Below are some of the used acronyms and the set of mathematical definitions [30-32] used in the analysis. The performance of the proposed algorithm is tested in terms of True positive detections (TP), (TN) true negative detections, (FP) false positive detections, (FN) false negative detections, (ToP) total positives (manually counted from the image), (MP) missed points, (PR) precision (accuracy), (FR) false activation rate, (TR) true positive rate, (SN) sensitivity, (MR) missed rate and (FR)
 (a)
(a)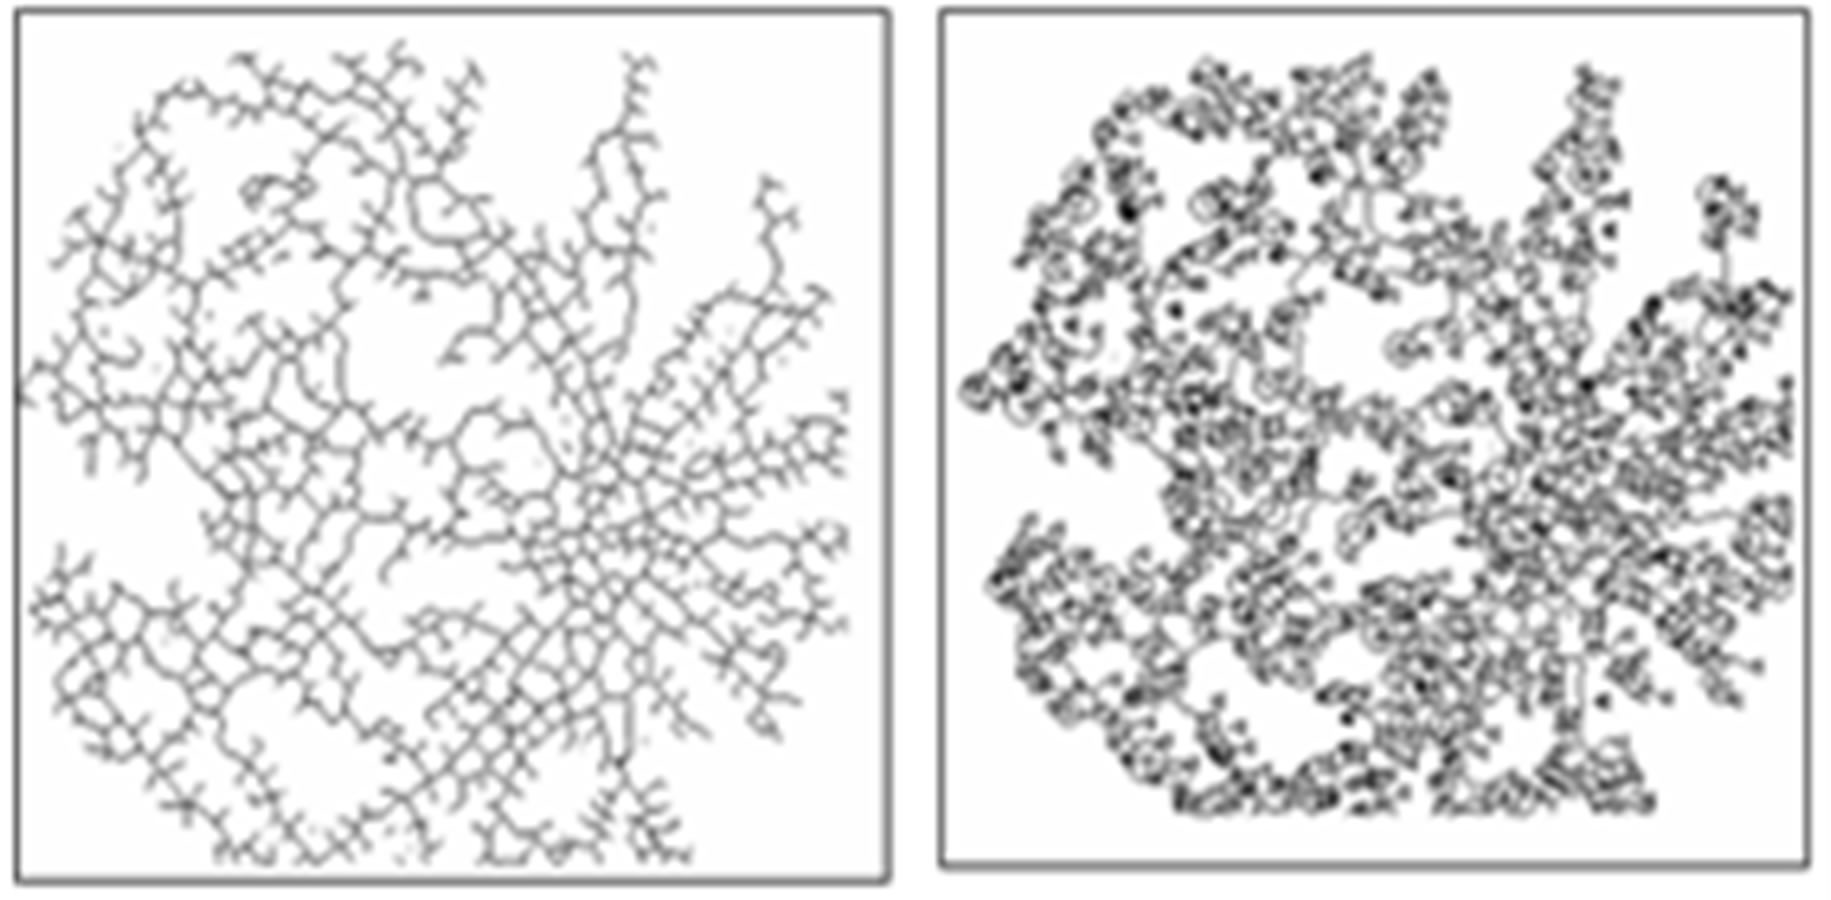 (b)
(b)
Figure 6. (a) The normotensive original image; (b) the segmentation image; (c) the thinning image; (d) the detection of landmarks points in image (c).
false activation rate.
True positive (TP) indicates that the patient suffers from the disease and test result was also positive, false positive (FP) indicates that the patient does not suffer from the disease and was diagnosed as positive, true negative (TN) indicates that the patient does not suffer from the disease and was diagnosed as negative, false negative (FN) indicates that the patient suffers from the disease but diagnosed as negative. These metrics are given as
 ;
; ;
; ;
;
The sum of the true positive and false negative rate is the number of patients suffering from the disease. And the sum of true negative and false positive is the number of patients not suffering from the disease. Sensitivity is the measure of percentage of cases detected and specificity is the measure of correctly classified healthy persons. In addition, performance of algorithm was measured with receiver operating characteristics (ROC) curves. The ROC curve plots the sensitivity against specificity of a system. ROC is an indication of the capability of a system to distinguish those images containing diabetic retinopathyand normal images. Figure 7 shown the ROC curves performance on database.
Results obtained from the application of other methods and the proposed method on FIs contained in the Stare databases [26] are shown in Tables 2-5. Each of tables contains results for one of the four techniques.
Results shows using of DCT for feature sets extracted, and each of this feature set is presented to all the SVM classifiers. The results demonstrate that high recognition accuracy can be achieved using DCT + SVM approach for other methods recognition.
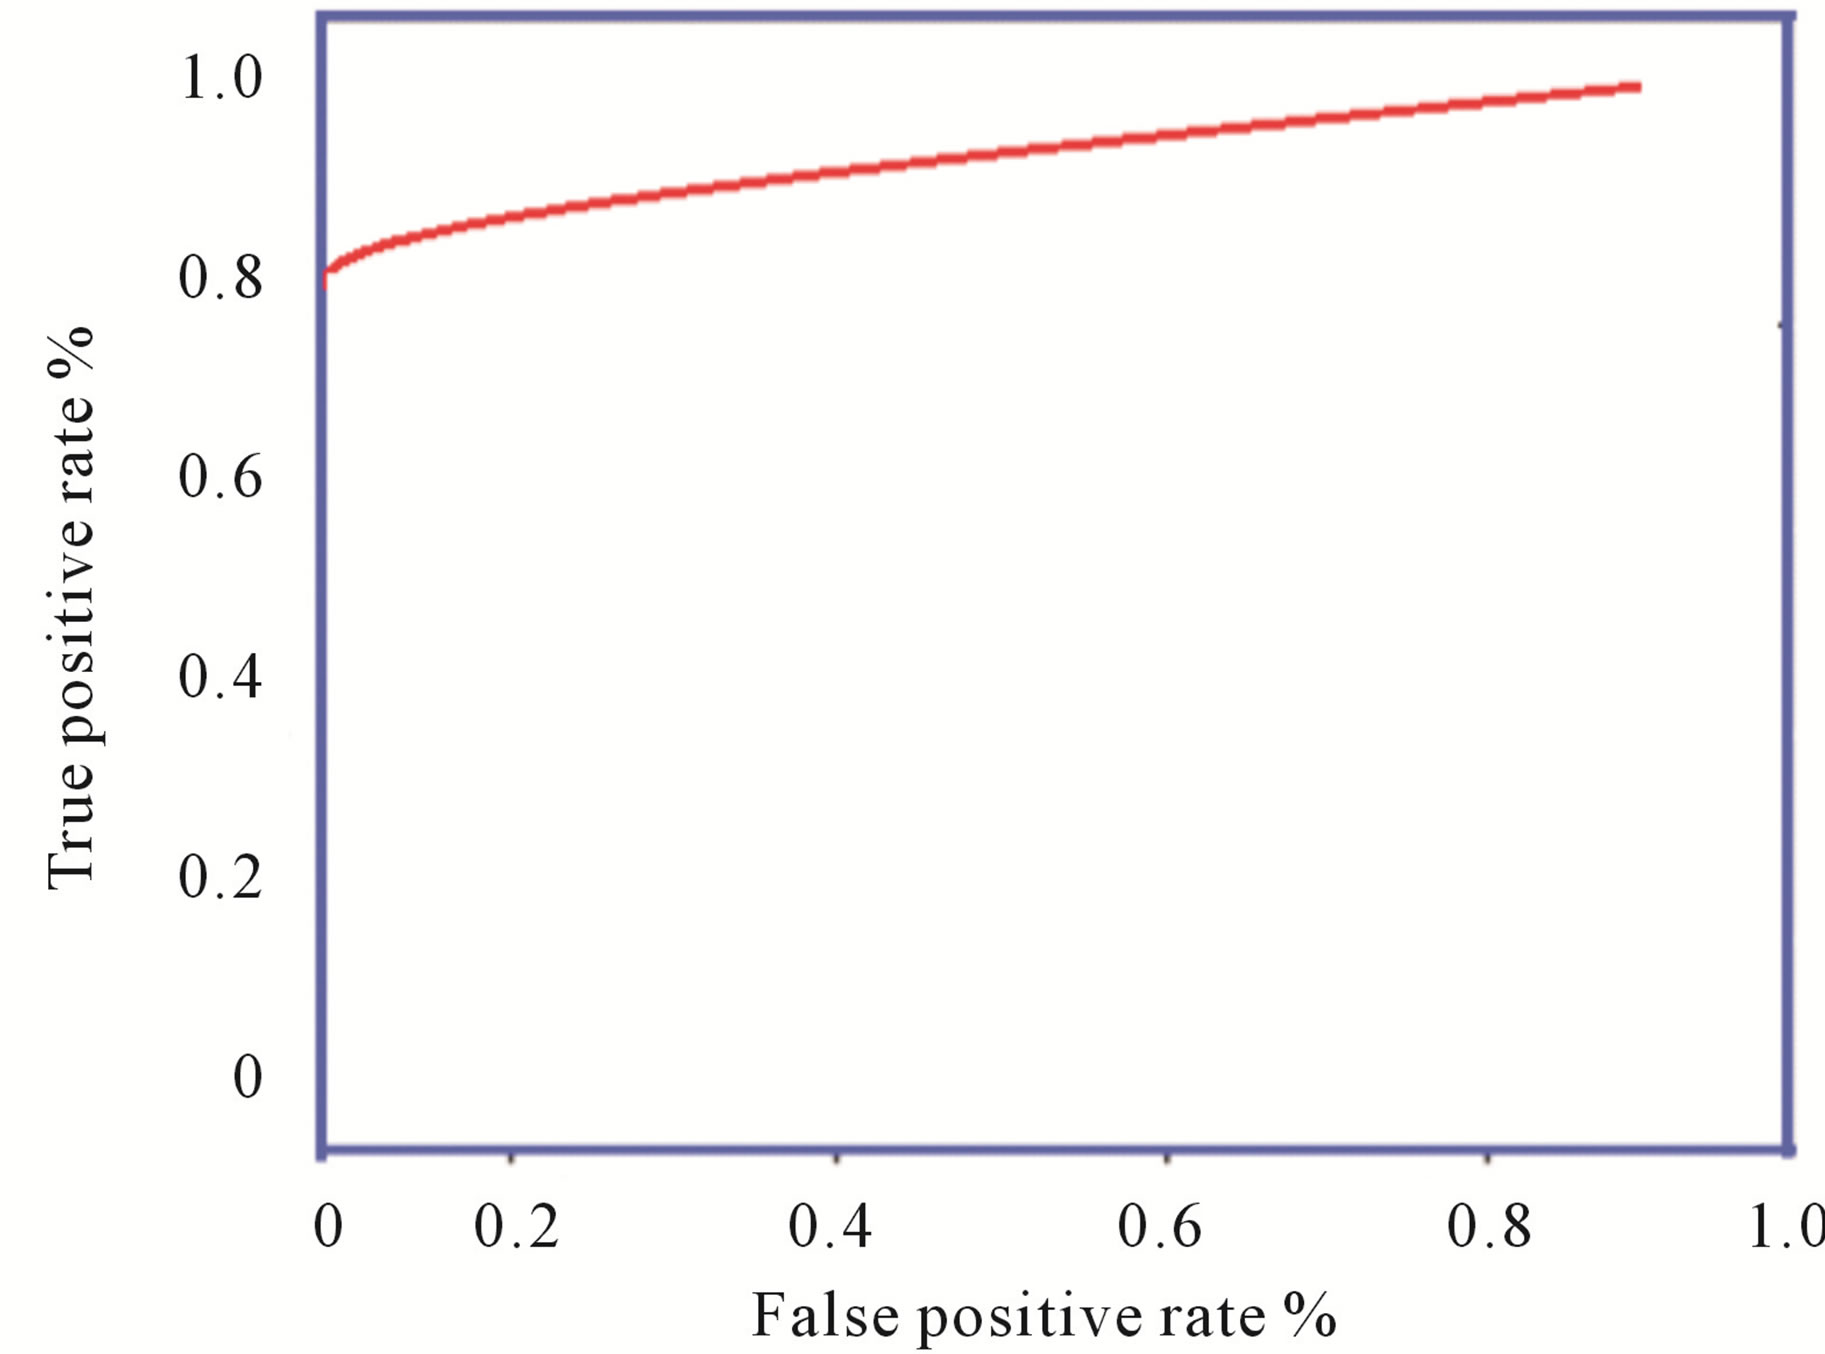
Figure 7. ROC curves: Image level performance on database.

Table 2. The ROC produced by the SCN for stare database [26].
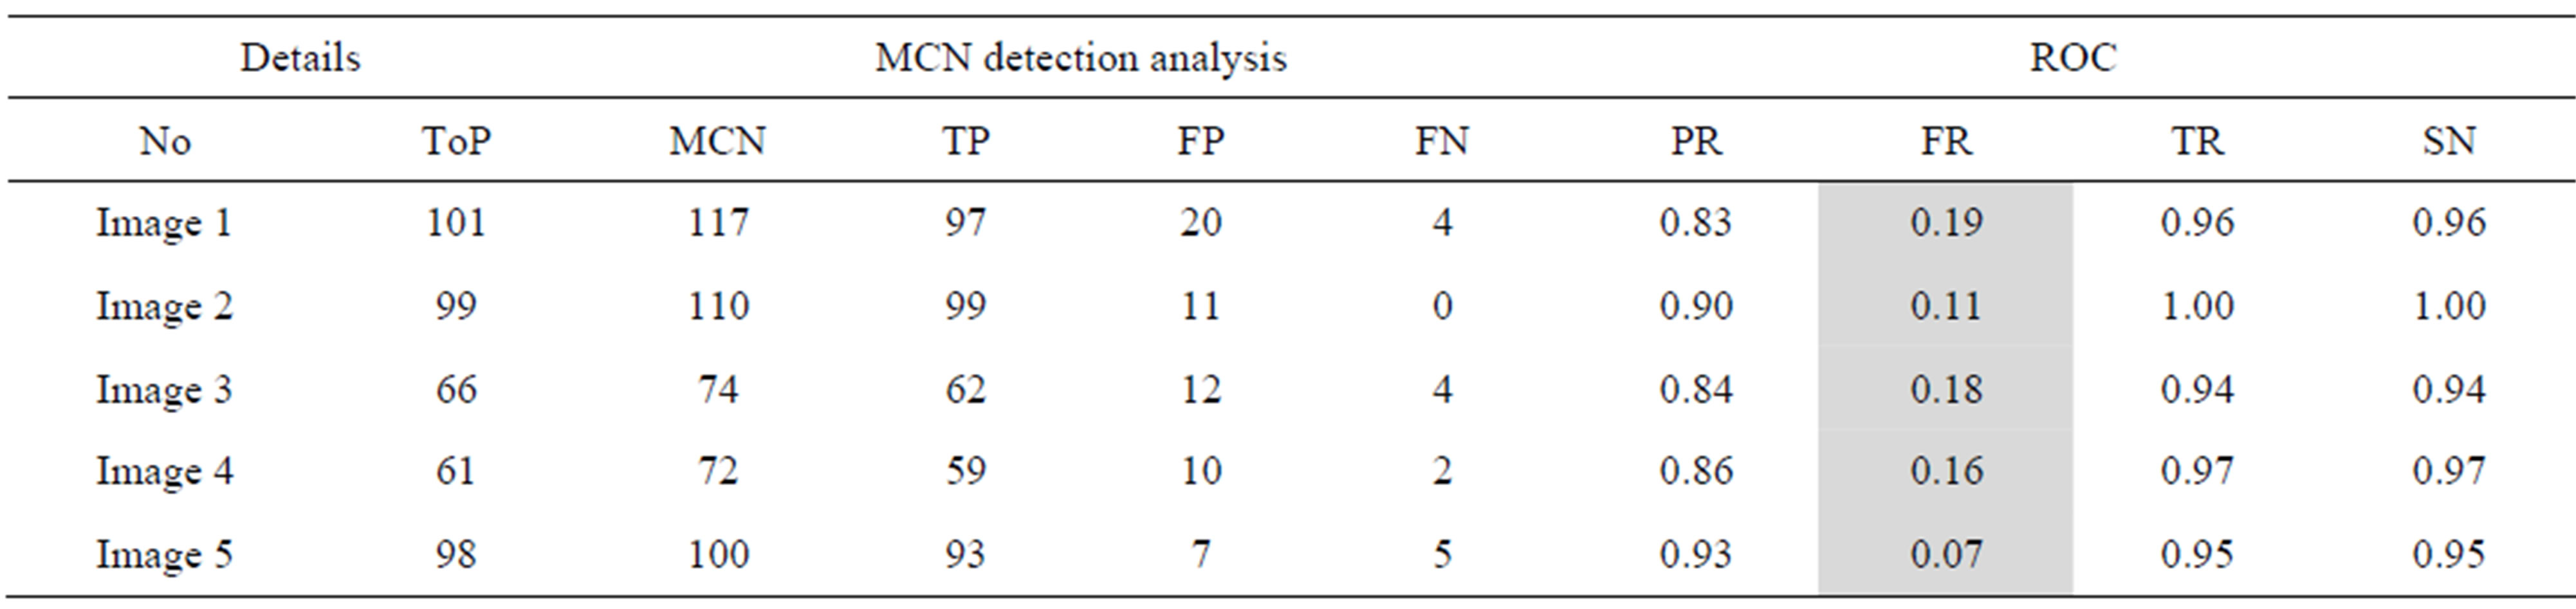
Table 3. The ROC produced by the MCN for stare database [26].
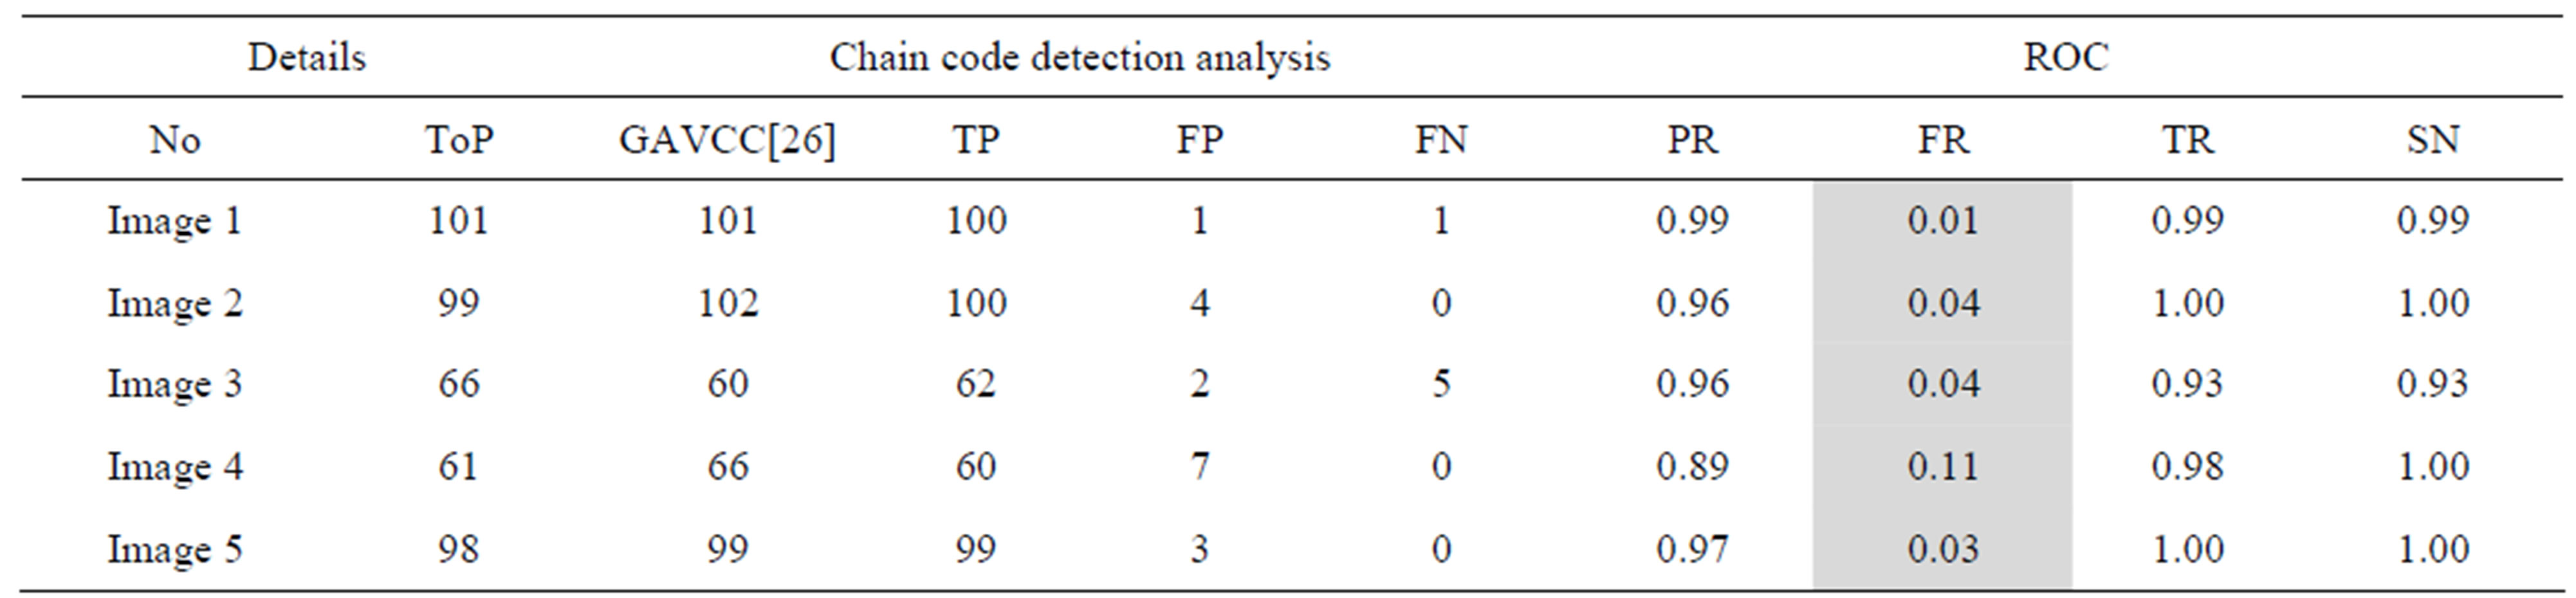
Table 4. The ROC produced by GAVCC for stare database.
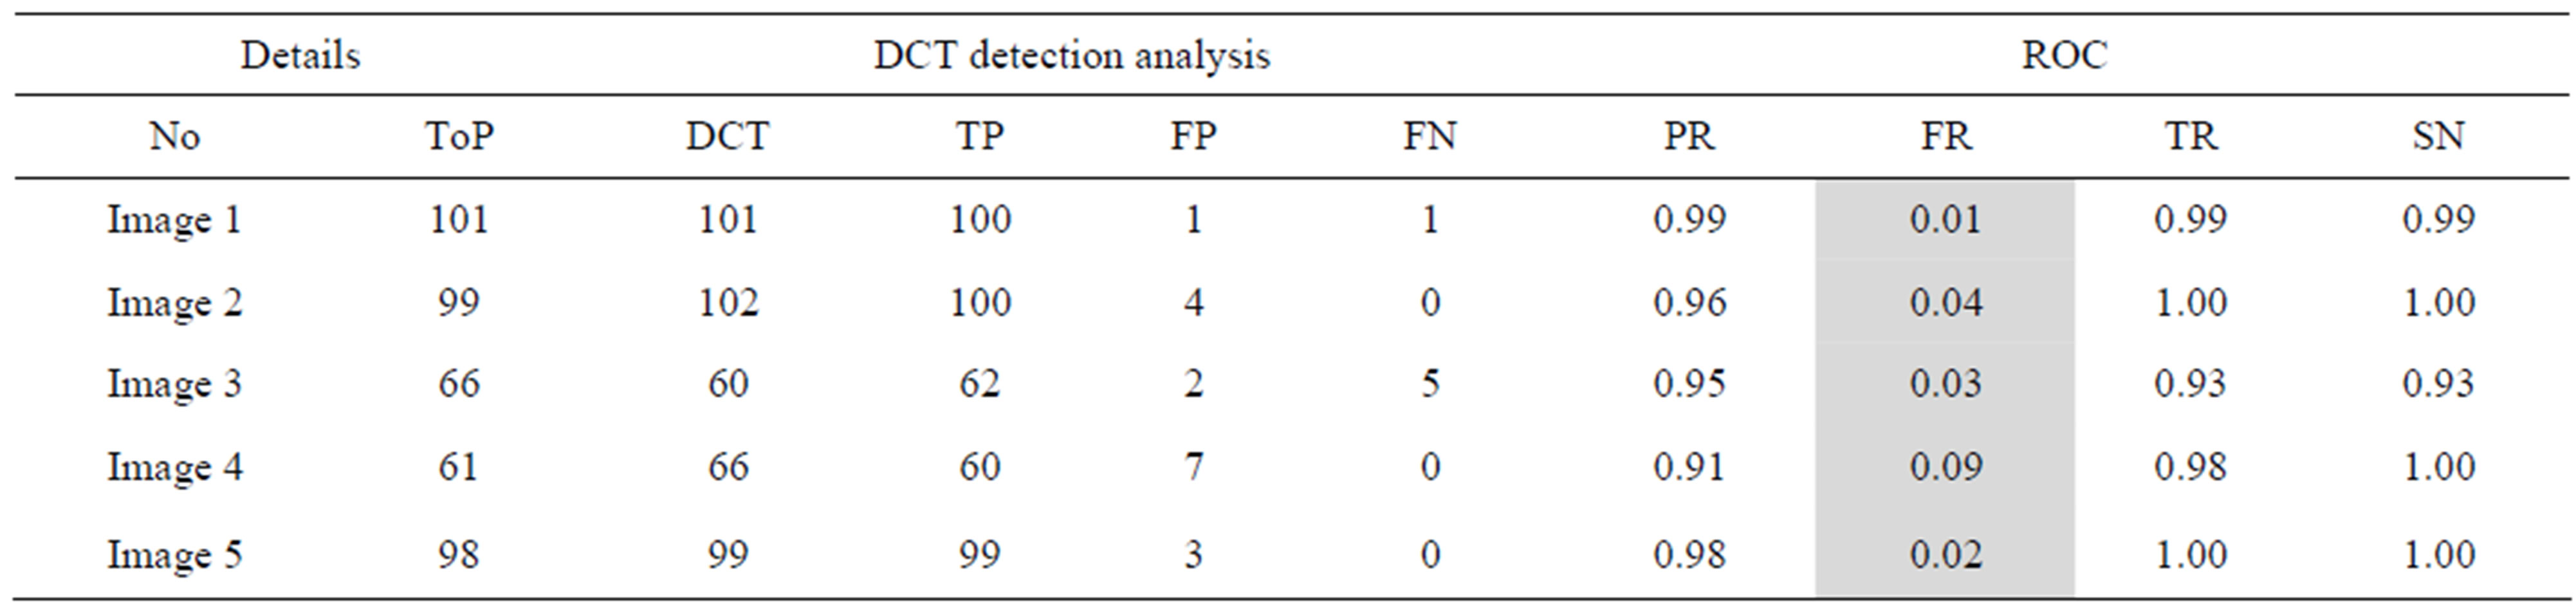
Table 5. The ROC produced by the proposed method for stare database [26].
The proposed method tends to reduce the FR without a simultaneous reduction in PR and TR by making use of the SCN and MCN methods in detecting candidate BPs and CPs. Results obtained with the CCN method are shown in Tables 2 and 3 for the same five images for which the SCN, MCN and chain code based genetic algorithm results are shown in Table 4. Table 5 shows improving algorithm with DCT with SVM is more efficient but the execution time is very high.
6. Conclusion
Blood vessels in ophthalmoscope images play an important role in the diagnosis of some serious pathology on retinal images. Hence, accurate extraction of vessels is becoming a main topic in this research area. This paper presents an approach based on (DCT) analysis and (SVM) makes use of color information to perform the classification of retinal exudates. We prospectively assessed the algorithm performance using a database containing 1200 retinal images with variable color, brightness, and quality. Results of the proposed system can achieve a diagnostic accuracy with 97.0% sensitivity and 98.7% specificity for the identification of images containing any evidence of retinopathy.
REFERENCES
- D. E. Singer, D. M. Nathan, H. A. Fogel, A. P. Schachat, “Screening for Diabetic Retinopathy,” Annals of Internal Medicine, Vol. 116, No. 8, 1992, pp. 60-71. doi:10.7326/0003-4819-116-8-660
- M. J. Cree, J. A. Olson, K. C. McHardy, P. F. Sharp and J. V. Forrester, “The Preprocessing of Retinal Images for the Detection of Fluoresce in Leakage,” Physics in Medicine & Biology, Vol. 44, No. 1, 1999, pp. 293-308. doi:10.1088/0031-9155/44/1/021
- M. J. Cree, E. Gamble and D. Cornforth, “Colour Normalisation to Reduce Inter-Patient and Intra-Patient Variability in Micro Aneurysm Detection in Colour Retinal Images,” Proceedings of the APRS Workshop on Digital Image Computing, Brisbane, 21 February 2005, pp. 163- 168.
- M. Foracchia, M. Grisan and A. Ruggeri, “Luminosity and Contrast Normalization in Retinal Images,” Medical Image Analysis, Vol. 9, No. 3, 2003, pp. 79-90.
- A. Pinz, M. Prantl and P. Datlinger, “Mapping the Human Retina,” IEEE Transactions on Medical Imaging, Vol. 17, No. 4, 1998, pp. 606-619. doi:10.1109/42.730405
- N. Patton, T. M. Aslam, T. MacGillivray, I. J. Deary, B. Dhillon, R. H. Eikelboom, et al., “Retinal Image Analysis: Concepts, Applications and Potential,” Progress in Retinal and Eye Research, Vol. 25, No. 1, 2006, pp. 99-127. doi:10.1016/j.preteyeres.2005.07.001
- S. Bjorvis, M. A. Johansen and K. Fossen, “An Economic Analysis of Screening for Diabetic Retinopathy,” Journal of Telemedicine and Telecare, Vol. 8, No. 1, 2002, pp. 32-35.
- S. S. Feman, T. C. Leonard-Martin and J. S. Andrews, “A Quantitative System to Evaluate Diabetic Retinopathy from Fundus Photographs,” Investigative Ophthalmology & Visual Science, Vol. 36, No. 1, 1995, pp. 174-181.
- A. M. Aibinu, M. I. Iqbal, A. A. Shafie, M. J. E. Salami and M. Nilsson, “Vascular Intersection Detection in Retina Fundus Images Using a New Hybrid Approach,” Computers in Biology and Medicine, Vol. 40, No. 1, 2010, pp. 81-89. doi:10.1016/j.compbiomed.2009.11.004
- A. M. Aibinu, M. I. Iqbal, M. Nilsson and M. J. E. Salami, “A New Method of Correcting Uneven Illumination Problem in Fundus Images,” International Conference on Robotics, Vision, Information, and Signal Processing, Penang, 28-30 November 2007, pp. 445-449.
- G. G. Gardner, D. Keating, T. H. Williamson and A. T. Elliot, “Automatic Detection of Diabetic Retinopathy Using an Artificial Neural Network: A Screening Tool,” British Journal of Ophthalmology, Vol. 80, No. 11, 1996, pp. 940-944. doi:10.1136/bjo.80.11.940
- C. Sinthanayothin, J. F. Boyce, H. L. Cook and T. H. Williamson, “Automated Localization of the Optic Disc Fovea and Retinal Blood Vessels from Digital Colour Fundus Images,” British Journal of Ophthalmology, Vol. 83, No. 8, 1999, pp. 231-238. doi:10.1136/bjo.83.8.902
- H. Wang, W. Hsu, K. G. Goh and M. L. Lee, “An Effecttive Approach to Detect Lesions in Color Retinal Images,” Proceedings of IEEE Conference on Computer Vision and Pattern Recognition, Hilton Head Island, 13-15 June 2000, pp. 181-186.
- H. Li and O. Chutatape, “A Model-Based Approach for Automated Feature Extraction in Fundus Images,” International Conference on Computer Vision (ICCV), Nice, 13-16 October 2003, pp. 394-399.
- D. Usher, M. Dumskyj, M. Himaga, T. H. Williamson, S. Nussey and J. Boyce, “Automated Detection of Diabetic Retinopathy in Digital Retinal Images: A Tool for Diabetic Retinopathy Screening,” Diabetic Medicine, Vol. 21, No. 1, 2004, pp. 84-90. doi:10.1046/j.1464-5491.2003.01085.x
- K. G. Goh, W. Hsu, L. Lee and H. Wang, “ADRIS: An Automatic Diabetic Retinal Image Screening System,” In: J. C. Krzysztof, Ed., Medical Data Mining and Knowledge Discovery, Physica-Verlag, Heidelberg, 2001, pp. 181-210.
- B. M. Ege, O. K. Hejlese, O. V. Larsen, K. Moller, B. Jennings, D. Kerr and D. A. Cavan, “Screening for Diabetic Retinopathy Using Computer Based Image Analysis and Statistical Classification,” Computer Methods and Programs in Biomedicine, Vol. 62, No. 3, 2000, pp. 165- 175. doi:10.1016/S0169-2607(00)00065-1
- A. Osareh, M. Mirmehdi, B. Thomas and R. Markham, “Comparative Exudate Classification Using Support Vector Machines and Neural Networks,” In: T. Dohi and R. Kikinis, Eds., Medical Image Computing and Computer-Assisted Intervention, Springer, Berlin, 2002, pp. 413-420.
- L. Tang, M. Niemeijer and M. D. Abrilmoff, “Splat Feature Classification: Detection of the Presence of Large Retinal Hemorrhages,” IEEE International Symposium on Biomedical Imaging, Chicago, 30 March 2011-2 April 2011, pp. 681-684.
- J. J. Staal, M. D. Abramoff, M. Niemeijer, M. A. Viergever and B. van Ginneken, “Ridge Based Vessel Segmentation in Color Images of the Retina,” IEEE Transactions on Medical Imaging, Vol. 23, No. 4, 2004, pp. 501- 509. doi:10.1109/TMI.2004.825627
- Messidor, “Methods to Evaluate Segmentation and Indexing Techniques in the Field of Retinal Ophthalmology Techno-Vision Project”. http://messidor.crihan.fr/
- X. Zhang and O. Chutatape, “Top-Down and Bottom-Up Strategies in Lesion Detection of Background Diabetic Retinopathy,” IEEE Computer Society Conference on Computer Vision and Pattern Recognition, Vol. 2, 20-25 June 2005, pp. 422-428.
- R. F. Mansour, “Using Genetic Algorithm for Identification of Diabetic Retinal Exudates in Digital Color Images,” Journal of Intelligent Learning Systems and Applications, Vol. 4, No. 3, 2012, pp. 188-198. doi:10.4236/jilsa.2012.43019
- M. Sabaghi, S. R. Hadianamrei, M. Fattahi, M. R. Kouchaki and A. Zahedi, “Retinal Identification System Based on the Combination of Fourier and Wavelet Transform,” Journal of Signal and Information Processing, Vol. 3, No. 1, 2012, pp. 35-38. doi:10.4236/jsip.2012.31005
- R. C. Gonzalez and R. E. Woods, “Digital Image Processing,” Pearson Education Inc., New Delhi, 2003.
- M. Kirby and L. Sirovich, “Application of the KarhunenLoeve Procedure for the Characterization of Human Faces,” IEEE Transactions on Pattern Analysis and Machine Intelligence, Vol. 12, No. 1, 1990, pp. 103-108. doi:10.4236/jsip.2012.31005
- O. Chapelle, P. Haffner and V. N. Vapnik, “SVMs for Histogram-Based Image Classification,” IEEE Transactions on Neural Networks, Vol. l0, No. 5, 1999, pp. 1055- 1064.
- H. Bhavsar and M. H. Panchal, “A Review on Support Vector Machine for Data Classification,” International Journal of Advanced Research in Computer Engineering & Technology, Vol. 1, No. 10, 2012.
- K. Wisaeng, N. Hiransakolwongi and E. Pothiruk, “Automatic Detection of Retinal Exudates Using a Support Vector Machine,” Applied Medical Informatics, Vol. 32, No. 1, 2013, pp. 33-42.
- The STARE Database, 2009. http://www.ces.clemson.edu/ahoover/stare
- T. Fawcett, “ROC Graphs: Notes and Practical Considerations for Researchers,” Technical Report MS1143 Extended Version of HPL-2003-4, HP Laboratories, 2004.
- M. Kallergi, “Evaluation Strategies for Medical-Image Analysis and Processing Methodologies,” In: L. Costaridou, Ed., Medical Image Analysis Methods: The Electrical Engineering and Applied Signal Processing Series, CRC Press, Boca, 2005, pp. 433-471,