Natural Science
Vol.11 No.07(2019), Article ID:93724,13 pages
10.4236/ns.2019.117023
The Effect of Trihalomethanes in Contaminating the Major Watersheds of Middle Tennessee
Sujata Guha, Paige Harlin, Ryan Beni
Department of Chemistry, Tennessee State University, Nashville, TN, USA
Correspondence to: Ryan Beni, 
Copyright © 2019 by author(s) and Scientific Research Publishing Inc.
This work is licensed under the Creative Commons Attribution International License (CC BY 4.0).
http://creativecommons.org/licenses/by/4.0/


Received: May 30, 2019 ; Accepted: July 15, 2019 ; Published: July 18, 2019
ABSTRACT
We have analyzed the contamination of the three major watersheds in Middle Tennessee (Middle Cumberland River Watershed, Stones River Watershed, and Harpeth River Watershed) by trihalomethanes, such as chloroform, bromodichloromethane, dibromochloromethane, and bromoform. These chemicals play an important role in the development of cancer and adverse reproductive outcomes, and were found to be present above the threshold established by the Environmental Protection Agency. Certain portions of each watershed were found to be contaminated by the trihalomethanes, and deemed unhealthy. The household incomes in the major areas in the three watershed regions were also examined to determine a possible relationship with the level of water contamination. We concluded that income did not necessarily relate to water quality. Specific areas within each watershed that had lower average household incomes were found to have a higher concentration of the trihalomethanes in their drinking water, while other high-income areas were also affected by unhealthy water. However, these effects were random, and the level of contamination remained below the guidelines regulated by the State of Tennessee.
Keywords:
Middle Tennessee, Watersheds, Trihalomethanes, Contaminants, Carcinogens

1. Introduction
Clean water is essential for human health. According to the World Health Organization (WHO), safe water, sanitation and hygiene at home are some of the most basic requirements for human health, and all countries have a responsibility to ensure that everyone can access them [1]. Water is the primary source of nourishment and humans need to be adequately hydrated for their physiological systems to function properly. Additionally, water helps sustain organ health and allows the blood to maintain the consistency required for the transport of oxygen and nutrients cells within the body. Clean water is also important for the prevention of diseases. Fatal conditions may occur due to the consumption of contaminated water [2]. Clean, fresh and safe water also helps in getting the body rid of various types of toxins [3]. The US Environmental Protection Agency (EPA) sets standards that ensure safe drinking water from public water sources [4]. The Tennessee Department of Environment and Conservation’s Division of Water Resources oversees drinking water safety [5]. It trains and inspects the operators that clean drinking water for water utilities. Water utilities are required to inspect water for infectious pathogens, chemical contaminants and disinfectant products on a regular basis.
1.1. Water Contamination in Tennessee
In collaboration with the EPA, the Environmental Working Group (EWG), an activist organization, has looked closely at the quality of water in several states, in order to provide insight into the purity of drinking water [7]. In Tennessee (Figure 1), the EWG tracked ten contaminants in the water supplies in the water utilities across 30 towns, which can cause serious health problems [8 - 10]. Among the most dangerous contaminants are the trihalomethanes, which are a batch of four volatile organic compounds: chloroform (CHCl3), bromodichloromethane (CHBrCl2), dibromochloromethane (CHBr2Cl), and bromoform (CHBr3). When grouped together, these chemicals are called total trihalomethanes (TTHM). They are formed when chlorine or other chemicals used to disinfect water react with trace amounts of naturally occurring organic and inorganic matter in water. The EWG found that the tap water in most areas in Tennessee has an excess of trihalomethanes, which may increase the risk of cancer over the years.
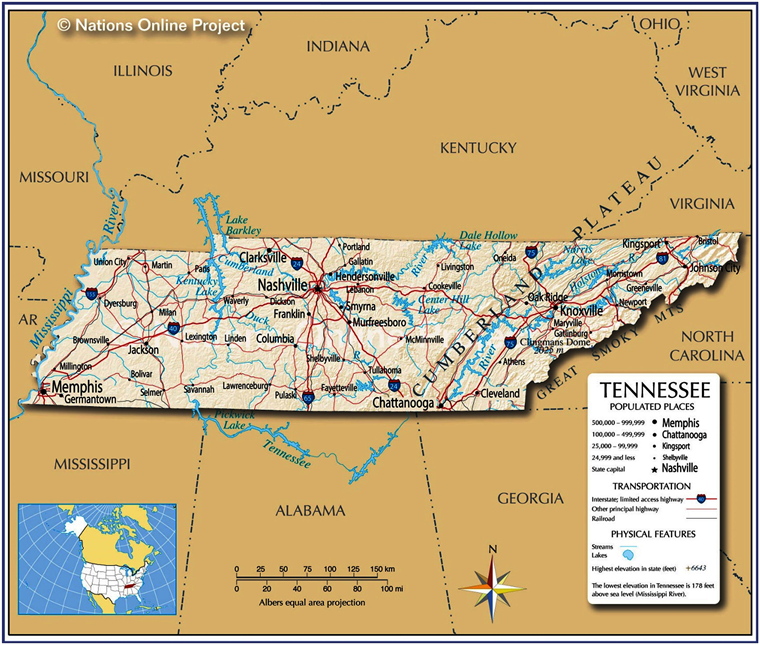
Figure 1. Map of the State of Tennessee showing the major cities and rivers [6].
The trihalomethanes have been detected above federal health limits, which are set separately from state limits. The legal limit for the trihalomethanes in drinking water is 80 parts per billion (ppb). The average level in Tennessee is 26.2 ppb while the federal average is 23.4 ppb, both of which are below the legal limit [11]. However, EWG has put its guideline number at 0.8 ppb, and believes that the state and federal limits are too lenient [12]. Also, there are several chemicals for which no federal limit has been set. Some contaminants are below the legal limits but nearly double the federal and state averages.
1.2. Harm Caused by Trihalomethanes—Short-Term, Long-Term, and Carcinogenic Effects
Studies have suggested a small increase in the risk of bladder and colorectal cancers as a result of exposures to trihalomethanes [13 , 14]. Other investigations have found that chlorination by-products may be linked to heart, lung, kidney, liver, and central nervous system damage [15]. Additional studies have linked trihalomethanes to reproductive problems, including miscarriage, thus posing a greater risk for pregnant women [16].
The human body may absorb chloroform through the skin, by ingestion, and inhalation. Consumption of chlorinated drinking water is the biggest source of human exposure to trihalomethanes in the United States. Other water uses in homes may contribute significantly to total chloroform (or other trihalomethane) exposure both from breathing in chloroform vaporized into the air and from its passage through the skin while bathing. Swimming in chlorinated pools will also contribute to the total exposure of trihalomethanes. According to a study, a greater percentage of chloroform is passed through the skin when temperatures of bath water are increased [17]. Chloroform’s acute (short-term) effects on humans have been studied during its past use as an inhalation anesthetic. Chloroform anesthesia has been associated with cardiac arrhythmias and abnormalities of the liver and kidneys, in addition to affecting the central nervous system. Skin contact with undiluted chloroform may cause a burning sensation, redness, and blistering. Acute effects of exposure to the other trihalomethanes are not documented in the literature, but are expected to be similar to chloroform [18]. Chronic (long-term) oral exposure of humans to chloroform at high doses results in adverse effects on the central nervous system, liver, kidneys and heart. Bromodichloromethane can be toxic to the kidney as well.
For populations using chlorinated drinking water in which chloroform is the predominant trihalomethane, small increases in the incidence of rectal, colon and bladder cancer have been observed, with the strongest evidence for bladder cancer. Chloroform has been classified by the EPA as a Group B2 or probable human carcinogen [19]. Chloroform has the potential to cause birth defects, miscarriages, and delays in development of the human foetus. Based on the results of animal studies in which bromodichloromethane exposure increased tumors of the large intestine, kidney, and liver, and bromoform increased tumors of the large intestine, they are also classified in Group B2 [20]. The results of a study suggest an increased risk of early-term miscarriage from high levels of trihalomethanes, particularly bromodichloromethane, in tap water. Dibromochloromethane is classified in Group C as a possible human carcinogen, based on limited evidence of an increase in liver tumors in animals [21].
In this study we investigated the levels of the total trihalomethanes in drinking water obtained from three major watershed areas in Middle Tennessee: Middle Cumberland River Watershed [22], Stones River Watershed [23], and Harpeth River Watershed [24], to determine the extent of contamination. The watershed areas of study are shown in Figure 2. A watershed is the land area that drains into a given body of water. Small watersheds combine to become big watersheds, sometimes called basins [25]. The watershed channels any excess water, such as rainfall or snow, to creeks and rivers, and eventually to reservoirs or other outflow points. The Cumberland River is 688 miles long and the basin drains 18,000 square miles of land that is home to almost 2 million people. The Stones River Watershed is 921 square miles and includes sixty-nine rare plant and animal species as well as eight rare fish species. The Harpeth River Watershed includes 870 square miles across eight counties in Tennessee [26]. The state’s water protection program focuses on watersheds because it is considered to be the best method of evaluating, protecting, and improving the quality of all the waters in the state, and develop more comprehensive control strategies. We determined what parts of each watershed are health and unhealthy. We then compared the data to the population and household income of residents of three major cities in each watershed area, to assess whether the regions with higher household incomes have access to healthy drinking water, versus the lower income households.
1.3. Economic Activities in the Cumberland, Stones, and Harpeth River Areas
The Cumberland River, an artery of the Ohio River that weaves in and out of the Nashville Metropolitan area, links the city to points on the Mississippi River and the Gulf of Mexico coast. More than 30 commercial operators operate barges on the river. The area around the Cumberland River is economically diverse, and has benefited from low unemployment, consistent job growth, heavy outside investment and expansion, and a broadening of the labor force. The primary city Nashville, which is the capital of Tennessee, is a leader in finance and insurance, health care, music and entertainment, publishing, transportation technology, higher education, biotechnology, plastics, and tourism and conventions. Nashville’s central location has made it one of the busiest transportation centers in the Mid-South, and it has historically been considered the hub of railway activity for the Southeast. Its Partnership 2010 program was responsible for a flurry of business activity in the early part of the century, including company relocations, expansions, and new corporations. Asurion relocated its corporate headquarters to Nashville in 2003, creating 800 jobs by late 2004. During that year, 90 companies announced expansions or relocations to the Cumberland region, and the area has economically grown even more since then. Dell’s first major US expansion outside of Central Texas was in Nashville [28].
The Stones River area has a wide array of residential and commercial development options. Public and private sectors work together to stimulate and encourage new business development and growth in that region [29]. The area around the Harpeth River area has a thriving economy with a high median household income ($85,671) and successful family businesses, farms, along with a multifaceted tourism industry [30]. A science-based conservation organization known as the Harpeth Conservancy monitors and protects the clean water and healthy ecosystems for the Harpeth River, which contains a variety of aquatic life [31].

Figure 2. Area of study showing the Cumberland River, Stones River, and Harpeth River Watersheds [27]. The major cities in each watershed (Nashville, Murfreesboro, and Franklin) are also shown.
2. Methodology
2.1. Data Collection
Secondary data related to the concentrations of trihalomethanes was obtained from the annual water safety report for the Middle Cumberland River [32 - 35], Stones River [36 - 39], and Harpeth River Watershed [40 - 43] areas in Middle Tennessee. Additional information was collected from each area’s water service office that was not provided in the annual water safety report. Using the interactive application iCreek [44], we were able distinguish between the portions of the watersheds that were considered healthy versus those that were unhealthy. Data including average annual household income was obtained from the United States Census Bureau [45], whose data was compiled in 2010. The water quality data was then prepared for descriptive statistical analysis.
2.2. Statistical Analysis
Histograms were used to illustrate the population, household income, per capita income, and persons in poverty for three major areas in each watershed area in Middle Tennessee. A comparison of the heathy and unhealthy watershed regions to the histograms enabled us to determine if a correlation existed between the water quality in areas with higher average income versus those with lower income.
3. Results and Discussion
3.1. Contamination Levels of Total Trihalomethanes
Figure 3 shows the 3D structures of the four trihalomethanes [46 - 49]. The complete concentrations of the total trihalomethanes (TTHM) over the past four years (2015-2018) are listed in Table 1. While all concentrations are found to be below the state-regulated legal limit of 80 ppb [7], the presence of these compounds is alarming, due to their carcinogenic effects. For the Middle Cumberland River Watershed, there is a general decrease in the level of TTHM from 2015, with a slight increase from 2016 to 2017. The TTHM level increased significantly in the Stones River Watershed during 2016 and 2017, almost approaching the legal limit of 80 ppb, which the decreased markedly in 2018. For the Harpeth River Watershed, the TTHM levels have increased over the four-year period, with a very slight dip in 2017. A comparison of the TTHM among the three watersheds for 2018 only reveals the Harpeth River Watershed to be the most contaminated.
Figure 4 shows the border of the Middle Cumberland River Watershed [44]. Blue represents healthy waterways, and red represents unhealthy waterways, vastly contaminated by trihalomethanes. For the most part, the water in most areas South Nashville is deemed healthy. According to Figure 4, the majority of the healthy waterways are in northwest Nashville, and the unhealthy parts seem to be south of Nashville, ranging from the heart of Nashville out to Nolensville. Goodlettsville also has unhealthy water. In the Cheatham County area, Pleasant View and Ashland city have healthy waterways, though a portion of Ashland city is affected by contaminated water. Figure 5 shows the Stones River Watershed [44]. Murfreesboro has small creeks throughout that are contaminated; however, moving eastward, unhealthy waterways are less prevalent. Smyrna is affected by unhealthy waterways, and a small portion of Woodbury (part of Cannon County) has contaminated water. From Figure 6, which shows the Harpeth River Watershed [44], it can be seen that the majority of unhealthy waterways are in the Franklin area, up to Thompson’s Station. The waterways going through Dickson are unhealthy and, on the southeast end, Eagleville is infected as well. As shown in the figure, the water in Fairview and surrounding areas is healthy.
The statistics for each region from the US Census Bureau data, plotted in Figures 7-9, enables us to determine whether income has any correlation with the quality of water residents are receiving. From Figure 7, it can be seen that the household incomes for Ashland City (which accounts for most of the healthy waterways in Northwest Nashville), along with Goodlettsville and the Nashville areas, are quite similar. Ashland City, with the higher household income, has healthy waterways around it, while the Goodlettsville area, which also has a higher household income, is affected by unhealthy waterways. It can, thus, be inferred that income does not seem to correlate with water quality in the Middle Cumberland River Watershed. The same can be concluded about the Stones River Watershed, by comparing Figures 5-8. Smyrna and Murfreesboro have higher household incomes but are affected by unhealthy waterway. The households in Woodbury have lower incomes but mostly healthy waterways. The Harpeth River Watershed is also inconsistent with the theory that higher income areas necessarily receive cleaner water. From Figures 6-9, it can be seen that residents of Fairview, with a higher income, have healthy water, while those living in Dickson (having the lowest income and highest poverty rate) are also affected by some unhealthy waterways. However, the Franklin area, which has the highest household income and the lowest poverty rate is still affected by unhealthy waterways. From this information, we can determine that household income does not necessarily correlate with water quality.
3.2. Reduction of Trihalomethane Contamination
The levels of the trihalomethanes increase with time, temperature, pH level, and the level of the precursors available. The precursors are the organic materials that react with chlorine in order to produce the trihalomethanes. One way to reduce the level of the trihalomethanes is to decrease the precursors and chlorination in the filters. It is best to reduce the precursors as the chlorine gets in contact with the water. If it requires oxidation before filtration, alternative disinfectants such as peroxide and potassium permanganate, lowering the pH, or moving the point of chlorination to the clarified water may be considered [8]. Lowering of trihalomethane precursor concentrations has the additional advantage of reducing overall disinfectant demand, thereby reducing the possibility of the formation of all disinfection by-products. The following techniques are useful in reducing the occurrence of trihalomethanes [50].

Table 1. Highest average levels of total trihalomethanes (unit: ppb).

Figure 3. Structures of the four trihalomethanes (a) Chloroform; (b) Bromodichloromethane; (c) Dibromochloromethane; and (d) Bromoform. Red = bromine; Green = chlorine; Grey = carbon; White = hydrogen.

Figure 4. Middle Cumberland River Watershed. Healthy waterways are represented in blue and unhealthy waterways are represented in red.

Figure 5. Stones River Watershed. Healthy waterways are represented in blue and unhealthy waterways are represented in red.

Figure 6. Harpeth River Watershed. Healthy waterways are represented in blue and unhealthy waterways are represented in red.

Figure 7. Comparison of population, median household income, per capita income, and persons of poverty in three areas, located within the Middle Cumberland River Watershed. Numbers are based off 2010 statistics from the US Census Bureau [45].

Figure 8. Comparison of population, median household income, per capita income, and persons of poverty in three areas, located within the Stones River Watershed. Numbers are based off 2010 statistics from the US Census Bureau [45].

Figure 9. Comparison of population, median household income, per capita income, and persons of poverty in three areas, located within the Harpeth River Watershed. Numbers are based off 2010 statistics from the US Census Bureau [45].
Enhanced coagulation—According to the EPA, the best available technology for the control of the trihalomethanes at the treatment plants is through the removal of the precursors by the enhanced coagulation. Enhanced coagulation is the process of optimizing the process of filtration to maximize the elimination of the precursors. The removal is improved by reducing the pH level as low as 4 to 5, increase the coagulants feed rates, and the use of the ferric coagulants.
Carbon filters—The use of activated carbon or charcoal is one of the easiest ways of eliminating the trihalomethanes in the water. A water pitcher can be used at home with a carbon filter. Homeowners can also install carbon filters in their tap source or put it on their bottled water. The activated carbon can be used in the water filtration system of the entire house. It can also be used as a backwashing system that does not require changing of the cartridge on a regular basis.
Reverse Osmosis Systems—Reverse osmosis is a process in which the dissolved inorganic solids are removed from water. This is possible by household water pressure that pushes the tap water through a semipermeable membrane. When the water pressure pushes the water through the membrane of the reverse osmosis system along with other filters, the trihalomethanes and other impurities are filtered out and flushed down the drain.
Water Softeners—Water softeners can effectively remove the magnesium, calcium, and other metals in the hard water, resulting in soft water. The soft water can extend the lifetime of the plumbs by eliminating or reducing the build-up of scale in the fittings or the pipes. Water softening can also be achieved with the use of ion-exchange resins or the lime softening technique.
Ultraviolet Systems—The ultraviolet (UV) water purification systems use special lamps that can emit UV light of a particular wavelength, which has the ability to disrupt the DNA of the microorganisms. As the water passes through a UV water treatment system, the living organisms on it are exposed to the UV light which attacks its genetic code. It rearranges the DNA (or the RNA) and eliminates the microorganism’s ability to infect and function properly. This process is very effective in destroying around 99.9% of harmful microorganisms without adding any chemicals to the water.
4. Conclusion
Analysis of drinking water for carcinogens is an important step in ensuring both human and environmental health. The Middle Cumberland River Watershed, Stones River Watershed, and Harpeth River Watershed were examined in order to determine the levels of trihalomethanes in drinking water, as well as their possible correlation to the socioeconomic background of the residents. It was determined that vast portions of each watershed are unhealthy. Although several areas within each watershed with typically lower average household incomes had higher total trihalomethanes in their drinking water, these effects were random, and the contaminants remained below the state-regulated guidelines. However, the level of contaminants in drinking water had no necessary correlation with the household income of residents in the areas around the watersheds.
ACKNOWLEDGEMENTS
We acknowledge the financial support from the USDA National Institute of Food and Agriculture, Grant# TENX-1608-FS. We thank US Department of Education, Title III Part B, grant number P031B090214 for partial financial support.
Conflicts of Interest
The authors declare no conflicts of interest regarding the publication of this paper.
References
- 1. Osseiran, N. (2017) World Health Organization. 2.1 Billion People Lack Safe Drinking Water at Home, More than Twice as Many Lack Safe Sanitation. https://www.who.int/en/news-room/detail/12-07-2017-2-1-billion-people-lack-safe- drinking-water-at-home-more-than-twice-as-many-lack-safe-sanitation
- 2. World Health Organization (2019) Flooding and Communicable Diseases Fact Sheet. https://www.who.int/hac/techguidance/ems/flood_cds/en
- 3. Aid & International Development Forum (2017) 5 Reasons Why Everyone Needs Clean Drinking Water. http://www.aidforum.org/topics/health-and-wash/5-reasons-why-everyone-needs-clean-drinking-water
- 4. United States Environmental Protection Agency (2019) Ground Water and Drinking Water. https://www.epa.gov/ground-water-and-drinking-water
- 5. TN Department of Environment & Conservation (2019) Water Quality. https://www.tn.gov/environment/program-areas/wr-water-resources/water-quality.html
- 6. One Planet Nations Online (2019) Reference Maps of Tennessee. https://www.nationsonline.org/oneworld/map/USA/tennessee_map.htm
- 7. Environmental Working Group (2019) EWG’s Tap Water Database. https://www.ewg.org/tapwater/search-results.php?stab=TN&searchtype=largesys#.WYI4EYWcHcv
- 8. Chatlani, S. (2019) Report: Tennessee May Be Failing to Protect Students from Lead in Drinking Water. https://www.nashvillepublicradio.org/post/report-tennessee- may-be-failing-protect-students-lead-drinking-water#stream/0
- 9. Environmental Working Group (2018) EWG’s Tap Water Database: Nashville Water Department #1. https://www.ewg.org/tapwater/system.php?pws=TN0000494
- 10. Belt, D. (2017) 30 Tennessee Water Systems Have Harmful Pollutants in Drinking Water, New Study Says. https://patch.com/tennessee/nashville/30-tennessee-water-systems-have-harmful-pollutants-drinking-water-new-study-says
- 11. Ahillen, S. (2017) How Safe Is Local Drinking Water? Database Raises Questions about East Tennessee Water Districts. https://www.knoxnews.com/story/news/local/tennessee/2017/08/07/drinking-water-safety-east-tennessee-database/532003001
- 12. Environmental Working Group (2019) EWG’s Tap Water Database: Total Trihalomethanes (TTHMs). https://www.ewg.org/tapwater//system-contaminant.php?pws=MO6010430&contamcode=2950
- 13. Villanueva, C.M., Gracia-Lavedan, E., Bosetti, C., Righi, E., Molina, A.J., Martin, V., Boldo, E., Aragones, N., Perez-Gomez, B., Pollan, M., Acebo, I.G., Altzibar, J.M., Zabala, A.J., Ardanaz, E., Peiro, R., Tardon, A., Chirlaque, M. A., Tavani, A., Polesel, J., Serraino, D., Pisa, F., Castano-Vinyals, G., Espinosa, A., Espejo-Herrera, N., Palau, M., Moreno, V., La Vecchia, C., Aggazzotti, G., Nieuwenhuijsen, M.J. and Kogevinas, M. (2017) Colorectal Cancer and Long-Term Exposure to Trihalomethanes in Drinking Water: A Multicenter Case-Control Study in Spain and Italy. Environmental Health Perspectives, 125, 56-65. https://doi.org/10.1289/EHP155
- 14. Klaassen, C.D. (2019) Casarett and Doull’s Toxicology: The Basic Science of Poisons. 9th Edition, McGraw-Hill Education, New York.
- 15. World Health Organization (2004) Trihalomethanes in Drinking Water. https://www.who.int/water_sanitation_health/water-quality/guidelines/chemicals/trihalomethanes.pdf
- 16. Grazuleviciene, R., Nieuwenhuijsen, M.J., Vencloviene, J., Kostopoulou-Karadanelli, M., Krasner, S.W., Danileviciute, A., Balcius, G. and Kapustinskiene, V. (2011) Individual Exposures to Drinking Water Trihalomethanes, Low Birth Weight and Small for Gestational Age Risk: A Prospective Kaunas Cohort Study. Environmental Health, 10, 32. https://www.ncbi.nlm.nih.gov/pmc/articles/PMC3100244 https://doi.org/10.1186/1476-069X-10-32
- 17. World Health Organization (2005) Trihalomethanes in Drinking-Water. https://www.who.int/water_sanitation_health/dwq/chemicals/THM200605.pdf
- 18. Abdullah, A.M. (2014) Assessment of Potential Risks from Trihalomethanes in Water Supply at Alexandria Governorate. Journal of Pollution Effects & Control, 2, 1-4. https://www.omicsonline.org/open-access/assessment-of-potential-risks-from- trihalomethanes-in-water-supply-at-alexandria-governorate-2375-4397.1000119.php?aid=33916
- 19. Environmental Protection Agency (2000) Chloroform. https://www.epa.gov/sites/production/files/2016-09/documents/chloroform.pdf
- 20. Environmental Protection Agency (2000) Bromoform. https://www.epa.gov/sites/production/files/2016-09/documents/bromoform.pdf
- 21. Agency for Toxic Substances and Disease Registry (2019) Bromoform and Dibromochloromethane: Relevance to Public Health. https://www.atsdr.cdc.gov/ToxProfiles/tp130-c2.pdf
- 22. Cumberland River Compact (2018). https://cumberlandrivercompact.org
- 23. TN Department of Environment & Conservation (2019) Stones River Watershed. https://www.tn.gov/environment/program-areas/wr-water-resources/watershed-stewardship/watersheds-by-basin/cumberland-river-basin---barren-river-watershed/stones-river-watershed.html
- 24. TN Department of Environment & Conservation (2019) Harpeth River Watershed. https://www.tn.gov/environment/program-areas/wr-water-resources/watershed-stewardship/watersheds-by-basin/cumberland-river-basin---barren-river-watershed/harpeth-river-watershed.html
- 25. Goodlettsville, Tennessee (2019) A Guide to Traveling Tennessee’s Watersheds. https://www.goodlettsville.gov/DocumentCenter/View/546/Guide-to-Tennessee-Watersheds?bidId
- 26. Tennessee Environmental Council (2019) Watershed Support Center. https://www.tectn.org/watershed-support-center.html
- 27. Cumberland River Compact (2013) Our Cumberland River Basin—Part 3: From Carthage to Ashland City. https://cumberlandrivercompact.org/wp-content/uploads/2013/12/OurCumberlandRiverBasin_PartThree.pdf
- 28. Cities in the United States: The South (2019) Nashville: Economy. http://www.city-data.com/us-cities/The-South/Nashville-Economy.html
- 29. City of Murfreesboro, Tennessee (2019) Economic Development. https://www.murfreesborotn.gov/321/Economic-Development
- 30. Livability (2019) Business and Economy in Franklin, TN. https://livability.com/tn/franklin/business?page=1
- 31. Giving Matters (2019) Harpeth Conservancy. https://givingmatters.guidestar.org/profile/2264/harpeth-conservancy.aspx
- 32. Metro Government of Nashville & Davidson County, Tennessee (2016) Water…The Real Taste of Life! 2015 Consumer Confidence Report. https://www.nashville.gov/Portals/0/SiteContent/WaterServices/docs/reports/2016%20CCR.pdf
- 33. Metro Government of Nashville & Davidson County, Tennessee (2017) Water…The Real Taste of Life! 2016 Consumer Confidence Report. https://www.nashville.gov/Portals/0/SiteContent/WaterServices/docs/reports/2017%20CCR.pdf
- 34. Metro Government of Nashville & Davidson County, Tennessee (2018) Metro Water Services 2018 Consumer Confidence Report: 2017 Water Quality Data. https://www.nashville.gov/Portals/0/SiteContent/WaterServices/docs/reports/Metro%20Water%20Services%20CCR%202018_v.final_051018.pdf
- 35. Metro Government of Nashville & Davidson County, Tennessee (2019) Metro Water Services 2019 Consumer Confidence Report: 2018 Water Quality Data. https://www.nashville.gov/Portals/0/SiteContent/WaterServices/docs/reports/Metro%20Water%20Services%20CCR%202019_FINAL_05.02.19.pdf
- 36. Consolidated Utility District, Rutherford County, Tennessee (2019) 2015 Water Quality Report. https://www.cudrc.com/wp-content/uploads/2019/03/2015-Water-Quality-Report.pdf
- 37. Consolidated Utility District, Rutherford County, Tennessee (2019) 2016 Water Quality Report. https://www.cudrc.com/wp-content/uploads/2019/03/2016-Water-Quality-Report.pdf
- 38. Consolidated Utility District, Rutherford County, Tennessee (2019) 2017 Water Quality Report. https://www.cudrc.com/wp-content/uploads/2019/03/2017-Water-Quality-Report.pdf
- 39. Consolidated Utility District, Rutherford County, Tennessee (2019) 2018 Water Quality Report. https://www.cudrc.com/wp-content/uploads/2019/05/2018-Water-Quality-Report.pdf
- 40. Water Management Department, City of Franklin, Tennessee (2015) Water Quality Report. https://www.franklintn.gov/home/showdocument?id=25416
- 41. Harpeth Valley Utilities District (2017) 2016 Water Quality Report. http://hvud.com/wp-content/uploads/2017/05/2017-HVUD-Water-Quality-Report.pdf
- 42. Water Management Department, City of Franklin, Tennessee (2017) Water Quality Report. https://www.franklintn.gov/home/showdocument?id=28003
- 43. Harpeth Valley Utilities District (2019) 2018 Water Quality Report. http://hvud.com/wp-content/uploads/2019/04/2018-Water-Quality-Report.pdf
- 44. Cumberland River Compact (2019) iCreek. http://cumberlandriverbasin.org/icreek
- 45. United States Census Bureau (2010) QuickFacts. https://www.census.gov/quickfacts/fact/table
- 46. NIH U.S. National Library of Medicine (2019) Compound Summary: Chloroform. https://pubchem.ncbi.nlm.nih.gov/compound/6212
- 47. NIH U.S. National Library of Medicine (2019) Compound Summary: Bromodichloromethane. https://pubchem.ncbi.nlm.nih.gov/compound/6359
- 48. NIH U.S. National Library of Medicine (2019) Compound Summary: Chlorodibromomethane. https://pubchem.ncbi.nlm.nih.gov/compound/31296
- 49. NIH U.S. National Library of Medicine (2019) Compound Summary: Bromoform. https://pubchem.ncbi.nlm.nih.gov/compound/5558
- 50. The Berkey: Purify Your Water (2019) How to Remove Trihalomethanes (THMs) from Drinking Water? Does the Berkey Remove. THMs? https://theberkey.com/blogs/water-filter/how-to-remove-trihalomethanes-thms-from-drinking-water
Abbreviations
EPA: Environmental Protection Agency
WHO: World Health Organization
EWG: Environmental Working Group
TTHM: Total Trihalomethanes
ppm: parts per million
ppb: parts per billion
UV: Ultraviolet
DNA: Deoxyribonucleic Acid
RNA: Ribonucleic Acid