Materials Sciences and Applications
Vol.4 No.1(2013), Article ID:27057,10 pages DOI:10.4236/msa.2013.41001
Conducting Polyaniline-Electrical Charge Transportation
![]()
1Center for Nanofibers & Nanotechnology, Nanoscience and Nanotechnology Initiative, National University of Singapore, Kent Ridge, Singapore; 2Center for Nanostructured Media, School of Mathematics and Physics, Queen’s University of Belfast, Belfast, UK; 3Department of Mechanical Engineering, National University of Singapore, Kent Ridge, Singapore.
Email: *nnivjb@nus.edu.sg
Received October 3rd, 2012; revised November 1st, 2012; accepted December 6th, 2012
Keywords: Protonation; Composites; Electrical Transportation; AC Conductivity
ABSTRACT
Conductive polyanilines are synthesized by doping with inorganic and organic acids, namely Hydrochloric acid (HCl) and ±10-camphor sulfonic acid (CSA). The direct current (DC) conductivities (σDC) are found to be about 9.5 ´ 10−8, 1.8, and 95.8 S/cm for PANI base, PANI (HCl) and PANI (CSA), respectively. σDC is measured down to a temperature of ~100 K and the apparent change in the activation energies are found to be 98.16, 74.40, and 57.24 meV for PANI base, HCl, and CSA dopings respectively. σDC is less temperature dependent near room temperature, further decrease in temperature the σDC is strongly dependent. Upon the inspection of AC conductivities (σAC) versus frequency curves, it can be inferred that the conduction process is noticeably influenced upon doping and within the dopants. σAC has shown classical plateau (DC-AC crossover) region, nonetheless shifted crossover frequency (critical frequency) upon doping is rather interesting. Critical frequencies (wc) are obtained from universal power-law for all samples. The variation in the dielectric properties can be attributed to the dopant incorporation. In material characterization, successful doping is corroborated by FTIR, UV-vis spectroscopy and slight influence upon doping can also be seen in thermal properties. Intense photoluminescence (PL) peaks at 322.5, 581.4 and 644.2 nm are observed. PANI (CSA) exhibited highest peak intensity followed by PANI (HCl) and PANI base.
1. Introduction
In general, conducting polymers are a special class of organic polymers that have alternate single-double bond conjugation and can conduct electricity. Among all the conducting polymers polyaniline (PANI) demonstrates outstanding properties due to its environmental stability, redox reversibility, high electrical conductivity and ease of synthesis which drives it towards potential electrical device applications [1-5]. It is agreed that in most of in its applications the behaviour of the conductivity is a long standing problem. The improvement on electrical properties of doped PANI reflecting the conditions of preparation/dopant incorporation is of fundamental importance. In comparison with metal oxides, acid doped conducting polymers influence more on electrical properties. Nevertheless the conductivity needs to be improved to reach lab scale device fabrication. Interest has focused upon the discovery of doping by acids with certain functionalized protonic acids may be used to render the emeraldine salt (ES) form of the polymer processable from solution [6,7]. Heeger and co-workers have have reported the use of functionalized protonic acids to dope emeraldine base (EB) and, simultaneously, to make soluble the resulting PANI complex in common organic solvents [8]. This procedure increases the PANI compatibility with bulk polymers with similar molecular structures. In addition it can strongly influences the electrical properties of a device. Consequently a wide range of conductivities are obtained by doping with various protonic acids [9,10]. A common and well-known inorganic acid namely hydrochloric acid (HCl) doped PANI is soluble in pyrrolidine and concentrated acids with improved electrical conductivity [11]. On the other hand, the organic acid that confers certain solubility and high conductivity on PANI is ±10-camphor sulphonic acid (CSA) [12] where doped in polyaniline presents a high conductivity (>1 ´ 102 S·cm−1) in the presence of m-cresol solvent. It provides high conductivity and crystallinity values to the PANI-CSA complex system, conferring on the polymer a metallic like-behavior [13]. In the recent years, HCl and CSA doped PANI have been used in Poly(methylmethacrylate) PMMA composites to produce highly conductive electrospun nanofibers by our group previously [14-16], in which the investigation devoted to microwave hall mobility and electrical properties. These results may open novel fundamental and applied frontiers [17] in diverse fields. Considering the potential applicability as conducting nanowires and rather deep understanding of blends as a whole can be realized when the detailed characteristics of conducting component (doped PANI) is known. At this stage, authors are motivated to excavate the electrical properties in doped and undoped PANI in “bulk” rather than nanowires. Doped PANI as a fundamental conducting species, its various properties are rather interesting and believed to be essential to understand.
Present article provides simultaneous comparison of two different acids doped PANI and their optical, photoluminescence, electrical (AC, DC) and dielectric properties.
2. Experimental
2.1. Materials and Methods
Polyaniline base (Mw = 65,000), Hydrochloric acid (HCl), ±10-camphor sulfonic acid (CSA), m-cresol, and N-Methyle-2-Pyrolidone (NMP) were obtained from Sigma Aldrich. All the chemicals were used as received.
The complete doping procedure has been described in our previous publications [14,15]. As briefly, 1 g of PANI base added in 40 ml of HCl stirred at 0 to −5˚C for 4 - 5 h. The fine dispersed particles were separated by centrifugation at 10,000 rpm for 10 min and vacuum dried for 48 h, the obtained powder was ready for further use. Similarly, 1 g of PANI base, 1.32 g CSA and 30 ml m-cresol grounded together in homogenizer and stirred with initial heat 50˚C for about 45 min and dried for 1 day to get fine powder, was used further characterization.
Scanning electron microscope (SEM) images of powder samples was obtained from JEOL JSM-6701F SEM. UV-visible absorption spectrum was recorded from dispersion in NMP using Shimadzu UV-3600, UV-Vis-NIR spectrophotometer. Photoluminescence was carried out using (Fluorolog, Horiba Jobin Yvon) axial S channel and 300 nm of wavelength was used for excitation. FTIR spectrum was recorded using Nexus 670 spectrometer. The thermal properties were obtained from DTA-TGA, SDT-2960, TA Instruments, while samples were heated in a ceramic crucible at a rate of 10˚C/min. The electrical leads were attained from the pellets with Ag paint. DC electrical conductivity (sDC) of PANI base is measured under two probe method, whereas PANI (HCl) and PANI (CSA) were measured under four probe configuretion. In the former case, voltage is applied (lab-built voltage source) across the pellet and the current is measured (Keithley, 6514 system electrometer). Then sDC (= d/RA) was calculated from the measured values of resistance (R), cross sectional area (A) and thickness (d) of the pellet. Whereas in the latter case, the current (Keithley 6221) was applied at two probes and voltage (Agilent 34401A) was measured across the remaining two probes, and hence the conductivity (σ = ln2/πdR) is estimated, where symbols carry the previous meanings. By using a low temperature cryostat, temperature dependent sDC is recorded. The AC response of the pellets was obtained from Schlumberger Solartron SI 1260 electrochemical impedance spectroscopy in 1 Hz to 12 MHz range which is pre-calibrated with standard resistor and capacitor.
2.2. Characterization
Typical SEM images are shown in Figure 1 and the average particle sizes (using UTHSCSA Image tool 3.00 program) were determined to be about 100, 170, and 250 nm for PANI base, PANI (HCl), and PANI (CSA) respectively.
It is rather hard to distinguish the individual particles or grains from the images. However, Danming et al. [18], have noticed no significant effect of HCl doping on the particle size. The particle size is left undetermined in the present context as it is appropriate not to comment on the average size of the particles, nonetheless the morphology is more or less similar to those previously reported [19].
UV-visible absorption spectra are shown in Figure 2. Two distinct peaks are observed at two different wavelengths, centered at ~3.75 and ~2.0 eV which are characteristics of PANI. The first peak (~3.75 eV) indicates the p-p* transition in the benzenoid rings, which is almost unaffected upon doping. This band also relates to the extent of conjugation between adjacent phenyl rings in the polymer chain. The second band (~2.0 eV) is due to the exciton absorption of the quinoid rings and which are attributed to the inter chain or intra chain charge transport [20]. This second absorption band for pristine PANI is at ~1.81 eV which is blue-shifted upon CSA doping (to ~2.09 eV), in contrast, for HCl doping, though it is not very explicit band, it can be inferred that it is certainly


Figure 1. SEM images of (a) PANI base (b) PANI (HCl) and (c) PANI (CSA).

Figure 2. UV-vis spectra shown as bottom black line for PANI base, middle blue line for PANI (CSA), and top red line for PANI (HCl).
red-shifted (to ~1.57 eV). The blue shift upon doping essentially indicates the increased oxidation state and hence better conductivity. Thus it is expected that CSA doping should possesses higher conductivity than HCl doping. Also sulphonic acid units may interact with amine/imine hydrogens, which enhances the electrical properties of polymers [19,21]. However, red-shift indicates the improved emerladine structure, consequently further improvement in the degree of doping. Similar set of implications can be seen in the literature [22] while PANI is doped with MnO2.
PL spectra were measured for all the three samples in the range of 300 - 800 nm and shown in Figure 3. The wavelength of excitation chosen for all the samples is 300 nm. This is because of π-π* transition of the benzenoid unit is responsible for PL in PANI [23]. Three excitation peaks were observed for all the samples at 322.5, 581.4 and 644.2 nm. PANI (CSA) shows an highest PL intensity followed by PANI (HCl) and PANI base, respectively. PANI (CSA) shows better PL intensity, the possible reason was benzenoid and quinoid units are more orderly arranged in it which favors the formation of excitons and increase in delocalization length of a singlet exciton [23,24]. Hence, one should expect higher photoluminescence emission from PANI (CSA) which is having higher extent of p conjugation. PANI (HCl) shows two extra emission peaks at 425.9 and 451.0 nm compared to PANI (CSA) and PANI base, the possible reason may be the presence of lighter dopant ions (Cl−) in PANI (HCl) compared to with higher charge mobility compared to the heaver dopant ions ( ) in PANI (CSA).
FTIR studies are known to be useful to identify chemical bonds, functional groups and the components of unknown sample mixtures. In the spectra every wavelength of light absorbed is characteristic of a specific chemical bond. The spectra are shown in Figure 4, in all the samples, the peak present at 1559 and 1484 cm−1 is due to the C-C stretching of quinoid and benzenoid rings respectively. This unaffected band upon doping indicates that the aromatic ring is retained in the polymer, which is corroborated by UV-vis in which the exciton band is almost unvaried with regards to the position of the peak. The bands at 1300 and 1240 cm−1 are due to the C-N stretching of the benzenoid ring. The peak observed at 1139 cm−1 is similar to those reported earlier and is associated with vibration mode of N=Q=N which is an electronic band (Q refers to the quinonic type rings). The presence of a band at 805 cm−1 is attributed to the out of plane deformation of C-H in benzene ring. A small peak observed in case of PANI (CSA) at 805 cm−1 corresponds to sulphonic acid group and the observed peak positions are consistent with the literature [19].
Thermograms from the samples are depicted in Figure 5. The derivative of the weight loss versus temperature (not shown here) is employed to identify the distinct peaks during heating, which are assignable to the decomposition of particular constituents in the composite. In Figure 5, a small fraction of weight loss at less than 100˚C is observed in all samples, which is due to the evaporation or expulsion of the absorbed water. As such it is hard to remove the moisture from the samples completely during the synthesis as interpreted by Feng and Xue [25] in the case of PANI in water-oil emulsion.

Figure 3. Photoluminescence spectra of PANI base, PANI (HCl) and PANI (CSA) and inset shows a survey spectrum.

Figure 4. FTIR spectra of pristine PANI compared with PANI (HCl) and PANI (CSA).
The second weight loss observed nearly at 255˚C for PANI (HCl) and is attributed to the evaporation of the dopant. This intermediate rather small decomposition step is observed in the case of PANI (CSA), which starts at 309˚C and stretches till 335˚C, further it decomposes rapidly. Although an intermediate degradation step can be seen more explicitly for HCl doping around 497˚C, it merges with that of pure PANI as that of CSA doping at ~515˚C, which is the final decomposition associated with polymer backbone, PANI. Thus the doped samples depicted slightly lower decomposition temperatures corresponding to a lower thermal stability unlike the case of plasticized PANI (HCl), where higher thermal stability can be expected [26].
3. Results and Discussion
3.1. DC Electrical Transportation
IV curves are shown in Figure 6 and corresponding conductivities are tabulated in Table 1. From Figure 6, linear nature of IV curve close to zero bias indicates that the charge transfer is a straight forward consequence of ohmic behavior (without any breakdown) associated with hopping mechanism [27], indicating that the measurement was performed in a field independent conductivity region. Hence the electrical conduction is through electrons, and trapped ions, for example, H+ and Cl– ions in the case of HCl doped PANI. The conductivities of the doped samples have depicted an improvement of ~10 orders in magnitude when compared with that of pristine PANI [8,28], also consistent with those earlier reported [19,29]. This improvement in the conductivity is originnated from the additionally generated extended states and charged defects with electronic structures, which are evident in various bands from UV-vis, and PL spectra. Additionally, a significant increase in conductivity with acid dopants is also observed in other composite systems such as PANI (HCl)/Polyvinyl alcohol and PANI (CSA)/ PMMA [30-32]. CSA doped PANI has shown highest

Figure 5. Thermogravimetric analysis of PANI base compared with HCl and CSA dopings.
conductivity among the other samples of ~95.8 S/cm, may be due to its additional feature of CSA where an interaction between the sulphonic acid groups with amine/ imine hydrogens can be expected [33].
Since IV characteristics are not stand-alone to explain the conduction process, or the entire electric nature of sample, we have carried out temperature dependent conductivity and plotted the variations in Figure 7 (ln sDC Vs 1/T1/4). In the intrinsic region close to the room temperature (RT), the conductivity curves are not simply straight lines. Two regions of different slopes for PANI (HCl) are observed in contrast to the other two samples. This transition of such gradient is rather slow till ~200 K, further sDC decreases with the temperature more rapidly. Below 200 K the behavior of the different samples is not very distinct, except CSA doped sample tails off slightly at ~130 K. This implies that at ~200 K, we can see a transition between the conduction processes explicitly for HCl doped PANI (Figure 7(b)). Above 200 K, the conduction is associated with polaron transport in the extended state.

Figure 6. IV characteristics of (a) PANI base (b) PANI (HCl) and (c) PANI (CSA). Red line is the linear fit for the data points.

Figure 7. Arrhenius plots for (a) PANI base (b) PANI (HCl) and (c) PANI (CSA). Red line is the linear fit for the data points.
At lower temperatures, the probability of thermal release becomes rapidly smaller, so that at a temperature below 200 K, it is more likely that polaron hops to a neighbouring localized state. Therefore at RT, these materials show semiconducting nature. In such case, if the conduction mechanism is due to the carriers excited beyond the mobility edge into non-localized or extended states, the DC conductivity can be expressed [34] as Equation (1):
 (1)
(1)
where “n” represents the dimensionality (n = 2 for 1D, n = 3 for 2D, and n = 4 for 3D) of the variable range hopping conduction. Further, the pre-exponential factor s0 is the conductivity at RT, Ea is the activation energy, which is temperature independent, kB is Boltzmann constant, and T is absolute temperature.
The temperature dependence of DC conductivity indicates that the observed semiconducting nature is due to only a small fraction of delocalized carriers. Using Equation (1), activation energies are determined for three samples (see Table 1). Surprisingly, the lowest is yielded for PANI (CSA) and the highest for PANI base. These activation energy values suggested that the hopping conduction is the prominent conduction mechanism in these types of systems. Hopping mechanism requires low activation energy with higher dielectric permittivity. Due to this Ea, electrical conductivity is expected to be weakly temperature dependent around 300 K [35]. In this context, it is important to mention that the linearity in the graphs (Figure 7) may indicate 3D hopping mechanism [34] nevertheless it is also explained based on percolation theory [36].
3.2. AC Electrical Studies
Impedance spectroscopy results usually involve capacitance and rarely involve inductance and it has become customary to plot the real and imaginary parts of the impedances as shown in Figure 8. Figure 8(a) depicts a typical depressed semicircle for PANI base and fitting of RC circuit is shown in Figure 8(b). The fittings for PANI (HCl) and PANI (CSA) are not shown here. Nyquist plots for PANI (HCl) and PANI (CSA) are shown in Figures 8(c) and (d), respectively. The high intercepts [37] of Nyquist plots are equivalent to DC resistance (at low frequencies), using these values the estimated conductivity (σ0) values are tabulated in Table 1.
Table 1. Calculated DC, AC conductivities (S/cm) and activation energies Ea (meV), and ωc in rad/sec.


Figure 8. Nyquist plot of (a) PANI base (b) Z-view fitting for PANI base (c) PANI (HCl) and (d) PANI (CSA).
Figure 9, shows log-log plot of AC conductivity (sAC) against frequency (w) for the three samples, which have shown two regions of diverse nature. Above a characteristic frequency, wc (=2pfc), (DC-AC crossover) the conductivity increases with frequency. The frequency independent part σ0 increases strongly with different dopings, which is offsetting the critical frequency wc to higher values [38]; where, wc is determined on the basis of a description provided by Kilbride et al. [39]. The highly disordered structure of PANI is well known that it is bulk conductivity, when protonated, has electronic character. Further, we can see from the UV-vis spectra, the various allowed transitions of electrons among different states. It can also be noted that the doped samples have shown significantly different absorption curves from the undoped sample, i.e., additional electronic states have been formed due to doping. Due to this, the inter-chain distances may be reduced. A shorter inter-chain distance is beneficial for the inter-chain hopping of charge carriers, bringing out a much higher electrical conductivity which is the case with HCl & CSA doped PANI.
The observed AC conductivity follows universal power law [40] of the following form
 (2)
(2)
Above wc, PANI base and HCl doped PANI are governed by one critical exponent, whereas CSA doped PANI has shown two exponent (see red and blue lines in Figure 9, Table 1 for critical exponents). The influence of doping can be seen explicitly on the transition frequency (wc). For instance, CSA doping, it has occurred around 4 kHz, whereas for HCl doping it shifted towards much higher frequencies.
HCl doping has shown rather interesting feature which is in clear contrast to that of base and CSA dopings, such as the σ0, which is constant for a wide range of frequencies (1 Hz to ~16 kHz) and rises sharply producing highest critical exponent (0.44 ± 0.02) among other samples. While, sAC of other two samples (PANI base and CSA doped) also increase with frequency after reaching certain value of frequency resulting in a symmetric hopping model [40,41]. This is because of localized charge carrier motion makes it possible to take maximum advantage of well conducting regions, while at lower frequencies charge transport must extend over longer distances and is limited by poorly conducting regions. Since CSA is heavier molecule than HCl, the later can align much efficiently and easily to the electric field in high frequencies [42]. This can be noticed in Figure 9 in which the capacitive contribution to σac from CSA doping appeared in much lower frequency than that of HCl doping. Upon further increase in frequency, CSA doped sample has shown a trend which may be a saturation which is described by another exponent (S2).
3.3. Dielectric Behaviour
The electric permittivity parameters (ε' and ε") obtained from the real and imaginary parts of impedances are shown in Figure 10 as a function of frequency. The values are seen to decrease with increasing frequency, associated with the polarizability mechanism. It is well known that the doped PANI system contains two types of charged species, one polaron/bipolaron system which is mobile and free to move along the chain, the others are bound charges (dipoles) which have only restricted mobility and account for strong polarization in the system. Above a certain frequency, the real permittivity (ε') exhibits plateau region, this is may be due to space charge polarization and it reaches saturation due to further increase in the frequency [19,43]. This is due to the fact that the conductivity of the sample increased upon doping and acting as better dielectric systems in lower frequencies, which is indeed significant. Nevertheless upon crossing a critical frequency, ε' is approaching zero.
This onset frequency is similar for PANI base and PANI (HCl) in contrast to that of CSA doped PANI which is slightly higher. Similar feature is noticed in the

Figure 9. Frequency dependent conductivity for (a) PANI base, (b) HCl and (c) CSA doped PANI. ωc indicates the DC-AC transition, where as different critical exponents are shown as S1 and S2 with fittings in red and blue color respectively.
case of ε" for all the samples. The decrease in dielectric loss is not symmetric for all the three samples on the logarithmic scale. The frequency of maximum loss shift towards higher frequency with acid dopants. [44] As we can see from Figure 10(a), the dielectric constant of (ε') of PANI base has a maximum of 2.5 ´ 102 F/cm, whereas for PANI (HCl) and PANI (CSA) (shown in Figures 10(b) and (c)) has increased ~5 and ~8 orders respectively. Moreover, the electric permittivity for the PANI (CSA) shows higher values compared to PANI (HCl) and PANI base, which is due to the local orientation of the individual dipole moment associated with the relatively large and rigid CSA dopant [44]. To analyze the electric conductivity relaxation process completely, the electric permittivity is converted in to electric modulus [43], because the electric permittivity is not alone sufficient to explain in depth electrical properties of conjugated polymers.


Figure 10. Dielectric constant and dielectric loss for (a) PANI base (b) PANI (HCl), and (c) PANI (CSA).
The calculated real and imaginary parts of electric modulus are plotted in Figure 11. Real and imaginary modulus reaches zero at lower frequencies, indicating that the electrode polarization imposes negligible contribution to M' which can be ignored. M' is steady till 10 Hz, 20 kHz, and 400 kHz for PANI base, PANI (HCl), and PANI (CSA) respectively, beyond which it increases rapidly. From Figure 11(a), one can infer that there are unexpected peaks arise due to the cumulative dipole moments of the main chain [44]. The frequency dependence of the imaginary part of the modulus is also shown on the respective plots. The peaks observed at 0.5 MHz, 0.7 MHz and 4 MHz for PANI base, PANI (HCl), and PANI (CSA) respectively. It suggests that the increase in the dopant molecule size lead to appearance of M" is shifting towards higher-frequency region, i.e., the DC conductivity has enhanced. M' and M" of PANI base and doped PANI are increased abruptly with increasing frequency. In the Figure 11(a), the M' and M" of PANI base

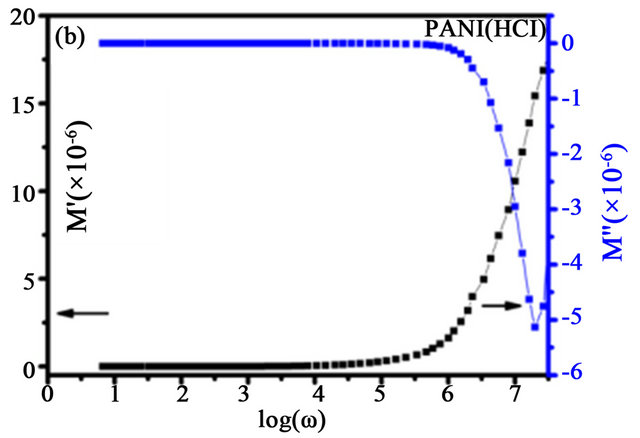

Figure 11. Real and imaginary electric modulus for (a) PANI base (b) PANI (HCl), and (c) PANI (CSA).
shows non monomodal distribution of the electric modulus. This may also be due to the complicated conduction process or various phases. But in PANI (HCl) and PANI (CSA), this multiple conduction process (Figures 11(b) and (c)) is not present in contrast to PANI (CSA) in which we have used m-cresol in the synthesis[43,44] the M" increased more slowly. M" variation with the frequency gives information about different conduction conditions such as hopping and dimensionality of the conduction process, which are depend on the conjugated state, chain structure, and doping level from different dopants. Therefore, a proper selection of dopant would supply suitable application of conductive polyaniline.
4. Conclusion
The presence of the dopants and un-effected aromatic ring of polyaniline were confirmed by UV-vis, FTIR respectively. Although there is no improvement in the thermal stability, the dopent disassociation from the matrix can be seen from the thermal analysis. The conductivity is enhanced upon doping due to generation of extended states in doped molecules or by changed defects with electronic structure. The structural and charge transfer processes are explained with FTIR and UV-vis spectroscopy. Intense PL is observed in CSA doped PANI followed by HCl doped PANI and PANI base. Henceforth these materials should also expect to show good electroluminescence (EL) as well. Thus CSA doped PANI is a promising material with respects of applications as emissive layers in organic or polymer light emitting diodes. Activation energy being an empirical parameter is employed to characterize the exponential temperature dependence of the change in the conductivity. The decrease in activation energy is noticed with acid dopants indicates that it would be a very good conducting material. Dielectric responses of polyaniline salt films, made from two different methods, were compared to investigate the effect of a dopant on electrical properties. Henceforth, we anticipate that these HCl and CSA doped PANI would be good candidate for electrical device fabrication.
5. Acknowledgments
V. J. Babu thanks M3TC (EDB) R-261-501-018-414, Singapore for providing financial assistance.
REFERENCES
- R. Valaski, F. Muchenski, R. M. Q. Mello, L. Micaroni, L. S. Roman and I. A. Hümmelgen, “Sulfonated Polyaniline/poly(3-methylthiophene)-based Photovoltaic Devices,” Journal of Solid State Electrochemistry, Vol. 10, No. 1, 2006, pp. 24-27. doi:10.1007/s10008-005-0648-8
- K. F. Seidel, L. Rossi, R. M. Q. Mello and I. A. Hümmelgen, “Vertical Organic Field Effect Transistor Using Sulfonated Polyaniline/Aluminum Bilayer as Intermediate Electrode,” Journal of Materials Science, Vol. 24, No. 3, 2012, pp. 1052-1056. doi:10.1007/s10854-012-0876-5
- M. Kandyla, C. Pandis, S. Chatzandroulis, P. Pissis and I. Zergioti, “Direct Laser Printing of Thin-Film Polyaniline Devices,” Applied Physics A, Vol. 110, No. 3, 2012, pp. 623-628. doi:10.1007/s00339-012-7127-8
- J. Bhadra and D. Sarkar, “Field Effect Transistor Fabricated from Polyaniline-Polyvinyl Alcohol Nanocomposite,” Indian Journal of Physics, Vol. 84, No. 6, 2010, pp. 693-697. doi:10.1007/s12648-010-0073-4
- L. Grigore and M. C. Petty, “Polyaniline Films Deposited by Anodic Polymerization: Properties and Applications to Chemical Sensing,” Journal of Materials Science, Vol. 14, No. 5-7, 2003, pp. 389-392. doi:10.1023/A:1023908903260
- Y. Cao, P. Smith and A. J. Heeger, “Counter-Ion Induced Processibility of Conducting Polyaniline and of Conducting Polyblends of Polyaniline in Bulk Polymers,” Synthetic Metals, Vol. 48, No. 1, 1992, pp. 91-97. doi:10.1016/0379-6779(92)90053-L
- N. Chandrakanthi and M. A. Careem, “Preparation and Characterization of Fully Oxidized Form of Polyaniline,” Polymer Bulletin, Vol. 45, No. 2, 2000, pp. 113-120. doi:10.1007/s002890070038
- Y. Cao, P. Smith and A. J. Heeger, “Counter-Ion Induced Processibility of Conducting Polyaniline,” Synthetic Metals, Vol. 57, No. 1, 1993, pp. 3514-3519. doi:10.1016/0379-6779(93)90468-C
- E. D. Brugnollo, L. G. Paterno, F. L. Leite, F. J. Fonseca, C. J. L. Constantino, P. A. Antunes and L. H. C. Mattoso, “Fabrication and Characterization of Chemical Sensors Made from Nanostructured Films of Poly(o-Ethoxyaniline) Prepared with Different Doping Acids,” Thin Solid Films, Vol. 516, No. 10, 2008, pp. 3274-3281. doi:10.1016/j.tsf.2007.08.118
- A. Manzoli, C. Steffens, R. T. Paschoalin, A. A. Correa, W. F. Alves, F. L. Leite and P. S. P. Herrmann, “LowCost Gas Sensors Produced by the Graphite Line-Patterning Technique Applied to Monitoring Banana Ripeness,” Sensors, Vol. 11, No. 6, 2011, pp. 6425-6434. doi:10.3390/s110606425
- D. Chattopadhyay and B. M. Mandal, “Methyl Cellulose Stabilized Polyaniline Dispersions,” Langmuir, Vol. 12, No. 6, 1996, pp. 1585-1588. doi:10.1021/la950523y
- M. Angelopoulos, G. E. Asturias, S. P. Ermer, A. Ray, E. M. Scherr, A. G. Macdiarmid, M. Akhtar, Z. Kiss and A. J. Epstein, “Polyaniline: Solutions, Films and Oxidation State,” Molecular Crystals and Liquid Crystals Incorporating, Vol. 160, No. 1, 1988, pp. 151-163. doi:10.1080/15421408808083010
- R. S. Biscaro, M. C. Rezende and R. Faez, “Reactive Doping of PANI-CSA and Its Use in Microwave Absorbing Materials,” Polymers for Advanced Technologies, Vol. 20, No. 1, 2009, pp. 28-34. doi:10.1002/pat.1239
- V. J. Babu, D. V. B. Murthy, V. Subramanian, V. R. K. Murthy, T. S. Natarajan and S. Ramakrishna, “Microwave Hall Mobility and Electrical Properties of Electrospun Polymer Nanofibers,” Journal of Applied Physics, Vol. 109, No. 7, 2011, p. 74306. doi:10.1063/1.3556456
- V. J. Babu, K. K. Satheesh, D. C. Trivedi, V. R. K. Murthy and T. S. Natarajan, “Electrical Properties of Electrospun Fibers of PANI-PMMA Composites,” Journal of Engineered Fibers and Fabrics, Vol. 2, No. 2, 2007, pp. 25-31.
- V. J. Babu, S. Vempati, G. J. Subha, V. Kumari, T. S. Natarajan, A. S. Nair and S. Ramakrishna, “AC Conductivity Studies on PMMA-PANI (HCl) Nanocomposite Fibers Produced by Electrospinning,” Journal of Engineered Fibers and Fabrics, Vol. 6, No. 4, 2011, pp. 54-59.
- Deepshikha and T. Basu, “A Review on Synthesis and Characterization of Nanostructured Conducting Polymers (NSCP) and Application in Biosensors,” Analytical Letters, Vol. 44, No. 6, 2011, pp. 1126-1171. doi:10.1080/00032719.2010.511734
- D. Chao, J. Chen, X. Lu, L. Chen, W. Zhang and Y. Wei, “SEM Study of the Morphology of High Molecular Weight Polyaniline,” Synthetic Metals, Vol. 150, No. 1, 2005, pp. 47-51. doi:10.1016/j.synthmet.2005.01.010
- S. Saravanan, C. J. Mathai, M. R. Anantharaman, S. Venkatachalam and P. V. Prabhakaran, “Investigations on the Electrical and Structural Properties of Polyaniline Doped with Camphor Sulphonic Acid,” Journal of Physics and Chemistry of Solids, Vol. 67, No. 7, 2006, pp. 1496-1501. doi:10.1016/j.jpcs.2006.01.100
- S. Stafström, J. L. Brédas, A. J. Epstein, H. S. Woo, D. B. Tanner, W. Huang and A. G. MacDiarmid, “Polaron Lattice in Highly Conducting Polyaniline: Theoretical and Optical Studies,” Physical Review Letters, Vol. 59, No. 13, 1987, pp. 1464-1467. doi:10.1103/PhysRevLett.59.1464
- C. R. Martins, P. S. D. Freitas and M.-A. D. Paoli, “Physical and Conductive Properties of the Blend of Polyaniline/Dodecylbenzenesulphonic Acid with PSS,” Polymer Bulletin, Vol. 49, No. 5, 2003, pp. 379-386. doi:10.1007/s00289-002-0118-8
- H. Jianjun, D. Yuping, Z. Jia, J. Hui, L. Shunhua and L. Weiping, “γ-MnO2/Polyaniline Composites: Preparation, Characterization, and Applications in Microwave Absorption,” Physica B, Vol. 406, No. 10, 2011, pp. 1950-1955. doi:10.1016/j.physb.2011.02.063
- J. Y. Shimano and A. G. MacDiarmid, “Polyaniline, a Dynamic Block Copolymer: Key to Attaining Its Intrinsic Conductivity?” Synthetic Metals, Vol. 123, No. 2, 2001, pp. 251-262. doi:10.1016/S0379-6779(01)00293-4
- M. Wohlgenannt and Z. V. Vardeny, “Spin-dependent Exciton Formation Rates in π-Conjugated Materials,” Journal of Physics: Condensed Matter, Vol. 15, No. 3, 2003, pp. R83-R107. doi:10.1088/0953-8984/15/3/202
- F. Yan and G. Xue, “Synthesis and Characterization of Electrically Conducting Polyaniline in Water-Oil Microemulsion,” Journal of Materials Chemistry, Vol. 9, No. 12, 1999, pp. 3035-3039. doi:10.1039/a905146e
- S. A. Chen and H. T. Lee, “Polyaniline Plasticized with 1-Methyl-2-Pyrrolidone: Structure and Doping Behavior,” Macromolecules, Vol. 26, No. 13, 1993, pp. 3254- 3261. doi:10.1021/ma00065a002
- H.-S. Xu, Z.-Y. Cheng, Q. M. Zhang, P.-C. Wang and A. G. Macdiarmid, “Conduction Behavior of Doped Polyaniline Films at High Current Density Regime,” Journal of Polymer Science Part B, Vol. 37, No. 20, 1999, pp. 2845-2850.
- J. Stejskal and R. G. Gilbert, “Polyaniline. Preparation of a Conducting Polymer (IUPAC Technical Report),” Pure and Applied Chemistry, Vol. 74, No. 5, 2002, pp. 857-867. doi:10.1351/pac200274050857
- A. Kapil, M. Taunk and S. Chand, “Preparation and Charge Transport Studies of Chemically Synthesized Polyaniline,” Journal of Materials Science: Materials in Electronics, Vol. 21, No. 4, 2010, pp. 399-404. doi:10.1007/s10854-009-9931-2
- M. Ghosh, A. Barman, S. K. De and S. Chatterjee, “Low Temperatuere Electrical Conductivity of Polyaniline-Polyvinyl Alcohol Blends,” Solid State Commun, Vol. 103, No. 11, 1997, pp. 629-633. doi:10.1016/S0038-1098(97)00236-6
- M. Reghu, C. O. Yoon, C. Y. Yang, D. Moses, P. Smith and A. J. Heeger, “Transport in Polyaniline Networks Near the Percolation Threshold,” Physical Review B, Vol. 50, No. 19, 1994, pp. 13931-13941. doi:10.1103/PhysRevB.50.13931
- W. H. Jang, J. W. Kim, H. J. Choi and M. S. Jhon, “Synthesis and Electrorheology of Camphorsulfonic Acid Doped Polyaniline Suspensions,” Colloid and Polymer Science, Vol. 279, No. 8, 2001, pp. 823-827. doi:10.1007/s003960100534
- F. Gervais, N. Petit, C. Popon and P. Buvat, “Doping Dependence of Infrared Conductivity of Camphor-Sulphonic-Acid-Doped Polyaniline,” European Physical Review B, Vol. 31, No. 1, 2003, pp. 47-52. doi:10.1140/epjb/e2003-00007-9
- N. F. Mot and E. Davis, “Electron Process in NonCrystalline Materials,” Clarendon, Oxford, 1979.
- K. Morii, H. Kawano, I. Fujii, T. Matsui and Y. Nakayama, “Dielectric Relaxation in Amorphous Thin Films of SrTiO3 at Elevated Temperatures,” Journal of Applied Physics, Vol. 78, No. 3, 1995, p. 1914. doi:10.1063/1.360228
- D. Adler, L. P. Flora and S. D. Senturia, “Electrical Conductivity in Disordered Systems,” Solid State Commun, Vol. 12, No. 1, 1973, pp. 9-12. doi:10.1016/0038-1098(73)90333-5
- P. Passiniemi and K. Vakiparta, “Characterization of Polyaniline Blends with AC Impedance Measurements,” Synthetic Metals, Vol. 69, No. 1-3, 1995, pp. 237-238. doi:10.1016/0379-6779(94)02432-X
- R. F. Bianchi, G. F. L. Ferreira, C. M. Lepienski and R. M. Faria, “Alternating Electrical Conductivity of Polyaniline,” Journal of Chemical Physics, Vol. 110, No. 9, 1999, pp. 4602-4607. doi:10.1063/1.478341
- B. E. Kilbride, J. N. Coleman, J. Fraysse, P. Fournet, M. Cadek, A. Drury, S. Hutzler, S. Roth and W. J. Blau, “Experimental Observation of Scaling Laws for Alternating Current and Direct Current Conductivity in PolymerCarbon Nanotube Composite Thin Films,” Journal of Applied Physics, Vol. 92, No. 7, 2002, pp. 4024-4030. doi:10.1063/1.1506397
- J. C. Dyre and T. B. Schrøder, “Universality of Ac Conduction in Disordered Solids,” Reviews of Modern Physics, Vol. 72, No. 3, 2000, pp. 873-892. doi:10.1103/RevModPhys.72.873
- J. Bisquert and G. Garcia-Belmonte, “Interpretation of AC Conductivity of Lightly Doped Conducting Polymers in Terms of Hopping Conduction,” Russian Journal of Electrochemistry, Vol. 40, No. 3, 2004, pp. 352-358. doi:10.1023/B:RUEL.0000019676.99599.bc
- R. Singh, V. Arora, R. P. Tandon, S. Chandra and A. Mansingh, “Charge Transport and Structural Morphology of HCl-Doped Polyaniline,” Journal of Materials Science, Vol. 33, No. 8, 1998, pp. 2067-2072. doi:10.1023/A:1004358800788
- M. G. Han and S. S. Im, “Dielectric Spectroscopy of Conductive Polyaniline Salt Films,” Journal of Applied Polymer Science, Vol. 82, No. 11, 2001, pp. 2760-2769. doi:10.1002/app.2129
- P. Dutta, S. Biswas and S. K. De, “Alternating-Current Conductivity and Dielectric Permittivity of Polyaniline Doped with β-Naphthalene Sulphonic Acid,” Journal of Physics: Condensed Matter, Vol. 13, No. 41, 2001, pp. 9187-9196. doi:10.1088/0953-8984/13/41/310
NOTES
*Corresponding author.