Atmospheric and Climate Sciences
Vol. 2 No. 2 (2012) , Article ID: 18813 , 12 pages DOI:10.4236/acs.2012.22014
Urban Heat Island Assessment for a Tropical Urban Airshed in India
1Centre for Atmospheric Sciences, Indian Institute of Technology-Delhi, Delhi, India
2Department of Environmental Systems, Meisei University, Tokyo, Japan
3Department of Civil Engineering, Indian Institute of Technology, Roorkee, India
Email: mmohan6@hotmail.com
Received February 6, 2012; revised March 16, 2012; accepted March 28, 2012
Keywords: Urban Heat Island; Land-Use Land-Cover; Micrometeorological Experiments; Remote Sensing; Anthropogenic Emissions
ABSTRACT
There has been paucity of field campaigns in India in past few decades on the urban heat island intensities (UHI). Remote sensing observations provide useful information on urban heat island intensities and hotspots as supplement or proxy to in-situ surface based measurements. A case study has been undertaken to assess and compare the UHI and hotspots based on in-situ measurements and remote sensing observations as the later method can be used as a proxy in absence of in-situ measurements both spatially and temporally. Capital of India, megacity Delhi has grown by leaps and bounds during past 2 - 3 decades and strongly represents tropical climatic conditions where such studies and field campaigns are practically non-existent. Thus, a field campaign was undertaken during summer, 2008 named DELHI-I (Delhi Experiments to Learn Heat Island Intensity-I) in this megacity. Urban heat island effects were found to be most dominant in areas of dense built up infrastructure and at commercial centers. The heat island intensity (UHI) was observed to be higher in magnitude both during afternoon hours and night hours (maximum up to 8.3˚C) similar to some recent studies. The three high ranking urban heat island locations in the city are within commercial and/or densely populated areas. The results of this field campaign when compared with MODIS-Terra data of land surface temperature revealed that UHI hotspots are comparable only during nighttime. During daytime, similar comparison was less satisfactory. Further, available relationship of maximum UHI with population data is applied for the current measurements and discussed in the context of maximum UHI of various other countries.
1. Introduction
An urban heat island is a metropolitan area which is significantly warmer than its surrounding areas [1]. The concept of urban heat island considers the air temperature difference between a city centre and the surrounding area. It is defined as “closed isotherms indicating an area of the surface that is relatively warm; most commonly associated areas of human disturbance such as towns and cities” [2]. As population centers grow in size from village to town to city, they tend to have a corresponding increase in average temperature. This consequently increases building energy demand for air-conditioning in warmer countries like that of tropical regions. This increase in energy demand could result in not only additional generation of anthropogenic heat but also further intensification of heat islands themselves [3]. Urban heat island intensity (UHI) estimations are therefore important in urban planning as well as emission reduction strategies. Studies have shown the emergence of urban heat island phenomenon in the past decade in many developing economies like Indonesia [4], Malaysia [5], Sri Lanka [6], Turkey [7], Oman [8], Chile [9], Mexico [10], Argentina [11], Nigeria [12], Ethiopia [13] and others.
Changes in land use and land cover (LULC), due to increasing population and infrastructure pressures for rapidly growing megacities, play an important role in the development of urban heat islands. A sharp rise in population was recorded in the last decade in Delhi when it reached from 9.42 million in 1991 to 13.78 million in 2001 [14]. Such rapidly increasing population in megacities is associated with somewhat similar growth rates in vehicular population, residential and commercial complexes, industries and other infrastructure resulting into significant changes in LULC and increase in anthropogenic heat emissions. All these changes augur for generating several UHI pockets and shift in dynamics of urban heat island phenomenon. Increasing temperature trends in past few decades have been observed for National Capital Region Delhi [15]. While the increasing temperatures can be a direct consequence of global warming or may be a local phenomenon as a result of LULC changes and anthropogenic heat, they necessitate study of effect of heat island phenomenon that is expected to be greater in the mega-cities.
Few studies have been undertaken in past to analyse the urban climate impact and pattern of heat islands in Delhi [16-18]. Varying heat island intensities from different authors were studied and effects on mean mixing depths were estimated by Mohan [19]. There is lack of systematic studies conducted on urban heat island phenomenon in this megacity in past few decades that includes both in-situ measurements as well as remote sensing data. Satellite data can provide useful information as a snapshot for a wider spatial domain and generally twice daily while in-situ measurements can feasibly cover a selected geographical domain with time resolution of the order of seconds to minutes throughout the day. With this background in consideration, the present study is an attempt at studying spatial temperature variation for several different types of land-use land-cover (LULC) for the assessment of urban heat island effect and comparison of such in-situ ground measurements of this field campaign with those from remote sensing tools [20]. In addition analysis of the results vis-à-vis UHI observations made for various cities of the world has also been undertaken.
2. Description of the Field Campaign
2.1. Study Area Network
The national capital territory of Delhi was chosen as the study area. The entire area of 32 km × 32 km was divided into a grid of 16 cells of 8 km × 8 km. Each grid was allotted one or more micrometeorological stations for surface temperature measurements so as to get a representation of the terrains therein. In all, 30 sites were chosen throughout the city including 3 weather stations (WS) and 27 micrometeorological stations. Figure 1 shows the measurement sites on the map of Delhi. The micrometeorological stations were chosen so as to represent a wide variety of land use/land cover categories. Broadly the stations can be classified into urban built up areas, green areas, open areas and riverside areas.
2.2. LULC Classification of the Study Area
Stewart [21] and Stewart and Oke [22] noted that there is a lack of standard and homogenous system of classification for different urban settings because of the remarkable diversity of landscapes.
Essentially, any LULC classification is based on built up area coverage, building density, green cover, and open

Figure 1. Set up of micrometeorological stations across the study area. A 12 × 12 km sub domain with greater station density is shown in lower part of the grid network. Station locations are marked by  symbol with their station numbers (Base Map Source: Google Maps; NH: National Highway).
area coverage. In the present study, classification is based on these features as observed for all micrometeorological stations sites and correlated with LULC classification of the satellite imagery for the study area of Delhi [23,24]. The LULC of the study domain have been classified as:
1) Urban Built-up Areas: It covers areas with signifycant infrastructure such as buildings for residential and commercial purposes. These areas have been sub-classified into three categories based on density of the built up structures in the study domain that corroborates well with the LULC classification for Delhi based on satellite imagery [23,24].
a) Dense Canopy: These are highly built up areas (built up area > 80%) in the city with very few open spaces and narrow lanes. 1 - 2 storey residential or commercial structures, which are generally old, may be intermixed with newer higher storey (up-to 5 storey) buildings. These structures are attached at base or closeset. Built up structures in these areas are usually old and thus, when the new structures come up, they are not built in any planned manner thereby adding to the built-up clusters in these areas.
b) Medium Dense Urban Canopy 1: These are well planned colonies with 3 - 4 story buildings and some higher multistory buildings, commercial areas and shopping malls etc. Built up fraction accounts for 65% - 80% of the total area.
c) Medium Dense Urban Canopy 2: These are well planned colonies with open spaces and parks. Built up area which is about 50% - 65% is mostly covered by 2 - 3 story buildings, shopping centres, small markets and commercial areas etc.
d) Less Dense Urban Canopy: These are the canopies with residential areas intersparsed with plenty of green areas and open spaces. Built up area is between 30% - 50%.
2) Green Areas: These areas include green coverage ranging from medium dense forests to cultivated lands and parks and gardens.
a) Medium Dense Forests: Typical dense forests are non-existent in Delhi. However, the Delhi Ridge stretch is marked with dense lush vegetation and two such areas (Sanjay Van and Buddha Jayanti Park) have been chosen to represent this type of land cover in the present study.
b) Parks and Gardens: These are cultivated green areas characterized majorly by short grass and shrub vegetation represented by District Park Hauz Khas.
3) Open Areas: These areas are open lands with neither any significant built up structures nor any type of extensive natural or cultivated green coverage.
4) Riverside areas: The River Yamuna which flows through the city is expected to influence temperature in neighboring areas. Thus, two riverside areas (Sailing Club and Majnu ka Tila) were also chosen to analyze the river’s impact.
Table 1 details out all the stations classified under the above given groups.
2.3. Experiment Description
Temperature (both dry and wet bulb) and humidity measuring instruments were fixed at all the 27 micrometeorological stations as shown in Figure 1. Air temperature and relative humidity level data was measured and recorded by the wireless data logger units [T&D Corpora-
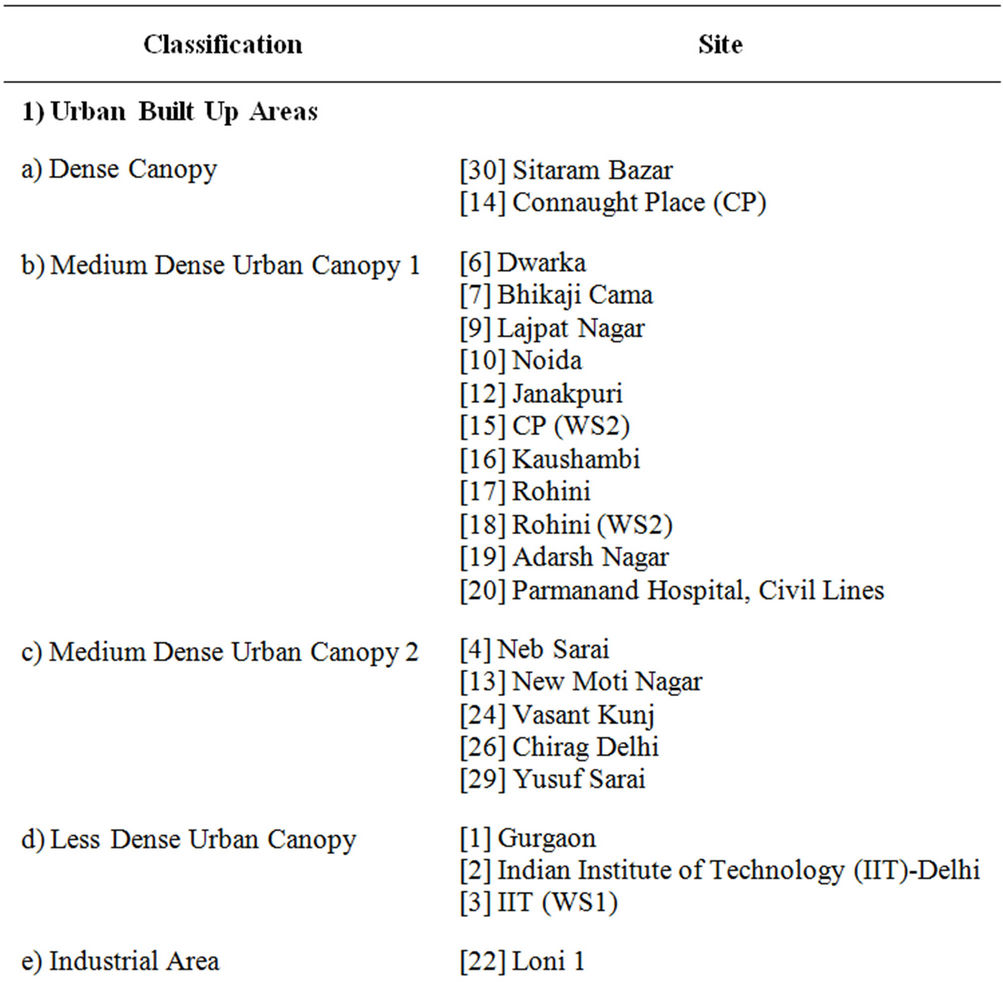

Table 1. Classification of experiment sites (Station ID are given in square brackets).
tion (Japan) Wireless Thermo Recorder Models: RTR-52 and RTR-72]. The instruments comprised of thermister sensor for air temperature, polymer humidity sensor for relative humidity and were protected by naturally ventilated radiation shields.
The instruments had been calibrated prior to the experimental phase by standardizing their readings with that of a standard psychrometer (Assmaan Psychrometer). The calibration process was carried out for a continuous stretch of 24 hours. Temperature correction coefficients were obtained by regression analysis of the measurements taken by the standard psychrometer and all the temperature data loggers used during the campaign and subsequently the measurements were corrected for the field campaign The instruments were installed at a height of about 1.5 m from the ground level facing the South direction such that the immediate surroundings at least upto 10 m from the instrument were open and not obstructed by any tree or building. Measurements were taken at interval of 1 minute from 25 May 2008 (morning)-28 May, 2008 (night extending into 29th May) and averaged on hourly basis for analysis. The micrometeorological stations at these 27 sites provided the temperatures to obtain pockets of UHI in the city. In addition, 3 weather stations (Davis Wireless Vantage Pro2 Plus with Fan Aspirated Radiation Shield) installed at 15 m height on roof tops of the buildings gave information about various other meteorological parameters such as wind speed and direction, dry bulb temperature, atmospheric pressure, and solar radiation. Such experimental ground based measurements may not be sustained over a long time without infrastructural and security support. Hence the results of the in-situ measurements of the present study have also been compared with satellite data.
3. Weather Conditions during the Field Campaign
The experiment was carried out in the month of May 2008 in Delhi which is a typical summer month. As per the Climate-Normals of Delhi [25] the average maximum temperature during the month of May is about 39.6˚C while the average minimum temperature is about 25.9˚C. During the present study, the minimum temperatures ranged from about 20˚C to 22˚C while the maximum temperatures ranged from 33˚C to 37˚C. The major wind directions were observed to be North-West, West and South-West. The wind speeds during the experimental days ranged up to 3.6 m/s. The maximum solar radiation observed was 936 W·m–2.
4. Urban Heat Island Intensity (UHI) across Delhi
With coming up of many satellite towns and city near the periphery of already established cities, definition of urban and rural areas have varied with different regions. As per classical definition of UHI [26], it is the difference in ambient air surface temperature between the city centre and a nearby rural area. However, Delhi is surrounded by peripheral satellite towns. Thus, it is difficult to find a rural site in within or near Delhi, free from influence of urban canopies. Nonetheless, Delhi with its variable LULC also offers many undeveloped/vegetated zones which can substitute for a rural area. Hence, the green areas in the city which were observed to have lowest temperatures have been considered as rural/non-urban temperature.
Stewart and Oke [22] noted that classifying field sites as conventionally “urban” or “rural” is especially difficult in regions where both cities and countrysides are densely populated and land uses intensely mixed. However, the core of the problem of urban heat island is that wherever high population and built up area exists, temperatures are higher and thus urban heat island effect is felt. Thus to estimate urban heat island intensity, a “rural” site may not be required for a region which has mixed land use. In the present study, mostly the green areas (parks and medium dense forests) in the city were observed to have the lowest temperatures. These green areas have thus been considered as baseline to asses UHI at other stations. Urban heat island intensity (UHI) is calculated as difference between highest temperature and lowest temperature observed among all micrometeorological stations across the study area at a given time.
These stations include all possible categories of LULC that may lead to both lowest (e.g., forest and other green areas, open areas and riverside) as well as highest temperatures (e.g., dense built up structures, commercial areas etc.).
To study the distribution of UHI over the entire monitoring network grid, UHI isopleths were constructed for all four days of the experimental phase for the specific (local) times of 0300, 0900, 1500 and 2100 hours. These hours were chosen based on approximate time of occurrence of minimum and maximum temperatures at all the stations and transitory conditions between morning-afternoon and evening-night respectively. UHI at each station for a given hour was calculated as difference of the temperature at that station and the lowest observed temperature at that hour among all stations of the micrometeorological network. The UHI values of all stations were then used to generate spatial distribution of UHI contours. Thus, each station (as marked by station number in the figure) is represented by its individual UHI value and UHI isopleths have been constructed by spatially interpolating the individual UHI values of 27 stations using Kriging technique across the study area of 32 × 32 km. Table 2 summarizes the maximum heat island intensity


Table 2. Urban Heat Island Intensity (UHI) and meteorological conditions during specific observation hours.
for all days along with corresponding meteorological parameters. Overall, UHI was observed to range from 4.1˚C to 5.6˚C at 0300 hours, 4.6˚C to 6.4˚C at 0900 hours, 3.8˚C to 7.6˚C at 1500 hours, and 2.8˚C to 8.3˚C at 2100 hours. Thus, daytime hours 1500, 0900 also showed significant UHI along with night hours (0300 and 2100 hours). The trends of the current study are in conformity with some studies conducted in China [27] and Israel [28] where significant UHI is observed during day hours and evening-night transition. Further, significant daytime UHI has been observed in some other studies such as in Hong Kong [29,30], London [31] and Salamanca, Spain [32]. The major UHI zones consist of commercial centers and densely populated residential areas such as Sitaram Bazar, Connaught Place (CP), Bhikaji Cama and Noida [33].
Amongst all the days of the field campaign, May 28, 2008 showed the maximum insolation, ambient air temperature and UHI and hence the UHI isopleths for this particular day is shown in Figures 2(a)-(d) at 3:00 am, 3:00 pm, 9:00 am and 9:00 pm respectively and discussed as a representative case.
Lowest temperatures were always observed in green areas of Sanjay Van and Hauz Khas District Park. The other consistently cool region is around Buddha Jayanti Park. Prominent UHI pockets were Sitaram Bazar (station No. 30), Connaught Place (station No. 14) and Bhikaji Cama Place (station No. 7). The dense urban canopy of Sitaram Bazar and surrounding localities with major commercial complexes, densely populated residences and some of the busiest traffic intersections is the major cause behind building up of this heat island. The lower

Figure 2. Spatial distribution of UHI for 28 May 2008 for (a) 0300 hours; (b) 1500 hours; (c) 0900 hours; (d) 2100 hours.
sky view factor in dense built up areas emitting less longwave radiation and trapping of heat at late night hours may result into higher temperatures in these areas. Connaught Place is a major commercial complex with shops as well as office premises. Bhikaji Cama is also a commercial complex with a major traffic intersection in the vicinity.
5. Association of Urban Heat Islands with Meteorological Parameters
Urban heat island intensity is closely related to the prevailing meteorological conditions. Table 2 shows range of wind speed and direction for all three weather stations, PG-stability class [34,35], urban heat island intensity and hotspots for each day of the experimental duration. Winds of speed up to 3.8 m·s–1 were prevalent during the experimental phase, but the night hours were marked by dominantly calm conditions (less than 0.3 m·s–1). As seen in Table 2, in hours like 3:00 am and 9.00 pm, highest magnitudes of UHI are observed when calm conditions prevailed. In addition the heat island zones were observed in the zone encompassing the downwind direction. For example, the major UHI spots lie in the zone of downwind direction during hours such as 9:00 pm on 25th May, 9:00 am on 26th May and 3:00 pm on 27th May.
Incidentally, the campaign period also covered an episode of rainfall thus facilitating a comparison between rainfall period and normal summer condition. The morning hours of 26th May experienced rainfall for duration of roughly two hours from 9:00 am to 11:00 am. This time period was thus marked by zero incident direct solar radiation and on an average the wind speeds ranged up to 5 m/s. Table 2 shows UHI magnitudes for 8:00 am, 10:00 am and 12:00 pm respectively. These hours correspond to “before rainfall”, “during rainfall” and “after rainfall” hours respectively. The maximum heat island intensity decreases from 8:00 am (3.7˚C) to 10:00 am (2.2˚C) and again increases at 12:00 pm (2.5˚C) and later at 3:00 pm (3.8˚C). Thus contrast in UHI between rainfall period and rest of the period is evident where the UHI is 2.2˚C during rainfall against overall maximum of 8.3˚C.
In the present study, significant magnitudes of UHI are observed at unstable daytime hours also. Buildings decrease sky view factor and thus heat loss by building material due to radiation to cooler sky is contained. Though this phenomenon is prominent during night, it seems that for the present study the built up infrastructure plays greater role in trapping of heat and dominates over the convections in the atmosphere. Hence even though unstable and convective atmosphere during daytime is expected to facilitate temperature uniformity, the canopy structure of intense human activity with localized anthropogenic heat emissions and varying land use land cover in urban areas dominates the convective mixing thereby resulting in high magnitudes of many pockets of urban heat island intensity even during day time. Commercial areas like CP (site No. 14) are influenced by heat emissions from anthropogenic activities especially in daytime. Thus even in unstable conditions in maximum temperature period, higher UHI magnitudes have been observed. This could be a reason for an unclear relation between stability and UHI magnitude.
Absorption of solar radiation is the major factor of heat island formation in dense infrastructure area. Urban absorption of solar radiation is a function of many factors such as direct solar radiation, diffuse sky radiation, diffuse radiation reflected by buildings and streets, and the shortwave energy absorbed by urban structure [36]. Although all these variables have not been analysed in the present study, the daily maximum UHI has been found to increase with daily maximum solar radiation with the exception of 26 May which witnessed rainfall. For example, the maximum solar insolation on 25 and 26 May are 827 and 836 W·m–2 with maximum UHI of 6.1˚C and 5.6˚C respectively against maximum solar insolation of 851 and 878 W·m–2 on 27 and 28 May with maximum UHI of 7.8˚C and 8.3˚C respectively.
6. Comparison with Remote Sensing Data
The MODIS Terra spacecraft passes over the region of Delhi during 1000 hours and 1130 hours approximately during daytime and similarly from 2200 hours to 2330 hours during nighttime (by local time). Thus, the average data of this time period in the present field campaign has been used for comparison with the satellite data.
Figures 3(a) and (c) display nighttime and daytime UHI contours derived through land surface temperature obtained from MODIS-Terra data of the Monsoon Asia Integrated Regional Study (MAIRS) [20]. UHI contours based on in-situ measurements of the present campaign are display in Figures 3(b) and (d). It can be seen that many UHI hotspots of the present measurements have been captured well by satellite derived temperature fields especially during nighttime. The top UHI hotspots that are common in both MODIS contours and in-situ contours during nighttime are C.P. (14), Sitaram Bazar (30), Janakpuri (12), Bhikaji Cama (7) and Dwarka (6). During daytime however, only top two hotspots are common which are Sitaram Bazar and C.P. There is a satisfactory comparison of in-situ and MODIS observations in the identification of hotspots especially during night time. Although present study measurements are those of air temperature (~1.5 m above ground level), LU/LC have been shown to have relationship with both surface and air temperature [37]. Comparison of absolute temperatures and UHI at actual experimental locations is given in terms of bar diagram in Figure 4.
Night temperatures are correlated well with MODIS data in comparison to daytime temperatures. The magnitude of difference between absolute temperatures of MODIS and DELHI-I datasets ranges from 0.01˚C to 3.57˚C during nightime and from 1.8˚C to 7.9˚C during daytime. The difference in UHIs in both datasets ranges from 0.06˚C to 2.74˚C during night-time and from 0.02˚C to 3.34˚C during daytime. The differences in the above two observations could be attributed to different heat capacities of land and air. Thus on relative basis, the UHI and temperatures at the measurement locations as estimated from both satellite and current field campaign are comparable for night-time. Voogt and Oke, [38] and Mirzaei and Haghighat [39] explain that temperature measured by satellite sensors only relates to the spatial patterns of upward thermal radiance received by the remote sensor. However, the UHI phenomenon is majorly impacted by turbulence and velocity activities which are quite dominant at a larger scale in daytime in comparison to nighttime. In the present study also, the comparison of in-situ measurements with satellite data during daytime is poorer than night-time possibly for these reasons. Though,

Figure 3. UHI contours for (a) present study nighttime; (b) MODIS-Terra nighttime; (c) present study daytime; (d) MODISTerra daytime.
quantitative comparison with satellite data is beyond the scope of this study, this qualitative comparison has validated the presence of temperature hotspots in the city.
7. Comparison with Other Cities
Table 3 lists some reported UHIs in major cities of the world based on field observations. Delhi, like Paris and London, is an inland city located at the bank of a river system. Although its population is lower than Tokyo and Beijing, the population density is higher than both these cities and similar to New York. With the exception of Beijing, all these cities belong to sub-tropical/temperate climate zone. However, climatologically Delhi is warmer than all these cities being quite close to tropical region.

Figure 4. Absolute temperatures (left) and urban heat island intensities (right) for individual stations from MODIS satellite and DELHI-I (in-situ) observations for nighttime (top) and daytime (bottom).

Table 3. UHI of some major megacites of the world.
New York, Paris London and Tokyo don’t have a significant precipitation in a particular season. On the other hand, Delhi, like Beijing, has a monsoon influenced climate and comparatively dry winters. Thus Delhi shares some similarities as well as dissimilarities with all these megacities. The heat island intensities stated against these cities in the Table 3 are from studies which were conducted using ground based measurements for a limited period. These studies were conducted in different time periods. The mean UHI (4.7˚C) observed in the present study is higher than those observed in New York (3˚C reported in year 2002) and Paris (2.6˚C reported in year 2006). The maximum UHI (8.3˚C) observed in present measurements falls in the range of those reported in London (8˚C, year 2003), Beijing (7.9˚C, year 2002) and Tokyo (8.1˚C, year 1992). However, it is important to note that in terms of built up infrastructure; all these cities are more urbanized than Delhi which is still developing.
Roth [52] analysed UHI and population of various continents and cities across the world. Population size and associated anthropogenic activities are expected to influence UHI. Based on observations, Oke [53] analysed relationship between UHImax and populations of various North American and European cities and deduced that under clear and calm conditions, urban heat island magnitude is proportional to the city population. Accordingly, the following relationships were proposed 1) for North American cities and 2) European cities:
ΔTu–r(max) = 2.96logP – 6.41 For North America (1)
ΔTu–r(max) = 2.01logP – 4.06 For Europe (2)
Delhi, with a population of 13.8 million [14] yields ΔTu–r(max) as 14.7˚C and 10.2˚C following Equations (1) and (2) respectively. Thus, the observed ΔTu–r(max) for Delhi (8.3˚C) is significantly lower than the results based on North American and European cities. The constants and slopes of Equations 1 and 2 are functions of artificial energy flux densities, heat capacity of the urban fabric, and evapo-transpiration in cities and therefore may have wide variations for different climates and demography. Further, Roth [54] reviewed several urban heat island studies in (sub) tropical regions and observed that in these UHI-population relationships, population is used as a convenient and widely available surrogate for urban geometry which has a more important control on urban heat island intensity. Delhi is still a developing megacity with mixed LULC having many interspersed green areas. In addition it is likely to have lower anthropogenic heat fluxes than the developed economies. Hence, the equations of Oke [53] yielded lower results than expected for Delhi.
Although, urban heat island intensity is expected to be related to population, Oke [53] also says that after a certain level, it is impossible to add more urban infrastructure to the city. For example, beyond a certain level of urbanization creation of new structures often results in destruction of old ones rather than the takeover of already scarce parkland. However for cities like Delhi, which are in phase of increasing urbanization, there is still scope of addition of more urban fabric. Built-up area of Delhi has witnessed an overall increment from 540.7 km2 to 791.96 km2 or 16.86% of the total city area (1,490 km2) during 1997 to 2008 which mainly came from waste land, scrub-land, sandy areas and water bodies [24]. Thus, with rising population and consequently increasing built up areas and associated anthropogenic activities, it is imperative to implement heat island mitigation strategies in the city in present time so that further intensification of heat island effect in the city can be prevented.
8. Conclusions
The main results and conclusions of the study are as follows.
• The urban heat island intensity in Delhi is found to be significantly high during summer days for both afternoon (3.8˚C to 7.6˚C at 3 PM) and night hours (2.8˚C to 8.3˚C at 9 PM) in comparison to early morning hours at the time of occurrence of minimum temperature (4.1˚C to 5.6˚C).
• The 3 top ranking UHI locations amongst the entire measurement network in the city are commercial areas namely CP, Sitaram Bazar and Bhikaji Cama Place. Other pockets with reasonably high UHI are residential or mixed use namely Noida, Dwarka, Janakpuri, Kaushambi, Adarsh Nagar etc.
• The impact of meteorological parameters such as wind speed and direction as well as atmospheric stability was observed on the intensity and location of the urban heat island hotspots.
• Comparison of in-situ measurements with satellite data showed that major hotspots in the city are well captured during night-time and can be helpful in assessing the major hotspots for other sites and times when in-situ measurements are inadequately available. The comparison of in-situ measurements with satellite data during daytime is poorer than night-time.
• Comparison with maximum and average UHI of other cities of the world revealed that UHI in Delhi is comparable to other major cities of the world such as London, Tokyo and Beijing.
• A relationship of maximum UHI and population showed that UHI in Delhi are lower than expected from the empirical relationships obtained for NorthAmerican and European cities with lower population than Delhi. Lower anthropogenic heat fluxes of Delhi due to a developing economy coupled with the climatic and demographic differences can be attributed for lower UHI in Delhi.
• However, rising population and change in LULC and associated anthropogenic activities call for strategic mitigation measures in the city to prevent further strengthening of heat island effect.
9. Acknowledgements
The present study is a part of a research project “Implementation and Validation of Numerical Models for Heat Island Studies in Mega-city Delhi” conducted jointly by Indian Institute of Technology (Delhi and Roorkee) and Meisei University, Tokyo. We thank The Ministry of Education, Culture, Sports, Science and Technology (MEXT), Japan for the partial financial support. We express our gratitude to Head, Centre for Atmospheric Sciences, Indian Institute of Technology, Delhi for extending all possible support to this activity. We thank the participants of the field campaign from IIT Delhi and Roorkee. We would also like to thank the anonymous reviewers for their constructive comments which helped in improving the overall quality of the manuscript.
REFERENCES
- D. Ward, “Urban Heat Islands,” 2008. http://www.windows.ucar.edu/tour/link=/earth/climate/urban_heat_islands.html
- American Meteorological Society (AMS), “Glossary of Meteorology,” 2000. http://amsglossary.allenpress.com/glossary/search?id=urban-heat-island1
- Y. Kikegawa, Y. Genchi, H. Yoshikado and H. Kondo, “Development of a Numerical Simulation System for Comprehensive Assessments of Urban Warming Countermeasures Including Their Impacts upon the Urban Building’s Energy Demands,” Applied Energy, Vol. 76, No. 4, 2003, pp. 449-466. doi:10.1016/S0306-2619(03)00009-6
- H. Sarkar, “Study of Landcover and Population Density Influences on Urban Heat Island in Tropical Cities by Using Remote Sensing and GIS: A Methodological Consideration,” 3rd FIG Regional Conference, Jakarta, 3-7 October 2004. http://www.fig.net/pub/jakarta/papers/ts_20/ts_20_2_sarkar.pdf
- W. Takeuchi, “Application of Remote Sensing and GIS for Monitoring Urban Heat Island in Kuala Lumpur Metropolitan Area,” Map Asia 2010 and the International Symposium and Exhibition on Geoinformation, Kuala Lumpur, 2010. http://www.mapasia.org/2010/proceeding/pdf/306.pdf
- L. Manawadu and L. Nirosha, “Identifying Surface Temperature Pattern of the City of Colombo,” Engineer, Vol. 41, No. 5, 2008, pp. 133-140.
- S. Toy, “ Evaluation of 10-Year Temperature Differences between Urban and Rural Areas of a Well-Planned, Unindustrialized, and Medium-Sized Turkish Town, Erzincan,” Journal of Urban Planning and Development, Vol. 136, No. 4, 2010, pp. 349-356. doi:10.1061/(ASCE)UP.1943-5444.0000022
- Y. Charabi and A. Bakhit, “Assessment of the Canopy Urban Heat Island of a Coastal Arid Tropical City: The Case of Muscat, Oman,” Atmospheric Research, Vol. 101, No. 1-2, 2011, pp. 215-227. doi:10.1016/j.atmosres.2011.02.010
- M. A. Pena, “Relationships between Remotely Sensed Surface Parameters Associated with the Urban Heat Sink Formation in Santiago, Chile,” International Journal of Remote Sensing, Vol. 29, No. 15, 2008, pp. 4385-4404. doi:10.1080/01431160801908137
- O. R. Garcia-Cueto, E. Jauregui-Ostos, D. Y. Toudert and A. Tejeda-Martinez, “Detection of the Urban Heat Island in Mexicali, B. C., México and Its Relationship with Land Use,” Atmósfera, Vol. 20, No. 2, 2007, pp. 111-131.
- I. Camilloni and M. Barrucand, “Temporal Variability of the Buenos Aires, Argentina, Urban Heat Island,” Theoretical and Applied Climatology, Vol. 107, No. 1-2, 2012, pp. 47-58. doi:10.1007/s00704-011-0459-z
- O. M. Akinbode, A. O. Eludoyin and O. A. Fashae, “Temperature and Relative Humidity Distributions in a Medium-Size Administrative Town in Southwest Nigeria,” Journal of Environmental Management, Vol. 87, No.1, 2008, pp. 95-105. doi:10.1016/j.jenvman.2007.01.018
- B. Kifle, “Urban Heat Island and Its Feature in Addis Ababa (a Case Study),” Fifth International Conference on Urban Climate, Lodz, 1-5 September 2003. http://nargeo.geo.uni.lodz.pl/~icuc5/text/P_6_11.pdf
- Delhi Statistical HandBook (DSH), 2009. http://www.delhi.gov.in/wps/wcm/connect/doit_des/DES/Our+Services/Statistical+Hand+Book/
- M. Mohan, A. Kandya and A. Battiprolu, “Urban Heat Island Effect over National Capital Region of India: A Study Using the Temperature Trends,” Journal of Environmental Protection, Vol. 2, No. 4, 2011, pp. 465-472. doi:10.4236/jep.2011.24054
- H. D. Bahl and B. Padmanabhamurty, “Heat Island Studies at Delhi,” Mausam, Vol. 30, No. 1, 1979, pp. 119-122.
- K. Nand and S. J. Maske, “Mean Heat Island Intensities at Delhi-Assessed from Urban Climatological Data,” Mausam, Vol. 32, No. 3, 1981, pp. 269-272.
- B. Padmanabhamurty and H. D. Bahl, “Isothermal and Isohyetal Patterns of Delhi as S Sequel of Urbanization,” Mausam, Vol. 33, No. 1, 1984, p. 4.
- M. Mohan, “Diurnal Variation of Mean Mixing Depths in Different Months at Delhi,” Mausam, Vol. 36, No. 1, 1985, pp. 71-74.
- GIOVANNI, “Monsoon Asia Integrated Regional Study (MAIRS) 8-Day Higher Resolution Products. National Aeronautics and Space Administration,” 2011. http://gdata1.sci.gsfc.nasa.gov/daac-bin/G3/gui.cgi?instance_id=mairs_8day
- I. D. Stewart, “Landscape Representation and the UrbanRural Dichotomy in Empirical Urban Heat Island Literature, 1950-2006,” Acta Climatologica et Chorologica, Vol. 40-41, 2007, pp. 111-121. http://www2.sci.u-szeged.hu/eghajlattan/akta07/111-121.pdf
- I. D. Stewart and T. Oke, “Classifying Urban Climate Field Sites by “Local Climate Zones the Case of Nagano, Japan”, 7th International Conference on Urban Climate, Yokohama, 29 June-3 July 2009. http://www.ide.titech.ac.jp/~icuc7/extended_abstracts/pdf/385055-1-090515165722-002.pdf
- M. Mohan, “Dynamics of Urban Pollution a Curative Strategy Using RS and GIS Techniques: A Case Study of Mega City Delhi,” ISRO Report, 2010.
- M. Mohan, S. K. Pathan, K. Narendrareddy, A. Kandya and S. Pandey, “Dynamics of Urbanization and Its Impact on Land-Use/Land-Cover: A Case Study,” Journal of Environmental Protection, Vol. 2, No. 9, 2011, pp. 1274-1283. doi:10.4236/jep.2011.29147
- India Meteorological Department (IMD), “Climatological Table,” 2010. http://www.imd.gov.in/section/climate/newdelhiweb.htm
- T. R. Oke, D. Yap and G. B. Maxwell, “Comparison of Urban Rural Cooling Rates at Night,” Conference on Urban Environment and Second Conference on Biometeorology, Philadelphia, 31 October-2 November 1972, pp. 17-21.
- L. Huang, J. Li, D. Zhao and J. Zhu, “A Fieldwork Study on the Diurnal Changes of Urban Microclimate in Four Types of Ground Cover and Urban Heat Island of Nanjing, China, ” Building and Environment, Vol. 43, No. 1, 2008, pp. 7-17. doi:10.1016/j.buildenv.2006.11.025
- M. Sofer and O. Potchter, “The Urban Heat Island of a City in an Arid Zone: The Case of Eilat, Israel,” Theoretical and Applied Climatology, Vol. 85, No. 1, 2006, pp. 81-88. doi:10.1007/s00704-005-0181-9
- H. Y. Mok, M. C. Wu and C. Y. Cheng, “Spatial Variation of the Characteristics of Urban Heat Island Effect in Hong Kong,” The First International Conference on Sustainable Urbanization (ICSU) , Hong Kong, 15-17 December 2010, p. 8. http://www.weather.gov.hk/publica/reprint/r923.pdf
- S. Giridharan, S. Ganesan and S. S. Y. Lau, “Daytime Urban Heat Island Effect in High-Rise and High-Density Residential Developments in Hong Kong,” Energy and Buildings, Vol. 36, No. 6, 2004, pp.525-534. doi:10.1016/j.enbuild.2003.12.016
- G. Renganathan, “Daytime Urban Heat Island Intensity in London during the Winter Season,” 25th Conference on Passive and Low Energy Architecture, Dublin, 22-24 October 2008. http://architecture.ucd.ie/Paul/PLEA2008/content/papers/oral/PLEA_FinalPaper_ref_330.pdf
- L. S. Alonso, J. L. Labajo and M. R. Fidalgo, “Characteristics of Urban Heat Island in City of Salamanca, Spain,” Atmosfera, Vol. 16, No. 3, 2003, pp. 137-148.
- M. Mohan, Y. Kikegawa, B. R. Gurjar, S. Bhati, A. Kandya and K. Ogawa, “Assessment of Urban Heat Islands Intensities over Delhi,” The Seventh International Conference on Urban Climate, Yokohama, 29 June-3 July 2009. http://www.ide.titech.ac.jp/~icuc7/extended_abstracts/pdf/375621-2-090515211144-004.pdf
- F. Pasquill, “The Estimation of the Dispersion of Windborne Material,” The Meteorological Magazine, Vol. 90, No. 1063, pp. 33-49.
- J. H. Seinfeld and S. N. Pandis, “Atmospheric Chemistry and Physics,” Wiley, New York, 1998.
- W. H. Terjung and S. Louie, “Solar Radiation and Urban Heat Islands,” Annals of the Association of American Geographers, Vol. 63, No. 2, 1973, pp. 181-207. doi:10.1111/j.1467-8306.1973.tb00918.x
- K. P. Gallo, A. L. Mcnab, T. R. Karl, J. F. Brown, J. J. Hood and J. D. Tarpley, “The Use of NOAA AVHRR Data for Assessment of the Urban Heat-Island Effect,” Journal of Applied Meteorology, Vol. 32, No. 5, 1993, pp. 899-908. doi:10.1175/1520-0450(1993)032<0899:TUONAD>2.0.CO;2
- J. A. Voogt and T. R. Oke, “Thermal Remote Sensing of Urban Climates,” Remote Sensing of Environment, Vol. 86, No. 3, 2003, pp. 370-384. doi:10.1016/S0034-4257(03)00079-8
- P. A. Mirzaei and F. Haghighat, “Approaches to Study Urban Heat Island—Abilities and limitations,” Building and Environment, Vol. 45, No. 10, 2010, pp. 2192-2201. doi:10.1016/j.buildenv.2010.04.001
- M. C. Peel, B. L. Finlayson and T. A. McMahon, “Updated World Map of the Köppen-Geiger Climate Classification,” Hydrology and Earth System Sciences, Vol. 11, No. 5, 2007, pp. 1633-1644. doi:10.5194/hess-11-1633-2007
- S. R. Gaffin, C. Rosenzweig, R. Khanbilvardi, L. Parshall, S. Mahani, H. Glickman, R. Goldberg, R. Blake, R. B. Slosberg and D. Hillel, “Variations in New York City’s Urban Heat Island Strength over Time and Space,” Theoretical and Applied Climatology, Vol. 94, No. 1-2, 2008, pp. 1-11. doi:10.1007/s00704-007-0368-3
- A. Sarkar and K. Ridder, “The Urban Heat Island Intensity of Paris: A Case Study Based on a Simple Urban Surface Parametrization,” Boundary Layer Meteorology, Vol. 138, No. 3, 2011, pp. 511-520. doi:10.1007/s10546-010-9568-y
- Greater London Authority (GLA), “London’s Urban Heat Island: A Summary for Decision Makers,” 2006. http://static.london.gov.uk/mayor/environment/climate-change/docs/UHI_summary_report.pdf
- Y. Wang and F. Hu, “Variations of the Urban Heat Island in Summer of the Recent 10 Years over Beijing and Its Environment Effects,” Chinese Journal of Geophysics, Vol. 49, No. 1, 2006, pp. 59-67.
- T. S. Saitoh, T. Shimada and H. Hoshi, “Modeling and Simulation of the Tokyo Urban Heat Island,” Atmospheric Environment, Vol. 30, No. 20, 2006, pp. 3431-3442. doi:10.1016/1352-2310(95)00489-0
- Wikipedia, “New York City,” 2012. http://en.wikipedia.org/wiki/New_York_City
- Wikipedia, “Paris,” 2012. http://en.wikipedia.org/wiki/Paris
- Wikipedia, “London,” 2012. http://en.wikipedia.org/wiki/London
- Wikipedia, “Beijing,” 2012. http://en.wikipedia.org/wiki/Beijing
- Wikipedia, “Tokyo,” 2012. http://en.wikipedia.org/wiki/Tokyo
- Wikipedia, “Delhi,” 2012. http://en.wikipedia.org/wiki/Delhi
- M. Roth, “Effects of Cities on Local Climates,” Workshop of GES/APN Mega-City Project, Kitakyushu, 2002. http://enviroscope.iges.or.jp/contents/13/data/PDF/24%20Jan%20PDF/ROTH_IEGS.pdf
- T. R. Oke, “City Size and the Urban Heat Island,” Atmospheric Environment (1967), Vol. 7, No. 8, 1973, pp 769-779.
- M. Roth, “Review of Urban Climate Research in (Sub)- Tropical Regions,” International Journal of Climatology, Vol. 27, No. 14, 2007, pp. 1859-1873. doi:10.1002/joc.1591