Journal of Transportation Technologies
Vol.06 No.03(2016), Article ID:65398,7 pages
10.4236/jtts.2016.63009
Long-Term Effectiveness of Radar Speed Display Signs in a University Environment
Michael R. Williamson1, Ryan Fries2, Huaguo Zhou3
1Department of Civil Engineering, Indiana State University, Terre Haute, USA
2Department of Civil Engineering, Southern Illinois University Edwardsville, Edwardsville, USA
3Department of Civil Engineering, Auburn University, Auburn, USA
![]()
Copyright © 2016 by authors and Scientific Research Publishing Inc.
This work is licensed under the Creative Commons Attribution International License (CC BY).
http://creativecommons.org/licenses/by/4.0/


Received 7 January 2016; accepted 8 April 2016; published 11 April 2016
ABSTRACT
Vehicular speeds are of particular interest in areas with a high number of pedestrians due to the fact that 14-percent of all fatal crashes involve pedestrians. This study investigated the effect of a radar speed display sign placed for an extended period of time, at a location frequented by law enforcement on a road segment entering a university campus with a high number of pedestrians and vehicle speed violations. The statistical analysis included a comparison between AM peak, PM peak, and midday speeds collected one year apart. The data suggested that radar speed display signs can remain effective over a long period of time; causing drivers to decelerate when warned of a speeding violation. While other studies have examined long-term impacts of similar technologies, none have included a road entering a University campus. Thus, these findings support that other similar locations entering university campuses could see long-term benefits to stationary radar speed display signs.
Keywords:
Pedestrian Safety, Radar Speed Display Signs Effectiveness, Driver Behavior

1. Introduction
Pedestrian safety is an important concern on university campuses. Because many campus cores allow vehicle access, pedestrian-vehicle interactions are unavoidable, resulting in a high conflict rate and the potential for pedestrian related crashes. In addition, the driver population of a university campus includes higher proportions of unfamiliar drivers and younger drivers, compared to other road facilities. Distractions such as cell phones can also hinder the awareness of drivers and pedestrians alike. All together, these factors suggest the uniqueness of the transportation system surrounding a university campus. Thoughtful consideration should guide the application of transportation engineering design assumptions.
One way to address pedestrian safety has been reducing travel speeds through enforcement, engineering, and education programs. Enforcement options could include speed trailers, officer ticketing, and automated enforce- ment, to name a few. Engineering options could include chicanes, speed humps, or textured pavements, to name a few. Education programs could include informing pedestrians how to properly cross roadways and informing drivers of the danger pedestrian’s face and the related traffic laws [1] .
The objective of this study was to evaluate the long-term driver behavior at a location continuously monitored by a radar speed display sign entering a university campus. Past studies have shown reductions in speeding violations when radar speed display signs are placed at some location but mainly focused on short term effectiveness. The long-term (i.e. one year or more) effects on travel speeds are still unclear due to few follow-up studies and the effectiveness on changing travel speeds in a university environment is unknown at this time.
2. Literature Review
This literature review focuses on the topics that could have an impact on pedestrian safety regarding the vehicular speeds of vehicles in the area of pedestrian crossing zones. The three main areas included speed reductions, safety, and sign placement. After an extensive literature review it was discovered that little work had been done in a university environment in regards to radar speed display signs, with most studies focusing in residential or elementary school settings. The following summarizes the findings of the literature review and the areas of interest to radar speed display signs.
2.1. Speed Reduction
The Federal Highway Administration [2] offers a guide for reducing speeds with the purpose of improving safety on roadways. The guide provided historical data on the reduction of speeds caused by radar speed display signs in several environments including school (grades K-12), where most of the studies found effectiveness over short periods ranging from 1 week to 6 months. Compiling more-recent literature, research has focused on radar speed display signs use in rural communities [3] [4] , school zones [5] , and work zones [6] ; however no studies were found that studied the effect in a university environment. An average reduction in the 85th percentile speed of 7 mph with a median reduction of 3.5 mph was found from the various studies [7] with a speed reduction that ranged between 1 to 33 mph.
A study in Utah [8] investigated the impact of radar speed display signs in four school zones, looking at short and long-term effects on drivers’ speeds. The short term effect consisted of a two month before and after study which identified a small drop in mean, 85th percentile speed, and the percentage of drivers exceeding the posted 20 mph speed limit. The long-term effects were measured out to six months, finding that over the longer period of time the drivers were less compliant with the posted speed limit and increased their speeds again. The mean speed reductions in this study were 1 to 2 mph.
Research has also evaluated speed-reduction technologies in work zones. One study in South Carolina found an average speed reduction of 2 to 6 mph for a speed-activated flashing beacon above a sign stating, “YOU ARE SPEEDING IF FLASHING”. The study included three sites along two-lane rural secondary highways, data was collected when volumes were low giving opportunity for drivers to travel at their desired speed [6] . Another study of a one-lane freeway work zone along Interstate 95 in Maine found a 7 mph average decrease in vehicle speeds. This study evaluated radar linked to a portable changeable message sign [9] . More recent studies on work zones recommended that a radar speed display sign, in conjunction with a portable changeable message sign, could reduce the 85th percentile speeds up to 6 mph in a freeway work zone [10] .
Similarly, speed reduction signs along curves were found to significantly reduce speeds during a comprehensive study of 22 sites across 7 states resulting in five to seven percent fewer crashes [11] . Other ongoing efforts to evaluate speed-reduction technologies along curves, such as reference [12] , have not published results at the time of this writing.
Overall studies do not always agree on the long-term benefit of radar speed display signs. For example, the City of Belleview, Washington, found effectiveness continued six to eight years after installation on two-lane arterials through residential areas. Some of these study sites even showed continued increases in effectiveness over time [3] . Others have noted positive impacts up to two years on rural curves [11] , work zones [13] , and residential collector roads [5] . But, many studies [4] [14] [15] only report the effectiveness less than one year past installation date.
Other lessons learned from past studies remark that the character size of the speed display must be appropriate for the road speed limit [16] [17] and that speeds returned to normal downstream of radar speed display signs [18] .
2.2. Driving Behaviors in a University Environment
There are several factors that arguable make the driving environment in a University campus unique. Some of these factors include driver familiarity, driver demographics, and the prevalence of pedestrians.
2.2.1. Driver Familiarity
One unique factor at a university is that each semester a large percentage of the drivers are new/unfamiliar drivers traveling to campus for the first time, many of which are working students living off campus commuting in from the surrounding area to attend classes. Drivers typically enter the university campus 16 weeks a semester during the spring and fall for 2 to 4 year period until a degree is earned.
2.2.2. Demographics
The demographics of the drivers passing the study site can generally be broken into the time periods of the study. In the AM peak drivers are of a mixed populations consisting of teenagers to senior citizens. Some are students others are faculty or staff at the university. A similar demographic can be seen in the midday peak. During the PM peak the driver population consists mostly of no traditional students (i.e. students that have entered the workforce before attending college for some time period). Many of the PM drivers have worked during the day and are entering campus to attend night classes.
2.2.3. Pedestrian Prevalence
Pedestrians in a university environment are typically aggressive in nature, a trait common in younger individuals. In the study area parking lots are located on the East side of the road and pedestrians cross four lanes of traffic with a median refuge, to reach dormitories or to access lecture halls.
2.3. Safety
Although the road environment within a University campus core is similar to an urban core because of lower speed limits and higher high pedestrian volumes; University cores are unique because of the familiarity of their drivers and pedestrians, and age of those populations. These factors encourage many Universities to emphasize safety of pedestrians at crosswalks.
According to a report by the National Highway Traffic Safety Administration [19] pedestrian fatalities are on the rise topping 4743 in 2012; a 6 percent increase from the previous year, setting a five year high. Some facts of interest are that 70 percent of the pedestrian fatalities occurred at non-intersection locations and 89 percent occurred during clear weather conditions.
Factors influencing pedestrian fatalities [20] can be placed into four categories: 1) Vehicle and Driver, 2) Physical Environment, 3) Special Conditions, and 4) Pedestrian Behavior. Within each of these categories there are risk factors impacting the safety of pedestrians. Vehicle speed and pedestrian’s perception of vehicle speed were key factors in two of the listed categories [20] , suggesting that the unique population driving and walking through pedestrian campuses raise unique challenges for pedestrian safety. Although other factors, such as roadway geometry, zoning, and availability of pedestrian facilities are important, they can be mitigated with proper design [20] .
Past studies at the federal level [19] have been performed to identify the pedestrian groups at risk for injuries and fatalities. Of the three groups (16 - 20 and 21 - 24) found to be most frequently injured two are present in a university environment and make up a significant portion of the campus population. The groups most frequently involved in fatal pedestrian crashes were not the typical college age student, consisting of pedestrians between the ages of 0 to 15 and 40 to 80+, however that age group that were most frequently injured (i.e. ages 16 - 24) still made up 28 percent of the total fatalities. A reason more injuries occur for the typical college age student is that they are typically in good health and recover quickly unlike the very young and elderly population who are more likely to die from trauma that would only result in an injury to pedestrians in prime health.
Speed feedback signs (i.e. radar speed display signs) were found to lower the total crashes by 5 - 7 percent at locations studied in Arizona, Florida, Iowa, Ohio, Oregon, Texas, and Washington. The crash modification factors (CMF), for all crashes, associated with the study ranged from 0.93 to 0.95 [11] , showing potential for improving pedestrian safety, albeit not specifically on a University campus.
2.4. Placement
Radar speed display signs should not be placed along roadways without speed data supporting the presence of a problem. A study in California and Oregon [7] focused on identifying warrants for the placement of speed display signs in a scientific manner rather than by citizen requests. The study found that when sign placement was based on a perceived problems reported by residents short term effects may be evident; however, long-term effects where not quantifiable, suggesting a need to develop the warrants. The warrants developed that are of particular interest to this study include:
85th percentile and mean speeds exceeding the posted speed limit by 5 mph.
85th percentile and mean speeds exceeding the posted speed limit by 3 mph within the area of a school.
The thresholds for these warrants were identified because research has shown that signs placed in areas where the 85th percentile or mean speeds did not warrant radar speed display signs had little to no long-term effectiveness, resulting in a waste of resources.
3. Method
This research built on a previous study at the same location using another pool of data collected one year after the original study (See Williamson and Fries 2015) and comparing that data to the first data set to identify the long-term effectiveness of a radar speed display sign on drivers.
The methods selected for this study involved taking speed samples during three different time periods in optimal weather conditions on campus during the semester when students were present. Speeds were taken in a single setting on a Tuesday, Wednesday, or Thursday in the peak AM (7:30 am-9:30 am), midday (11:00 am- 1:00 pm), and PM peak (3:30 pm-5:30 pm) periods. A minimum of two hundred speeds were recorded within each time period, covering the peak times when persons travel to the university. The data was collected in late November both semesters, so drivers frequenting campus throughout the fall semester had ample exposure to the radar speed display sign, approximately 3 months.
The radar speed display sign evaluated in this study showed the speed of the approaching vehicles as well as the speed limit to the drivers. The radar speed display sign was movable but had been placed for approximately nine months at the time of the first study and one year and nine months at the time of the second study. Discussions with campus law enforcement indicated that the sign required a power source, limiting the locations for deployment; thus, the sign was left at the same location for an extended period of time. The authors used this opportunity as a test bed for the long-term effectiveness of radar speed display signs in a University environment.
The study location is at a point where vehicles first interact with pedestrians in the university environment. Drivers taking the selected route to campus have exited an interstate or highways with travel speeds of 55 to 65 mph and are required to reduce their speed to 25 mph in increments of 10 mph over approximately two miles. At the location where the speeds were collected, drivers have had three sets of 25 mph speed limit signs over 0.25 miles to react to the speed change before entering campus at the point where pedestrians are present and where the radar speed display sign is placed.
The study location was on the south end of Southern Illinois University Edwardsville campus more than two miles from the nearest signalized intersection and had ideal pedestrian facilities mitigating any effects found to have an impact of safety in past studies [20] . The test approach taken in this research was to record driver speeds as they approached the area of the radar speed display sign and frequented by pedestrians. The researchers used a hand held radar gun to record the vehicle speeds. Lead vehicles were identified and tracked through the study area, no following vehicles were used due to the leading vehicle controlling the speed of all following vehicles. In Figure 1, the location of the initial speed measurement is labeled indicating the point where the radar speed display sign measurement is displayed to the driver. The location where the handheld radar speed measurement was taken can be seen labeled as viewpoint. Drivers were unaware that their speeds were being recorded allowing the data collection team to capture the true driver reaction to radar speed display signs.
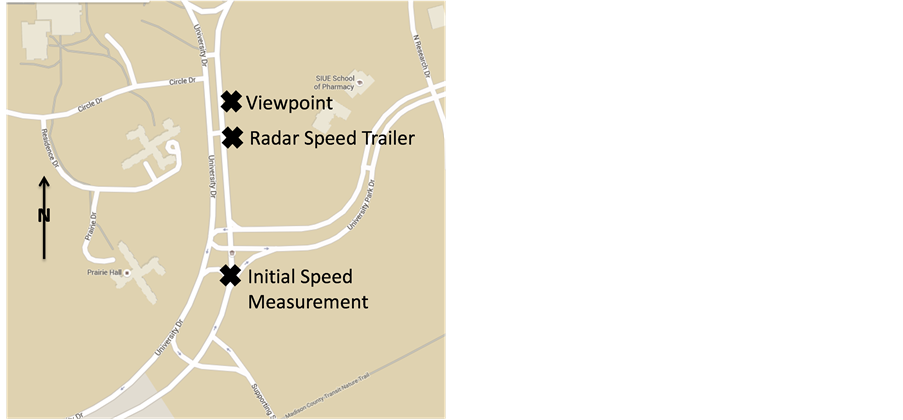
Figure 1. Map of study location (not to scale).
The two speed measurements of each vehicle were compared using a statistical approach to identify the overall effectiveness of the radar speed display sign within each peak period. Two additional groups were tested, 1) those vehicles initially traveling above the posted speed limit and 2) those at-or-below the speed limit.
The data analysis involved using a two sample t-testing of the data set, results with less than 90% significance would not be viewed as effective, results with 95% or 99% significance were desirable and taken to be effective. Data was collected at two separate intervals one year apart during the peak time periods to ensure a non-biased results.
Grouping was first done by examining the driver reactions in each of the time periods (i.e. AM, midday, and PM) for each data set. The data was then combined within each year and separated by speeding vs. speed compliant vehicles. Further analysis was conducted by identifying the 85th percentile in each group for compliance with the posted speed limit of 25 mph.
4. Analysis and Results
The following text explains about the information about the driver’s behavior in compliance with posted speed limits, the analysis and some important findings. The results of the AM, Midday, and PM time periods can be seen in Figure 2 and Table 1. Where the greatest speed decrease is found in the PM time period where drivers were initial traveling at higher speeds, with the statistical test showing the results to be significant. It can also be seen that drivers in the AM and Midday periods increase their speeds overall, but the statistical test shows the increase to not be significant. Where the AM drivers in each data set are least effected by the radar speed display sign, indicated by the high P-values from the two-sample T-Test. The Midday drivers show marginal effects in study one but no effect in study two. The group of drivers most affected by the radar speed display sign was PM drivers with P-values of 0.000 indicating a strong effect to the radar speed display sign. These findings contrast with previous studies where no difference was found between times of the day [8] . These differences in effectiveness could indicate changes in driver populations between the time periods observed.
The 85th percentile speeds of vehicles entering campus of the first and second data set was identified and determined to be 34 mph and 33 mph consecutively, more than 3 to 5 mph above the posted speed limit of 25 mph meeting the warrant for a radar speed display sign in the area [7] . The similarity of the two 85th percentiles taken one year apart also suggest that drivers behave in a similar manner under the given conditions. Drivers entering the study site have previously traveled on a state highway with a speed limit of 55 miles per hour, and have remained aggressive when entering the university disregarding several posted speed limit signs. The mean speed of each data set was found to be 30 mph and 29 mph, greater than the 3 to 5 mph limit found in the literature review.
To further understand drivers behavior related to the effect of the radar speed display sign two groups within each data set were formed consisting of drivers that were in compliance with the posted speed limit and those that were not (i.e. speed violations).
In the first study 85.6% of the drivers that were exceeding the speed limit reduced their speed when warned of the violation with the radar speed display sign. The second study, one year later, had similar results where 80.0% of the drivers that were violating the speed limit and also made speed reductions when warned of a speed violation. The results of these t-tests are shown in Table 2. The low P-values indicate a change in speed in the approach to the radar speed display sign. Study one and two results indicate that drivers significantly reduced their speeds when warned of the speed violation, with more than 99% significance. Inversely drivers within compliance with the posted speed when entering campus also showed a significant change in speeds, however the change was an increase in speed. The significance of the results for the first study group meet the 95%. level indicating the drivers increased their speeds significantly. The results of the second study group indicated only a marginal effect, where most of the speed compliant drivers maintained their speed.
The 85th percentile and mean speed of vehicles at the location where the handheld radar was used was also identified. At this location drivers have had a chance to decelerate to the posted speed limit and statistical testing proved a significate portion of the drivers had reduced speeds within this area. However, the 85th percentile and mean speeds were nearly unchanged, resulting in no more than a 1 mph reduction still well above the desired speed of vehicle in the study area. The vehicle speed reduction in each study group was found to be 0 to 13 mph for the first study group and 0 to 5 mph for the second.
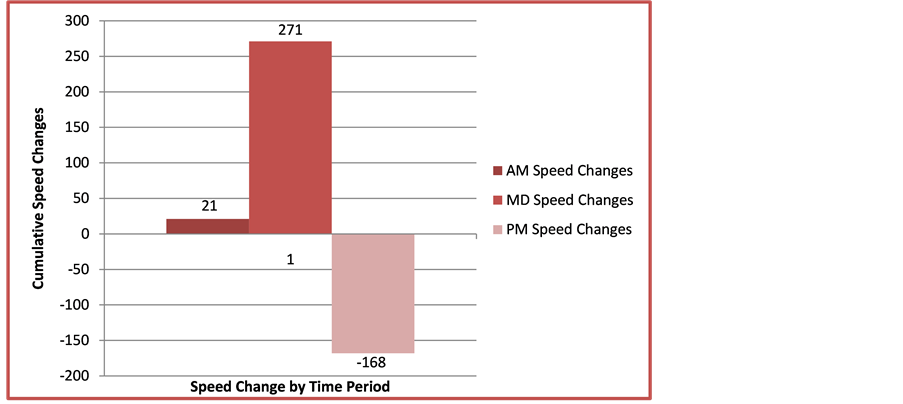
Figure 2. Cumulative speed changes by time period.

Table 1. Two sample t-test by time period.
Table 2. Violation vs. compliance.
5. Conclusions
The authors believe this study to be the first long-term study of a radar speed display sign’s effectiveness on a uni- versity campus environment, therefore providing new valuable information to the pool of knowledge within trans- portation engineering. Two separate groups of data were collected approximately one year apart which allowed the authors to identify the long-term effectiveness of radar speed display signs in a university environment.
One unique discovery during the statistical analysis was that this study was the first to find a significant difference in effectiveness during different times of day, possibly caused by different populations of students entering the university environment. In particular, the data suggested the PM peak drivers, possibly coming from work to campus for evening courses, behaved significantly different than the other two time periods observed. In summary, these findings hint to the uniqueness of the driver populations accessing a university campus core and the effect of a radar speed display sign on their driver behavior.
Cite this paper
Michael R. Williamson,Ryan Fries,Huaguo Zhou, (2016) Long-Term Effectiveness of Radar Speed Display Signs in a University Environment. Journal of Transportation Technologies,06,99-105. doi: 10.4236/jtts.2016.63009
References
- 1. Leaf, W. and Preusser, D. (1999) Literature Review on Vehicle Travel Speeds and Pedestrian Injuries among Selected Racial/Ethnic Groups. U.S. Department of Transportation, Washington DC.
- 2. Federal Highway Administration (2009) Engineering Countermeasures for Reducing Speeds. FHWA, Washington DC.
- 3. City of Bellevue DOT (2009) Stationary Radar Sign Program 2009 Report. Bellevue.
- 4. Hallmark, S.L., Peterson, E., Fitzsimmons, E., Hawkins, N., Resler, J. and Welch, T. (2007) Evaluation of Gateway and Low-Cost Traffic-Calming Treatments for Major Routes in Small Rural Communities. Washington.
- 5. Chang, K., Nolan, M. and Nihan, N.L. (2004) Radar Speed Signs on Neighborhood Streets: An Effective Traffic Calming Device? Proceedings from the 2004 ITE Annual Meeting and Exhibit, Lake Buena Vista.
- 6. Mattox, J.H., Sarasa, W.A., Ogle, J.H., Eckenrode, R.T. and Dunning, A. (2007) Development and Evaluation of a Speed Activated Sign to Reduce Speeds in Work Zones. Proceedings of the 2007 Annual Meeting of the Transportation Research Board, Washington DC.
http://dx.doi.org/10.3141/2015-01 - 7. Veneziano, D., Hayden, L. and Ye, J. (2010) Effective Deployment of Radar Speed Signs. Western Transportation Institute, Bozeman.
- 8. Ash, K.G. (2006) Increasing Speed Limit Compliance in Reduced Speed School Zones. Brigham Young University, Brigham.
- 9. Thompson, B. (2002) Evaluation of Radar Activated Changeable Message Sign for Work Zone Speed Control. Maine Department of Transportation, Augusta.
- 10. Gambatese, J.A. and Zhang, F. (2014) Safe and Effective Speed Reductions for Freeway Work Zones Phase 2. FHWA, Washington DC.
- 11. Hallmark, S.L., Qiu, Y., Hawkins, N. and Smadi, O. (2015) Crash Modification Factors for Dynamic Speed Feedback Signs on Rural Curves. Journal of Transportation Technologies, 5, 9-23.
http://dx.doi.org/10.4236/jtts.2015.51002 - 12. Smadi, O., Hawkins, N., Hallmark, S. and Knickerbocker, S. (2013) Evaluation of the Tapco Sequential Dynamic Curve Warning System. FHWA, Washington DC.
- 13. Fontaine, M.D. and Clarson, P.J. (2001) Evaluation of Speed Displays and Rumble Strups at Rural-Maintenance Work Zones. Transportation Research Record, 1745, 27-38.
http://dx.doi.org/10.3141/1745-04 - 14. Hallmark, S.L., Knickerbocker, S. and Hawkins, N. (2013) Dynamic Speed Feedback Signs for Rural Traffic Calming. Tech Brief, October.
- 15. Sikes, D. (2004) Efficacy of Radar Speed Monitoring Displays in Reducing Vehicle Speeds. 3M Traffic Safety Systems Division.
- 16. Hall, J. and Wrage, E. (1997) Controlling Vehicle Speeds in Highway Construction Zones. Albuquerque.
- 17. Kamyab, A., Maze, T.H., Gent, S. and Poole, C. (2000) Evaluation of Speed Reduction Techniques at Work Zones. Mid-Continent Transportation Symposium Proceedings, Ames.
- 18. Meyer, E. (2000) Midwest Smart Work Zone Deployment Initiative: Kansas’ Results. Mid-Continent Transportation Symposium Proceedings, Ames.
- 19. National Highway Traffic Safety Administration (2014) Traffic Safety Facts. U.S. Department of Transportation, Washington DC.
- 20. Heinonen, J.A. and Eck, J.E. (2007) Pedestrian Injuries and Fatalies. U.S. Department of Justice: Office of Community Oriented Policing Servces, Washington DC.