Open Journal of Energy Efficiency
Vol.1 No.1(2012), Article ID:19591,7 pages DOI:10.4236/ojee.2012.11001
Energy Efficient Hospitals Air Conditioning Systems
Mechanical Engineering, Faculty of Engineering, Cairo University, Cairo, Egypt
Email: khalile1@ASME.org
Received March 5, 2012; revised April 25, 2012; accepted May 15, 2012
Keywords: CFD; Hospitals; Air Conditioning; Energy Efficiency
ABSTRACT
Energy Efficiency and Indoor Air Quality in the healthcare applications and particularly in surgical operating theatres are important features in modernized designs. The various reasons for deviation from obtaining optimum IAQ and energy efficient buildings are listed. The air conditioning systems serving the operating rooms require careful design to minimize the concentration of airborne organisms. Numerical approach is an appropriate tool to be utilized to adequately identify the airflow patterns temperatures and relative humidity distributions and hence energy efficient designs.
1. Introduction
The air quality of the indoor environment affects human comfort in a multitude of ways, depending on the contaminant. Airborne contaminants range from toxic substances such as carbon monoxide to nuisance matter such as large dust particles. The effects of airborne contaminant on humans vary greatly with the nature and type of contaminant. Hospitals and other healthcare facilities are complex environments that require ventilation for comfort and to control hazardous emissions. Ventilation and air distribution pattern have a great effect on the IAQ; also air movement in a room becomes of vital importance to comfort. To design and construct ventilation system that is capable of efficiently fulfilling all requirements, often even contradictory, is a great challenge [1-14].
2. IAQ Index, Factors and Hygiene
Comfort air conditioning is defined as “the process of treating air to control simultaneously its temperature, humidity, cleanliness, and distribution to meet the comfort requirements of the occupants of the conditioned space.” The ASHRAE standard 55-targeted quoted. “Thermal comfort is that condition of mind that expresses satisfaction with the thermal environment.”
2.1. Indoor Temperatures and Relative Humidity
Relative humidity affects our comfort in numerous ways both directly and indirectly. It is a thermal sensation, skin moisture, discomfort, and tactile sensation of fabrics, health and perception of air quality. Low humidity affects comfort and health. In hot climates, it is recommended to set the temperature from 16˚C to 22˚C at the working domain with relative humidity of 45% to 55%.
2.2. Airflow Velocity
The laminar airflow concept developed for hospitals, healthcare facilities and clean room use has advocated the need for both vertical and horizontal laminar airflow systems, around the surgical team. The unidirectional laminar airflow pattern is commonly attained at a discharge velocity of 0.45 ± 0.10 m/s.
2.3. Pressure Relationship
Ventilation recommendations for comfort, asepsis, and odor control in areas of acute care in hospitals that directly affect patient care are presented by the healthcare standards. Positive pressure is recommended and maintained in operating theatres with high air changes per hour up to 40 ACH
2.4. Air Movement Efficiency
In hospital facilities, the air movement takes an extra important role in the controlling of the healthy criteria. Undesirable airflow between rooms and floors is often difficult to control because of open doors, movement of staff and patients, temperature differentials, and stack effect. It should be emphasized that the air distribution and direction play the more important role in the airborne-infectious-disease management; good IAQ starts with building design.
3. Numerical Method
Three time averaged velocity components in X, Y, and Z coordinate directions were obtained by solving the governing equations using a “SIMPLE Numerical Algorithm” [Semi Implicit Method for Pressure Linked Equation] described earlier in the work Spalding and Patankar, [14], Launder and Spalding, [15], Khalil [16]. The turbulence characteristics were represented by a two-equation k-e model that accounts for normal and shear stresses and nearwall functions. Fluid properties such as densities, viscosity and thermal conductivity were obtained from references. The present work made use of the Computer Program 3DHVAC, which was developed, by Khalil [5] and modified later by Kameel [7,8], and by Kameel and Khalil [9-13]. The program solves the differential equations governing the transport of mass, three momentum components and energy in three-dimensional configurations under steady and unsteady conditions. It uses the SIMPLE algorithm with orthogonal three dimensional meshes of grid nodes that covers the calculation zone (Figure 1).
The different governing partial differential equations are typically expressed in a general form as:
 (1)
(1)
where:
ρ = Air density, kg/m3;
Φ = Dependent variable;
V = Velocity vector;
ΓΦ,eff = Effective diffusion coefficient;
SΦ = Source term of Φ.
The effective diffusion coefficients and source terms for the various differential equations are listed in Table 1.

Table 1. Values of Φ, ΓΦ,eff, and SΦ for partial differential equations.
 (a)
(a)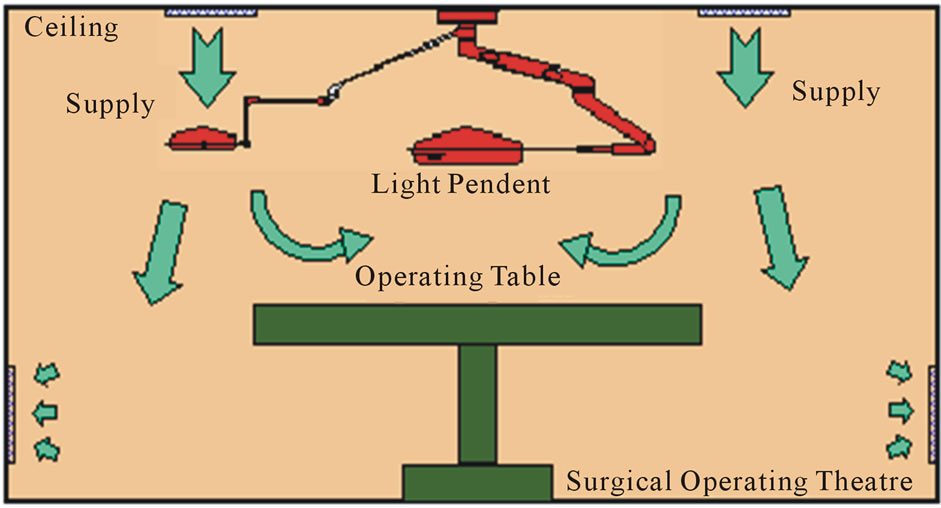 (b)
(b) (c)
(c)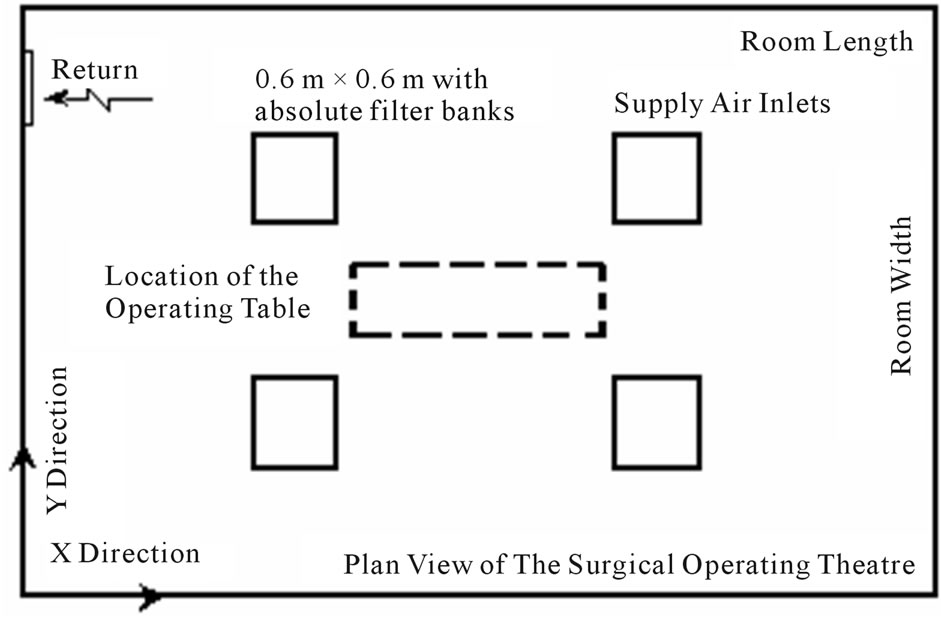 (d)
(d)
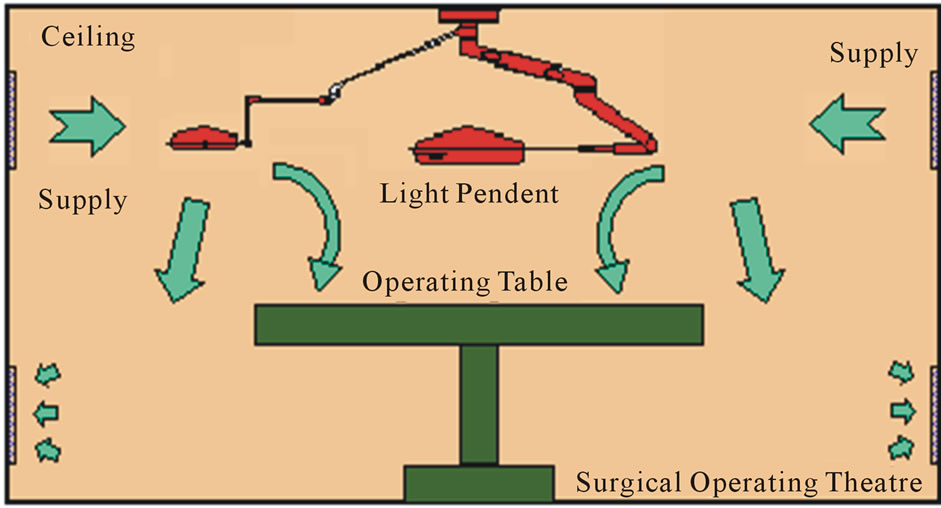
Figure 1. Proposed Airside Designs of HVAC Systems Serve the Surgical Operating Theatres. (a) Design A Configuration(X-Z plane); (b) Design B Configuration(X-Z plane); (c) Design C Configuration(X-Z plane); (d) X-Y Plan view of operating theatre.
The Computational Fluid Dynamics (CFD) model utilizes the following approximations in calculating the turbulence quantities, such as isotropic turbulence and the Boussinesq eddy viscosity concept.
3.1. Boundary Conditions
The solution of the governing equations can be realized through the specifications of appropriate boundary conditions. The values of velocity, temperature, kinetic energy, and its dissipation rate should be specified at all boundaries.
3.2. External Walls
A non-slip condition at all solid wall is applied to the velocities. The logarithmic law of the wall (wall function) of Launder and Spalding [15] was used here, for the near wall boundary layer.
3.3. Air Supply Inlets
At inlets, the air velocity was assumed to have a uniform distribution; inlet values of the temperature were assumed to be of a constant value and uniform distribution. The kinetic energy of turbulence and its dissipation rate are commonly estimated as follow.
kin = 3 (0.5 (Iin Uin)2)
εin = Cm (kin)1.5/lewhere
Iin = Intensity of disturbance at air inlet.
le = Dissipation length at air inlet.
3.4. Initial Guessed Values
All velocity components were set as zeros initially, and temperatures were assumed to be equal to the steady state value of the comfort condition. The kinetic energy and its dissipation are estimated in the following manners.
kinitial = 11E−5, εinitial = Cm(kinitial)1.5/c.d
where c = constant, and d = distance to nearest sidewall.
3.5. Numerical Procedure
The Computer Program, 3DHVAC is used to solve the time-independent (steady state) conservation equations together with the standard k-e model as Launder and Spalding [15], Khalil [16] and Khalil et al. [17], and the corresponding boundary conditions. The numerical solution grid divided the space of the surgical operating theatre into discretized computational cells 500,000 grid nodes using the procedure of Kameel and Khalil [18]. The discrete finite difference equations were solved with the SIMPLE algorithm, Patankar, [19]. Solution convergence criteria, was applied at each iteration and ensured the summations of normalized residuals were less than 0.1% for flow, 1% for k and e, and 0.1% for energy.
3.6. Model Validation
Previous comparisons between measured and predicted flow pattern, turbulence characteristics, and heat transfer were reported earlier in the open literature utilizing the present computational capabilities (3DHVAC), reference should be made to these for further details and assessments. A summary of the main assessment is expressed here as follows. The predictions of flow and turbulence characteristics are in general qualitative agreement with the corresponding experiments and numerical simulations published by others, Blum, [20], Neilsen, [21] were shown the work of Kameel [8]; the trends are in adequate agreement for engineering purposes. Nevertheless discrepancies exist and particularly in the vicinity of recirculation zone boundaries. More discrepancies were also observed in situation with heating flows than those of ventilation or cooling. For more details of validations for present application (Surgical Operating Theatres) review the work of Kameel and Khalil [13] and [22-24]. These papers describe the validation of the turbulence model to use it for the prediction of airflow characteristics in the surgical operating theatres. Also, these papers introduce a complete case study performed in a 1200 bed teaching hospital (New Kasr El-Aini Teaching Hospital, Cairo University).
4. Results and Discussion
Figure 2 shows prediction results of the proposed designs “A”, “B”, and “C”. The three designs are simulated for the same ACH condition and different flow patterns were developed in the vicinity of the supply diffusers of each case. The present flow pattern, turbulence, and temperatures contours were predicted and represented as zonal areas. Each air characteristic, (velocity “V”, turbulent kinetic energy “K”, temperature “T”, and local mean age “LMA”), is divided into two clear zone categories, acceptable and rejected zones. The acceptable zone category is the area that containing the desired design values of the considered characteristic (F), and the other space is the rejected category zone for the same air and flow characteristics. The areas that are allocated on the figures represent the rejected zones of each flow characteristic. If we suppose that the area of refused value for any characteristics (F) is R(F), then the area of acceptable values is A(F)= [1 − R(F)]. The identification and allocation of the unacceptable zones are aimed to highlight the final optimum clean and recommended areas of occupancy in the domain, which has all acceptable values for all air characteristics.
The optimum area of the operating theatre is the U(D), where U(D) = [A(F1) ∩ A(F2) ∩ ∙∙∙ ∩ A(Fn)], and n is
 (a)
(a) (b)
(b) (c)
(c)
Figure 2. Prediction Results of Proposed Airside Designs of HVAC Systems, (X-Z plane). (a) Prediction Results of Design “A”, (X-Z plane); (b) Prediction Results of Design “B” (X-Z Plane); (c) Prediction Results of Design “C”.
the numbers of characteristics involved in the investigation. Indeed, it is so simple to calculate U(D) = 1 − [R(F1) U R(F2) U ∙∙∙ U R(Fn)]. For the present work, the calculation of U(D) = 1 − [R(V) U R(K) U R(T) U R(LMA)]. So in the un-shaded area represents the optimum domain in the proposed designs.
From the results, one can observe that the proposed design “B” doesn’t provide any optimum clean occupancy area or healthy area in the room according the proposed analytical previous equations. The proposed design “B” is completely unaccepted design model and should be excluded from any future recommendations of the HVAC designs.
According to the design parameter of supplying the same ACH, the supply air velocity in the case of design “A” is greater in magnitude than the corresponding velocity of design “C”. That leads to decrease the maximum LMA value of design “A” than the corresponding value of design “C”. But still, the unacceptable are of LMA values concentrated over the operating table. The LMA values in the vicinity of the extract ports is found to be less than the corresponding LMA values in the vicinity of the operating table, this indicates the increasing of contaminant concentration in the operating zone.
Indeed, the air distribution pattern is participating strongly in characterizing the LMA distribution pattern. The short circuit between the supply inlets and extract ports in case “A”, not only, participated of creating a poor airflow movement over the operating table and correspondingly poorer scavenging, which decreased the hygiene level, but also, expensed the most of the conditioned air (paid for air) by throwing it without any useful utilization. The proper description of the design “A” is “inefficient sick design”. On the other hand the proposed design “C” gave a perfect protection in the vicinity of the operating table and created the proper conditions in the operating area as a whole.
5. Analyses
The Figures 3-6 represent the conventional flow patterns, temperature and relative humidity distributions in the typical operating theatres configurations in the vertical plane (X-Z directions).
These predictions were obtained for room configurations of 6 m × 5 m and height 3 m in the X, Y and Z coordinates directions, with a middle table of 2 m length; 0.5 m wide and 1.0 m above finished floor. The surgical team is distributed around the table and was treated both physically and as source of heat and moisture. The lighting pendent was ceiling mounted .The air velocity from the ceiling plenum was 0.287 m/s. The effects of the presence of the surgical team and lighting pendent are clear on the velocities, temperatures and relative humidity contour distributions, Khalil, [25-28].

Figure 3. Predicted air velocity patterns.
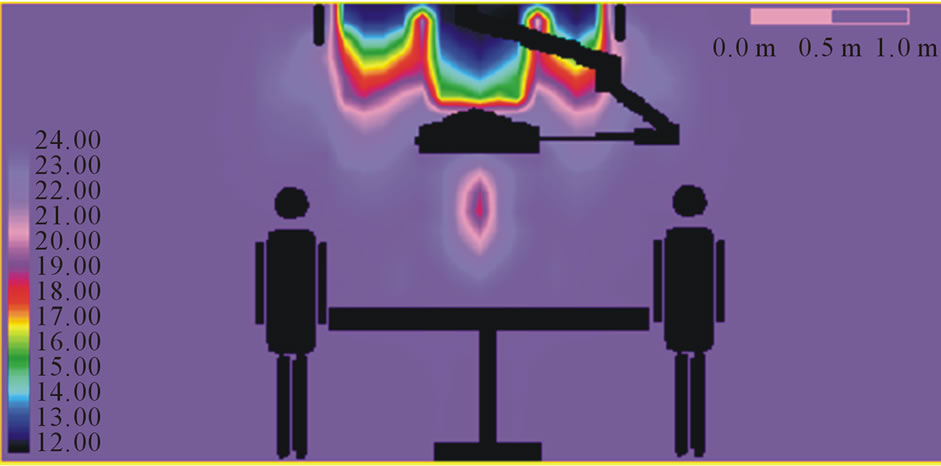
Figure 4. Air temperature patterns.
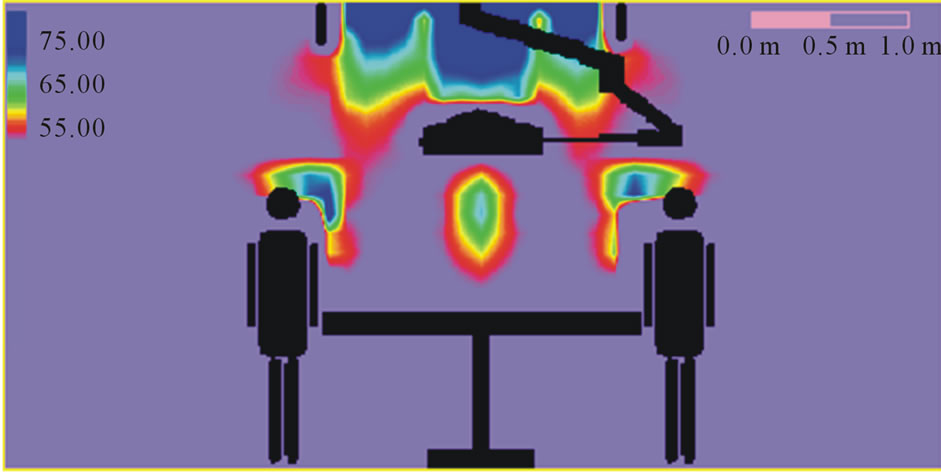
Figure 5. Relative humidity patterns.

Figure 6. Kinetic energy of turbulence patterns.
The following tips represent the average more general and effective tips and hints to energy managers:
1) Define Energy Management through typical Operation and maintenance perceptions; hospital energy management is both mandatory and essential.
2) Determine available data such as metered Data, Data bases, reporting tools, and Energy costs, Equipment Energy Efficiency/Performance, Direct Digital Control/ Energy Management Systems, available Operation Manuals and Building Energy Performance
3) Select your hospital energy management team who can easily appreciate management concepts and energy efficient operation and auditing. Develop lines of communication and evaluate available staff resources, capabilities, required training
4) Involve Operators and Maintenance Team on the location; solicit their ideas, they know their systems best and already often have good energy efficiency ideas; determine what would be required to implement an electrical efficiency measure. Apply low-to-no cost options and evaluate ability to not sacrifice comfort or productivity while implementing an energy efficiency measure then identify how to make an energy efficiency measure systematized.
5) Select priority for energy saving through HVAC control, Lighting control, Process systems, Chillers and boilers. For that use potential team members that may include energy, utilities, facilities, Operation and maintenance and end-user stakeholders. Involve someone experienced with implementing energy efficiency procedures to facilitate the process. Collect adequate information and data; optimize use or turn it off if you can. Establish a mechanism to facilitate communication; do not walk away; set-up a mechanism to continually apply energy efficiency measures
6) It is very imperative to involve operations and facility staff on the team and attempt to understand their perspective, make it clear that suggested improvements are not a reflection of their current performance.
7) Measure and estimate how much energy is being used by different equipment, utilizing available meters and measurement instruments. The energy efficiency performance of facilities is to be evaluated through the knowledge of energy use data per gross floor area or other means to establish a rating/comparison; careful analyses of simulation data or engineering calculations should be followed.
8) Implement the energy efficiency operational ideas such as the low-to-no cost ideas and maintain communication among people involved and measure performance of the operational changes.
9) Measure where needed to determine savings from operational changes, in case you already have meters and sufficient measurement tools; determine if the data is being properly evaluated .Evaluate energy data and energy efficiency operational changes and document any successes and savings.
10) Operational changes need to be continually implemented and properly documented and retained specially implementation plan to track key energy efficiency operational changes. Maintain communication between Energy Manager, operators, maintenance, and management and document savings to justify energy efficiency program.
6. Concluding Remarks
The complexity of HVAC systems in healthcare premises is increasing due to the additional functions. The HVAC system in this case is intended to provide the comfort and to remove any airborne contaminants that are produced in this application. These design criteria do not influence the HVAC system only, but may also require a special care in the architectural design and including the choice of the room furniture and its location. The designers of HVAC systems should consider, for energy optimization, the importance of the air distribution; the positioning of operating furniture and the using of partial walls may be useful to maintain the air environment in the surgical operating theatres.
It is believed that for the purpose of the energy-efficient operation Air Conditioning and other systems in large healthcare facilities, the energy manager should take into account the tips that are set here in this work. Different actors need different information. For giving relevant advice to the property owner which measures are cost-effective a very careful examination and calculation of the building’s energy balance is necessary. A careful analysis is also necessary to give relevant information to the users how they can decrease their energy use without decreasing, under an acceptable level, the indoor air quality and thermal comfort.
7. Acknowledgements
The author would like to acknowledge the assistance given to him by his colleagues and students, particular thanks are due to Dr. R. Kameel and Dr. A. Medhat and Eng. Rana Khalil.
REFERENCES
- L. G. Berglund, “Comfort and Humidity,” ASHRAE Journal, Vol. 40, No. 8, 1998, pp. 35-41.
- M. H. Hosni, K. Tsai and A. N. Hawkins, “Numerical Predictions of Room Air Motion,” ASME Fluids Engineering Division Conference, Part 2, 1996, pp. 745-750.
- A. M. Medhat, “Air Conditioning Flow Patterns in Enclosures,” M.Sc. Thesis, Cairo University, Cairo, 1993.
- E. E. Khalil, “Three-Dimensional Flow Pattern in Enclosures,” Interim Report, Egyptalum, Egypt, 1994.
- E. E. Khalil, “Fluid Flow Regimes Interactions in Air Conditioned Spaces,” Proceedings of 3rd Jordanian Mechnical Engineering Conference, Amman, May 1999.
- E. E. Khalil, “Computer Aided Design for Comfort in Healthy Air Conditioned Spaces,” Proceedings of Healthy Buildings 2000, Finland, Vol. 2, 2000, pp. 461-466.
- R. Kameel, “Computer Aided Design of Flow Regimes in Air Conditioned Spaces,” M.Sc. Thesis, Cairo University, Cairo, 2000.
- R. Kameel, “Computer Aided Design of Flow Regimes in Air Conditioned Operating Theatres,” Ph.D. Thesis Work, Cairo University, Cairo, 2002.
- R. Kameel and E. E. Khalil, “Computer Aided Design of Flow Regimes in Air Conditioned Spaces,” Proceedings of ESDA2000 ASME 5th Biennial Conference on Engineering Systems Design & Analysis, Monteux, 2000.
- R. Kameel and E. E. Khalil, “Fluid Flow and Heat Transfer in Air Conditioned Spaces,” International Conference of Energy Systems (ICES), Amman, September 2000, 2K, pp. 188-200.
- R. Kameel and E. E. Khalil, “Numerical Computations of the Fluid Flow and Heat Transfer in Air-Conditioned Spaces,” NHTC2001-20084, 35th National Heat Transfer Conference, Anaheim, 2001.
- R. Kameel and E. E. Khalil, “Air Quality Appraisal in Air Conditioned Spaces: Numerical Analyses,” Proceedings of 4th IAQVEC Conference, Changsha, 2001, pp. 287- 297.
- R. Kameel and E. E. Khalil, “Verification of Numerical Prediction of 3-D Air-Conditioned Flow Behavior in Full and Reduced Scale Room Models,” 40th Aerospace Sciences Meeting & Exhibit, Reno, Nevada, AIAA-2002-654, 12-15 January 2002.
- D. B. Spalding and S. V. Patankar, “A Calculation Procedure for Heat, Mass and Momentum Transfer in Three Dimensional Parabolic Flows,” International Journal of Heat and Mass Transfer, Vol. 15, 1974, pp. 1787-1799.
- B. E. Launder and D. B. Spalding, “The Numerical Computation of Turbulent Flows,” Computer Methods in Applied Mechanics and Engineering, Vol. 3, No. 2, 1974, pp. 269-275. doi:10.1016/0045-7825(74)90029-2
- E. E. Khalil, “Flow, Combustion & Heat Transfer in Axisymmetric Furnaces,” Ph.D. Thesis, London University, London, 1977.
- E. E. Khalil, D. B. Spalding and J. H. Whitelaw, “The Calculation of Local Flow Properties in Two-Dimensional Furnaces,” International Journal of Heat and Mass Transfer, Vol. 18, 1975, pp. 775-792. doi:10.1016/0017-9310(75)90207-0
- R. Kameel and E. E. Khalil, “Generation of the Grid Node Distribution Using Modified Hyperbolic Equations,” 40th Aerospace Sciences Meeting & Exhibit, Reno, Nevada, AIAA-2002-656, January 2002.
- S. V. Patankar, “Numerical Heat Transfer and Fluid Flow,” Hemisphere Pub., WDC, 1980.
- H. M. Blum, “Experimental Verification of Turbulence Models,” ASHRAE Fundamentals, Vol. 1, PT30, ASHRAE, Atlanta, 1956.
- P. V. Nielsen, “Numerical Prediction of Air Distribution in Rooms,” ASHRAE, Building Systems: Room Air and Air Contaminant Distribution, 1989.
- R. A. Kameel and E. E. Khalil, “Numerical Computations of Thermal Comfort and Air Quality in Air-Conditioned Healthcare Applications,” ASME Congress 2006, Paper IMECE-13354, November 2006.
- E. E. Khalil, “Flow Regimes and Thermal Patterns in Air Conditioned Operating Theatres,” Proceedings Climamed 2006, Lyon, November 2006.
- R. A. Kameel and E. E. Khalil, “Numerical Investigation of the Airborne Contaminant Age in Surgical Operating Theatres,” AIAA Paper, AIAA-2007-0807, January 2007.
- E. E. Khalil, “Numerical Computations of Air Flow Regimes in Healthcare Facilities and Their Experimental Verifications,” IECEC Paper, AIAA-2009-4510, August 2009.
- E. E. Khalil, “Thermal Comfort and Air Quality in Sustainable Climate Controlled Healthcare Applications,” AIAA-2010-0802, Orlando, January 2010.
- E. E. Khalil, “Holistic Approach to Green Buildings from Construction Material to Services,” Proceedings of International Conference on Air-Conditioning & Refrigeration (ICACR2011), Korea, July 2011, pp. 1-7.
- E. E. Khalil, “Energy Efficiency, Air Flow Regime and Relative Humidity in Air-Conditioned Surgical Operating Theatres,” Proceedings ASHRAE, Paper ASHRAE-2012- CH-12-C056, January 2012.
Nomenclature
Cμ Turbulence model constant.
h Enthalpy, Kj/kg
k Turbulence kinetic energy, m2/s2.
U,V,W Instantaneous components of velocity in three directions, m/s.
X,Y,Z Coordinate directions.
L,W,H Length, width, height of the theatre.
Lo Length of the outlet air supply, m
δij Kroncker delta function.
ε Turbulence dissipation rate.
Φ General dependent variable.
Γ Exchange coefficient.
μ Absolute viscosity of air, kg/ms.
ρ Density of air, kg/m3.
σ Effective Prandtl number.
Subscripts
I, ,j k Denoting Cartesian coordinate direction takes the values of axes X, Y, Z.