Advances in Nanoparticles
Vol.2 No.2(2013), Article ID:31459,7 pages DOI:10.4236/anp.2013.22013
Structural Characterization of Nanocrystalline Ni(50−X)Ti50CuX (X = 5, 9 wt%) Alloys Produced by Mechanical Alloying
Materials Engineering Department, Najafabad Branch, Islamic Azad University, Isfahan, Iran
Email: *bahman_nasiri@hotmail.com
Copyright © 2013 Bahman Nasiri-Tabrizi, Abbas Fahami. This is an open access article distributed under the Creative Commons Attribution License, which permits unrestricted use, distribution, and reproduction in any medium, provided the original work is properly cited.
Received December 30, 2012; revised February 1, 2013; accepted February 8, 2013
Keywords: Nanocrystalline Alloy; Mechanical Alloying; Phase Analysis; Structural Features
ABSTRACT
Nanocrystalline Ni(50−X)Ti50CuX (X = 5, 9 wt%) alloys were successfully produced by mechanical alloying. Mechanical activation was performed at different milling times under a high purity argon (99.998 vol%) atmosphere. Phase analysis and structural features of the samples were examined by X-ray diffraction (XRD). Results revealed that NiTiCu (B2) phase was achieved after 600 min of milling. The formation of this phase was mostly related to the critical factors in determining the site replacement of elements in Ni-Ti-Cu ternary system. After 600 min of milling, the average crystallite size and lattice strain of the samples were about 5 - 10 nm and 1.057% - 1.967%, respectively. Evaluation of the full width at half maximum (FWHM) values for all the samples indicated the occurrence of anisotropic line broadening. The determined amounts of crystallinity revealed that the fraction of crystalline phase decreased with increasing weight percentage of copper up to 9% and reached a minimum value after 600 min of milling. The lattice parameters and the unit cell volume of the milled samples were always larger than the standard values. In addition, lattice parameter deviation influenced by the weight percentage of copper. Based on the obtained data, mechanical alloying process can be used for production of nanocrystalline NiTiCu alloys with different structural features.
1. Introduction
NiTi shape memory alloys (SMAs) have been widely utilized in different fields of aerospace and medicine due to their superior shape memory effect and higher superelasticity compared to other shape memory alloys [1]. It has been reported that the shape memory properties of NiTi alloys can be modified by adding ternary elements such as Al and Cu which are chemically similar to Ti and Ni, respectively [2]. The addition of Al to NiTi alloys is quite attractive for the remarkably improvement of room and high temperature strength [3]. Therefore, NiTiAl alloys are desirable candidate materials for high temperature structure applications. On the other hand, the addition of Cu to NiTi alloys reduces the sensitivity of the transformation temperatures to the chemical composition and to the thermal treatment time, diminishes the thermal hysteresis, reduces the mechanical hysteresis in the pseudoelastic regime and enhances the thermomechanical cycling stability [4].
To date, several methods have been developed to synthesize NiTi-based alloys such as conventional powder metallurgy, self-propagating high temperature synthesis (SHS), shock synthesis and mechanical alloying (MA) [5]. Among these methods, MA is a powder technique that allows production of homogeneous materials from blended elemental powder mixtures. In this method, melting is not essential and the products have nanostructural characteristics as a result MA has been applied to produce all material classes including metals, ceramics, and polymers [6]. In the field of metallic structures, a number of investigations were carried out to prepare a variety of stable and meta-stable phases, including supersaturated solid solutions, crystalline and quasi-crystalline intermediate phases, and amorphous alloys [7]. However, there are a few papers about the structural characterization of the nanocrystalline Ni(50−X)Ti50CuX alloys produced by MA process [8,9].
In this work, MA of the Ni(50−X)Ti50CuX (X = 5, 9 wt%) system and the structural features of the experimental outcomes were examined. Also, the phase transitions and fraction of crystalline phase after MA process at different circumstances were investigated.
2. Materials and Methods
2.1. Synthesis of Nanocrystalline Alloys
The powders of Ti (Merck, 98%), Ni (Scharlau, 99.8%) and Cu (Sigma Aldrich, 99.5%) were used as raw materials. The elemental powders with the nominal composition of Ni(50−X)Ti50CuX (X = 5, 9 wt%) were mechanically alloyed in a planetary ball mill under a high purity argon (99.998 vol%) atmosphere. The high purity argon was served to prevent extra phase formation such as TiNi during MA. Mechanical activation was carried out at room temperature in tempered chrome steel vials (vol. 125 ml) and balls (20 mm in diameter). The ball-topowder weight ratio and the rotational speed were 20:1 and 600 rpm, respectively. In all experiments the total powder mass was 6 gr. To prevent the agglomeration of powders during milling, 1 wt% of stearic acid was used as a process control agent (PCA). In addition, 45 min ball milling duration was followed by an interval of 15 min in order to avoid excessive temperature rise within the grinding vial. Details of process specifications and abbreviated name of products are given in Table 1.
2.2. Characterization of Nanocrystalline Alloys
Phase analysis of products was carried out by X-ray diffraction (Philips X-ray diffractometer (XRD), Cu-Kα radiation, 40 kV and 30 mA). For qualitative analysis, XRD graphs were recorded in the interval 10˚ ≤ 2θ ≤ 70˚ at scan speed of 1˚/min. “PANalytical X’Pert HighScore” software was used for the analysis of the diffraction patterns. The patterns were compared to standards compiled by the Joint Committee on Powder Diffraction and Standards (JCPDS), which involved card #001-1260 for Ni, #044-1294 for Ti, #004-0836 for Cu and #019-0850 for NiTi. Average crystallite size and lattice strain of the samples were determined using the XRD data according to the following equations [10]:
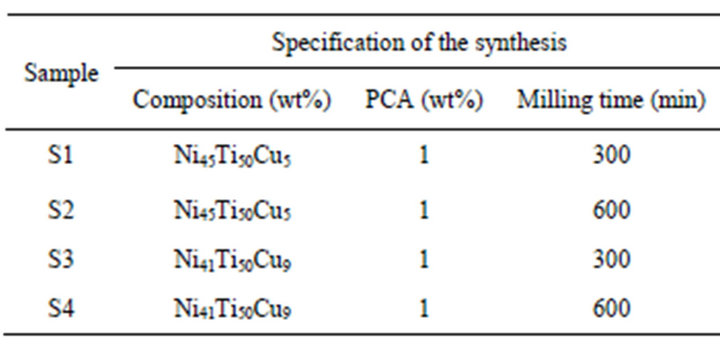
Table 1. Specifications of the synthesis process and abbreviated name of specimens.
 (1)
(1)
 (2)
(2)
where b (in radians), K, λ, D, E and θ are the structural broadening, shape coefficient (between 0.9 and 1.0), the wavelength of the X-ray used (0.154056 nm), crystallite size, lattice strain and the Bragg angle (˚), respectively. If we assume that a crystallite is a sphere of diameter D surrounded by a shell of grain boundary with thickness t, the volume fraction of grain boundary, f, is approximately [11]:
 (3)
(3)
Values of f were calculated from this equation by substituting the experimental crystallite size obtained by XRD with D under the assumption of t = 1 nm.
Moreover, for the cubic structure, the lattice parameter a of a given plane with Miller indices (hkl) can be derived using the following equation [12]:
 (4)
(4)
The (111) and (110) reflections were chosen for the lattice parameters calculation of Ni and B2-NiTiCu, respectively. In addition, volume of the cubic unit cell was determined by the following formula [12]:
 (5)
(5)
The lattice parameter and unit cell volume deviations (in terms of %) were shown as [1]:
 (6)
(6)
 (7)
(7)
∆a and ∆V are defined as: ∆a = a − a0 and ∆V = V – V0, respectively. Where a0 is the standard value of lattice parameter which equals to 0.35175 nm for Ni and 0.29720 nm for B2-NiTiCu and a is the lattice parameter of the specimens. Also, V0 is the standard value of unit cell volume which equals to 0.04352 nm3 for Ni and 0.02625 nm3 for B2-NiTiCu and V is the lattice parameter of the samples.
The fraction of crystalline phase (crystallinity) was determined from the XRD data using the following equation [13]:
 (8)
(8)
where Xc, K and B are the fraction of crystalline phase, a constant found equal to 0.24 and FWHM (˚) of selected reflection peaks, respectively.
3. Results and Discussion
3.1. Phase Evolution
Figure 1 shows the XRD patterns of the Ni45Ti50Cu5 mixed powders as a function of MA time. For comparison, the XRD patterns of the standard samples including #001-1260 for Ni, #044-1294 for Ti and #004-0836 for Cu are also shown in the same figures. At early stage of MA (milled for 5 min), the phase compositions were Ni, Ti and Cu. After 300 min of milling, broadening of the peaks and a significant decrease in the line intensity of Ni and Ti were dominant. Besides, all the peaks corresponding to Cu were vanished and B2-NiTiCu as a new phase was emerged. With further MA up to 600 min, the Ni and Ti diffraction lines were disappeared completely, and only broadened fundamental B2-NiTiCu peaks were observed.
Figure 2 displays the XRD profiles of the Ni41Ti50Cu9 mixed powders after different milling times. Similar to previous figure, the XRD patterns of the standard samples including #001-1260 for Ni, #044-1294 for Ti and


Figure 1. XRD patterns of the Ni45Ti50Cu5 mixed powders Figure 2. XRD profiles of the Ni41Ti50Cu9 mixed powders
as a function of MA time. as a function of MA time.
#004-0836 for Cu are also presented. In these samples, similar to pervious composition, after 300 min of milling, a considerable decline in the line intensity of the raw materials was observed. Finally, after 600 min of milling all the peaks corresponding to the starting materials were disappeared and only characteristic peaks of B2-NiTiCu were detectable.
In Ni-Ti-Cu ternary system the transformation occurs in two steps, as indicated by M’s and Ms, respectively, upon cooling (Figure 3(a)). The martensite upon the first transformation is called B19 (orthorhombic), and the second transformation represents the one from B19 to B19'. As can be seen in this figure, the martensitic transformations in Ni(50−X)Ti50CuX alloys have composition dependence. Thus we may classify the three types of transformations as shown in Figure 3(b). Based on this scheme, all alloys have a tendency to transform from B2 (cubic) to B19' (monoclinic) martensite in NiTi-based alloys. However, depending upon the circumstances (composition and heat-treatment) only the first transformation may take place, and the second one may be lost, because the possible transformation temperatures for the second one to B19' becomes too low (i.e. below 0 K) in that case.

Figure 3. (a) Cu-content dependence of transformation temperatures for Ni(50−X)Ti50CuX alloys; (b) Three transformation paths in Ti-Ni-based alloys.
3.2. Lattice Parameter
In accordance with XRD profiles, plastic deformation and cold welding of the powder particles, essential to mixing by means of solid-state diffusion of the Ni, Ti, and Cu atoms, were only observed after 600 min of milling. These phenomena led to the formation of B2-NiTiCu phase with a body centered cubic structure. Displacement of Ni peaks towards lower angles was observed after 5 min of milling and increasing of MA time to 300 min caused the further displacement of Ni peaks as shown in Figures 4(a) and (c).
This suggests that lattice parameter of Ni increased with MA time due to diffusion of larger atoms of Ti and Cu into the Ni lattice resulting in the formation of B2- NiTiCu phase. Besides, after 300 min of milling the peaks become broader and have reduced intensity, indicating some refinement of the structure, as shown in Figures 4(b) and (d).
As can be seen in this figure, with increasing weight percentage of copper up to 9% (S3) the peaks corresponding to Ni became broader as a result the FWHM of (111) plane reached 0.6604 (˚) after 300 min of milling. This effect is attributed to the formation of high density of dislocations during milling and consequently formation of subgrain structure.
As previously mentioned, displacement of Ni peaks towards lower angles was observed after mechanical activation which exhibits the lattice parameter of Ni enhanced with MA time due to diffusion of larger atoms of Ti (1.47 nm) and Cu (1.28 nm) into the Ni (1.25 nm) lattice. The lattice parameter, unit cell volume of Ni and B2-NiTiCu and their deviations are presented in Table 2.
Based on this table, the lattice parameter and unit cell volume of mechanically alloyed Ni and B2-NiTiCu were always larger than the standard values. This effect is ascribed to the large amount of strain which imparted to particles during the milling process. Moreover, in the presence of 5 wt% Cu (S1) the lattice parameter and unit cell deviations of the Ni reached a maximum after 300 min of milling. Also, the lattice parameter and unit cell deviations of the B2-NiTiCu significantly influenced by

Table 2. Lattice parameter, unit cell volume of Ni and B2- NiTiCu and their deviations.

Figure 4. (a), (c) Displacement of Ni peaks towards lower angles, (b), (d) broadening of the peaks and a significant decrease in the line intensity of Ni (111) after 5 h of milling.

Figure 5. The average crystallite size, volume fraction of grain boundaries, and lattice strain of the: (a)-(c) Ni45Ti50Cu5 and (d)-(f) the Ni41Ti50Cu9 mixed powders as a function of MA time.
the weight percentage of copper so that these values for S4 sample with 9 wt% Cu were higher than the S2 sample with 5 wt% Cu. These results showed with increasing weight percentage of copper up to 9% the lattice parameter of B2-NiTiCu significantly deviates from the actual NiTiCu. This can be attributed to the formation of B2-NiTiCu with a non-stoichiometric composition. Conversely, in percentage of 5 wt% Cu deviation of lattice parameter decreased and approached actual B2-NiTiCu.
3.3. Crystallite size and Lattice strain
Figure 5 shows the effect of milling time on the average crystallite size, volume fraction of grain boundaries, and lattice strain of Ni, Ti, Cu, and B2-NiTiCu in Ni-Ti-Cu ternary system.
According to this figure, in all the samples crystallite size of the Ni, Ti, Cu, and B2-NiTiCu decreased with increasing milling time. Conversely, the lattice strain and volume fraction of grain boundaries enhanced with increasing milling time. This phenomenon was attributed to the effect of mechanical activation on the structural features.
Finally, in presence of 5 wt% Cu, crystallite size, lattice strain, and the volume fraction of grain boundaries of B2-NiTiCu after 600 min of milling were about 10 nm, 1.057% and 25.18%, respectively. In addition, in presence of 9 wt% Cu, these values reached 6 nm, 1.967% and 39.675, respectively. The obtained data show that by increasing the milling time from 5 min to 300 min, the crystallite size decreases mostly after 300 min and reaches a minimum at 600 min of milling time.
3.4. Fraction of Crystalline phase (Crystallinity)
For the evaluation of the fraction of crystalline phase, peak broadening is an important parameter. In this paper, full width at half maximum (FWHM) of specified peaks was utilized to determine the fraction of crystalline phase. Table 3 presents the FWHM values at different Bragg angles for all the samples where the anisotropy is most pronounced. Examination of the FWHM values for all the samples revealed the occurrence of anisotropic line broadening. In general, the anisotropic line broadening may be ascribed to the three factors: the presence of stacking faults, the presence of dislocations and nonequivalence of the grain sizes along different crystallographic directions [14]. In our case, it seems that this phenomenon is due to the grain size anisotropy.
Figure 6 shows the fraction of crystalline phase as a function of production conditions. According to this figure, by increasing milling time to 600 min, the fraction of crystalline phase decreased for both compositions. However, the decreasing rate of the composition with 9 wt% Cu was higher than the composition with 5 wt%. This result is in agreement with values of crystallite size and lattice strain owing to crystallinity is principally influenced by these two main structural factors.
Isolines plots of the milled samples are presented in Figure 7. This view displays the overlapping range of all scan data in an isolines (contour lines) plot. Isolines view is typically used to display multiple scans as stemming from a non-ambient experiment or a stress measurement. In this paper, this method was also used for evaluation of the fraction of crystalline phase. At early stage of MA, overlapping range of all scan data was very low. This result confirms the high degree of crystallinity of the initial mixture. In contrast, after 300 and 600 min of milling for both compositions, overlapping range of all scan data was very high particularly in the range of 2θ ≥ 30˚. This effect is attributed to the formation of the low crystalline structure. These results are in agreement with the gained data from the Landi equation (Equation 8).
Consequently, the obtained data revealed that the mechanical alloying process is an appropriate method for production of nanocrystalline NiTiCu alloys with different structural features.
4. Conclusion
Structural features of the nanocrystalline Ni(50−X)Ti50CuX (X = 5, 9 wt%) alloys were investigated. After 600 min of milling all the peaks corresponding to the starting materials were disappeared and only characteristic peaks of

Figure 6. Fraction of crystalline phase of the samples.

Figure 7. Isolines plots of the milled samples.

Table 3. FWHM values at different Bragg angles for all the samples.
B2-NiTiCu were detectable. Displacement of Ni peaks towards lower angles was observed after mechanical activation which revealed the lattice parameter of Ni enhanced with MA time due to diffusion of larger atoms of Ti and Cu into the Ni lattice. The obtained data showed that by increasing the milling time from 5 min to 600 min, the crystallite size decreased mostly after 300 min and reached a minimum at 600 min of milling time. By increasing milling time to 600 min, the fraction of crystalline phase decreased for both compositions.
5. Acknowledgements
The authors are grateful to research affairs of Islamic Azad University, Najafabad Branch for supporting this research.
REFERENCES
- T. Mousavi, F. Karimzadeh and M. H. Abbasi, “Synthesis and Characterization of Nanocrystalline NiTi Intermetallic by Mechanical Alloying,” Materials Science and Engineering A, Vol. 487, No. 1-2, 2008, pp. 46-51. doi:10.1016/j.msea.2007.09.051
- M. Morakabati, Sh. Kheirandish, M. Aboutalebi, A. Karimi Taheri and S. M. Abbasi, “The Effect of Cu Addition on the Hot Deformation Behavior of NiTi Shape Memory Alloys,” Journal of Alloys and Compounds, Vol. 499, No. 1, 2010, pp. 57-62. doi:10.1016/j.jallcom.2010.01.124
- Q. Pan, L. Zheng, Y. Sang, Y. Li, L. Zhou and H. Zhang, “Effect of Casting Temperature on Microstructure in a Directionally Solidified Ni-44Ti-5Al-2Nb-1Mo Alloy,” Rare Metals, Vol. 30, No. 1, 2011, pp. 349-353. doi:10.1007/s12598-011-0301-x
- A. Nespoli and S. Besseghini, “A Complete Thermo-Mechanical Study of a NiTiCu Shape Memory,” Journal of Thermal Analysis and Calorimetry, Vol. 103, No. 3, 2010, pp. 821-826. doi:10.1007/s10973-010-1042-z
- S. O. Gashti, A. Shokuhfar, R. Ebrahimi-Kahrizsangi and B. Nasiri-Tabrizi, “Synthesis of Nanocrystalline Intermetallic Compounds in Ni-Ti-Al System by Mechanothermal Method,” Journal of Alloys and Compounds, Vol. 491, No. 1-2, 2010, pp. 344-348.
- doi:10.1016/j.jallcom.2009.10.169
- C. Suryanarayana, “Mechanical Alloying and Milling,” Progress in Materials Science, Vol. 46, No. 1-2, 2001, pp. 1-184. doi:10.1016/S0079-6425(99)00010-9
- C. L. De Castro and B. S. Mitchell, “Synthesis Functionalization and Surface Treatment of Nanoparticles,” In: M. I. Baraton, Ed., Nano-Particles from Mechanical Attrition, American Scientific Publishers, Stevenson Ranch, 2002, pp. 1-14.
- M. Ghadimi, A. Shokuhfar, A. Zolriasatein and H. R. Rostami, “Morphological and Structural Evaluation of Nanocrystalline NiTiCu Shape Memory Alloy Prepared via Mechanical Alloying and Annealing,” Materials Letters, Vol. 90, 2013, pp. 30-33. doi:10.1016/j.matlet.2012.09.008
- B. S. Murty, S. Ranganathan and M. Mohan, “Solid State Amorphization in Binary Ti-Ni, Ti-Cu and Ternary Ti-NiCu System by Mechanical Alloying,” Materials Sience and Engineering A, Vol. 149, No. 2, 1992, pp. 231-240. doi:10.1016/0921-5093(92)90384-D
- B. Nasiri-Tabrizi and A. Fahami, “Synthesis and Characterization of Fluorapatite-Zirconia Composite Nanopowders,” Ceramics International, Vol. 39, No. 4, 2013, pp. 4329-4337.
- F. Sun and F. H. S. Froes, “Synthesis and Characterization of Mechanical-Alloyed Ti-xMg Alloys,” Journal of Alloys and Compounds, Vol. 340, No. 1-2, 2002, pp. 220- 225. doi:10.1016/S0925-8388(01)02027-8
- Z. Wei, T. Xia, J. Ma, W. Feng, J. Dai, Q. Wang and P. Yan, “Investigation of the Lattice Expansion for Ni Nanoparticles,” Materials Characterization, Vol. 58, No. 10, 2007, pp. 1019-1024. doi:10.1016/j.matchar.2006.08.004
- E. Landi, A. Tampieri, G. Celotti and S. Sprio, “Densification Behavior and Mechanisms of Synthetic Hydroxyapatites,” Journal of the European Ceramic Society, Vol. 20, No. 14-15, 2000, pp. 2377-2387. doi:10.1016/S0955-2219(00)00154-0
- I. N. Leontyev, V. E. Guterman, E. B. Pakhomova, P. E. Timoshenko, A. V. Guterman, I. N. Zakharchenko, G. P. Petin and B. Dkhil, “XRD and Electrochemical Investigation of Particle Size Effects in Platinum-Cobalt Cathode Electrocatalysts for Oxygen Reduction,” Journal of Alloys and Compounds, Vol. 500, No. 2, 2010, pp. 241-246. doi:10.1016/j.jallcom.2010.04.018.
NOTES
*Corresponding author.