Open Journal of Nephrology
Vol.4 No.1(2014), Article ID:43547,7 pages DOI:10.4236/ojneph.2014.41001
Effect of On-Line Hemodiafiltration on Dry Weight Adjustment in Intradialytic Hypotension-Prone Patients: Comparative Study of Conventional Hemodialysis and On-Line Hemodiafiltration
Sun Woo Kang*
Department of Nephrology, College of Medicine, Inje University, Busan, Korea
Email: *kswnephrology@hotmail.com
Copyright © 2014 by author and Scientific Research Publishing Inc.
This work is licensed under the Creative Commons Attribution International License (CC BY).
http://creativecommons.org/licenses/by/4.0/


Received 27 December 2013; revised 26 January 2014; accepted 25 February 2014
ABSTRACT
Introduction: Correct adjustment of dry weight after hemodialysis (HD) with no signs of hypervolemia is important. Intradialytic hypotension (IDH) is the most common complication during HD. IDH occurs in 15% to 30% and possibly in up to 50% of dialysis sessions. IDH augments mortality essentially due to chronic overhydration and the inability to reach the proper dry weight. On-line hemodiafiltration (ol-HDF) has been reported to reduce the frequency of IDH. The aim of this study was to assess the effect of ol-HDF on hemodynamic stability and dry weight adjustment compared with low-flux HD. Methods: IDH-prone HD patients at our center were enrolled. This study was designed as a crossover trial with two phases (A arm: low-flux HD for 8 weeks followed by ol-HDF for 8 weeks vs. B arm: ol-HDF for 8 weeks followed by low-flux HD for 8 weeks) and two treatment arms (ol-HDF vs. low-flux HD), each phase lasting 8 weeks. We measured the proportion of body water using a body composition monitor (BCM). Results: In a comparison of the systolic blood pressure (SBP) and diastolic blood pressure (DBP) reductions from the baseline blood pressure between the HD and ol-HDF groups, statistically significant differences were observed only in the SBP of the B arm (SBP: HD vs. HDF, −9.83 ± 6.64 vs. −4.62 ± 1.61 mmHg, p = 0.036; DBP: HD vs. HDF, −3.29 ± 4.05 vs. −1.86 ± 1.49 mmHg, p = 0.261). Neither the mean of the interdialytic body weight gains nor the frequency of IDH was different between the A and B arms (p = 0.817 and p = 0.562, respectively). In terms of dialysis modality, there were no significant differences in the amount of overhydration between the conventional HD and ol-HDF groups during the two study phases, as measured by the BCM (A arm: p = 0.875, B arm: p = 0.655). Conclusion: Our study did not show a better benefit of ol-HDF to reach the dry weight compared with low-flux HD in IDHprone patients.
Keywords:On-Line Hemodiafiltration; Hemodialysis; Intradialytic Hypotension; Body Composition Monitor; Dry Body Weight

1. Introduction
For hemodialysis (HD) patients, both hypervolemia and hypovolemia are associated with adverse outcomes and increased mortality. Several studies have shown that strict adjustment of dry weight after HD is associated with better outcomes and survival [1] [2] , but others have shown increased morbidity and hospitalization [3] [4] . Hypervolemia may lead to pulmonary edema, uncontrolled hypertension, left ventricular hypertrophy, congestive heart failure, and even mortality. The recurrence of intradialytic hypotension (IDH) is the most common acute complication during conventional HD treatment and is a leading problem, especially in the elderly and patients with a compromised cardiovascular status. Because IDH may lead to chronic overhydration (OH) and fluctuations in volume status, IDH in HD patients is known to be associated with increased mortality [1] [2] . For physicians attempting to achieve a lean body weight in HD patients, IDH often impedes strict control.
Hemodiafiltration was first introduced in 1975, and it combined diffusion and convection to provide a wide range of solute removal according to the molecular weights of the solutes. Many observational studies have shown benefits of hemodiafiltration in terms of survival and other clinical parameters [5] -[8] . Other than efficacy, on-line hemodiafiltration (ol-HDF) has a beneficial effect on cardiovascular stability, reducing the frequency of IDH [9] .
For proper control of the volume status of HD patients without IDH or hypervolemia events, assessment of the actual body fluid composition is thought to be essential. There are several noninvasive methods with which to assess the volume status. One such method is the recently introduced body composition monitor (BCM). Measurement using the BCM is a noninvasive, simple, and highly reproducible method for assessing excess body fluid.
The aim of our study was to establish the usefulness of ol-HDF for subtle adjustment of dry weight, which was conducted by using BCM measurement to estimate the exact volume status of IDH-prone patients.
2. Methods
2.1. Patients
We conducted a prospective, two-period, two-treatment, randomized, crossover trial at one outpatient HD center between April 2011 and December 2011. All patients signed written informed consent prior to randomization, and the study protocol was approved by the Institutional Review Board For Human Research of Inje University Busan Paik Hospital.
All patients on HD older than 20 years were screened for eligibility for the study. IDH was defined as a reduction in systolic blood pressure (SBP) by >20 mmHg or an SBP of <90 mmHg during dialysis treatment. Patients who experienced more than three episodes of IDH per month during the previous 3 months were considered IDH-prone patients and were eligible for registration. Exclusion criteria were cardiac or liver failure, active bleeding, peripheral vessel disease, deep venous thrombosis, a poorly functioning fistula, or a life expectancy <6 months due to non-renal disease. All patients were randomly assigned to either the A or B arm (Figure 1). Patients in the A arm underwent low-flux HD for 8 weeks followed by ol-HDF for 8 weeks, and patients in the B arm underwent ol-HDF for 8 weeks followed by low-flux HD for 8 weeks. There were no changes in dialysis prescriptions (flow rates, dialysate temperatures, dialysate composition, or anticoagulation) or patient position during the study period. The presence of associations between IDH and adverse symptoms during HD was determined by the investigator.
2.2. Baseline Data Collection
Age, gender, height, type of vascular access, type of dialysis, dialysis duration, and frequency of dialysis data
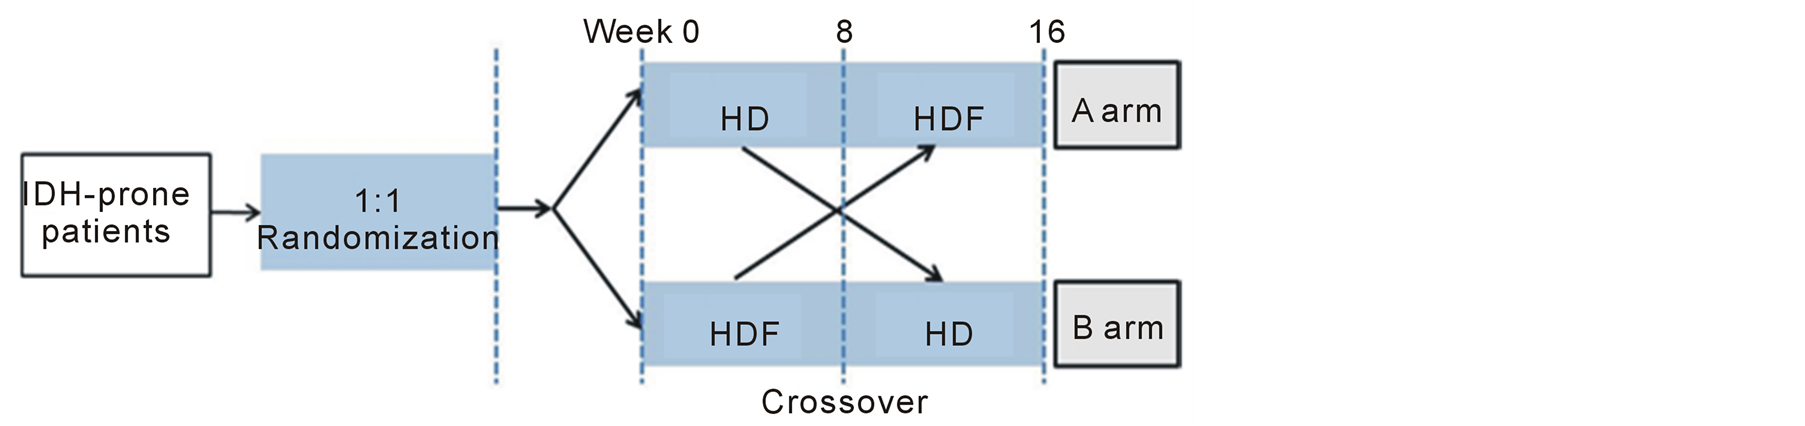
Figure 1. Crossover study design.
for each patient were recorded. For each dialysis session, the following patient data were collected: intradialytic symptoms (cramps, nausea, dizziness, headache, sweating, vomiting, etc.), IDH events, intradialytic weight loss, ultrafiltration volume, and postdialysis individual Kt/V. Blood pressure and heart rate during dialysis were measured every 30 min. Clinical parameters for volume overload such as dyspnea, pulmonary edema, and peripheral edema before dialysis were also observed. Predialysis and postdialysis body weights were recorded at each visit. Chest X-ray and biochemical parameters comprising serum BUN, creatinine, albumin, electrolytes, β2-microglobulin, and NT-proBNP level were measured at baseline.
2.3. Low-Flux HD and ol-HDF
The dialysis console used was the Fresenius 5008S (Fresenius Medical Care, Bad Homburg, Germany). The filters used were high-flux HF80S for HDF and low-flux F6HPS for HD (Fresenius Medical Care). The treatment modality was blinded to the patients by use of filter types unknown to the patients and not ordinarily used in the department. The tubing was mounted as in HDF in all sessions, and the indicators showing the treatment modality on the console were covered. All sessions in the study were 4 h in duration. The dialysate and infusate (substitution fluid) had an identical composition (mmol/L): sodium concentration close to patients’ usual serum sodium concentration at the start of dialysis (138 ± 2); potassium, 2; chloride, 106; bicarbonate, 36; acetate, 3; magnesium, 0.5; glucose, 6; and calcium ion, 1.25. The ultrafiltration rate and sodium concentration were fixed during each session. The infusate was prepared online by the dialysis machine. The patients were instructed to achieve a predialysis weight close to 3% more than their usual end-of-dialysis weight (EDW) by fluid intake adjustments. The EDW was defined as the lowest weight a patient could tolerate without the development of hypotension or such suggestive symptoms as dizziness, faintness, nausea, or cramps. The ultrafiltration volume per study session was adjusted to reach the defined EDW. The effective dialyzer blood flow was individually adjusted to [1.3 ´ EDW (kg)] ´ (1000/270 mL/min) in all sessions with a maximum of 300 mL/min. The final substitution fluid volume was (mean ± SD) 1.20 ± 0.1 L/kg body weight/session (total volume, 67 ± 7 L/session). The infusate flow rate in the HDF sessions was equal to the dialyser blood flow rate. The dialysate flow was set to 500 mL/min on the console. The patients were not allowed to eat, drink, or sleep during the study sessions. All medications were continued and administered as usual throughout the study.
2.4. BCM Measurement
The body composition and fluid status were measured 30 min after dialysis using a portable whole-body multifrequency BIA device (Body Composition Monitor – BCM®; Fresenius Medical Care). The BCM measures the impedance spectroscopy at 50 frequencies. Every mid-week day (Wednesday for a Monday-Wednesday-Friday schedule and Thursday for a Tuesday-Thursday-Saturday schedule), BCM measurement was performed 30 min after dialysis was finished. Based on the measurement of body resistance and reactance to an electrical current using the BCM monitor, the extracellular, intracellular, and total body water were determined using the approach described by Moissl et al. [10] .
2.5. Primary Endpoint
The primary endpoint of this study was comparison of the OH status after dialysis between patients undergoing ol-HDF and low-flux HD. OH in liters was estimated with the BCM; OH of ≥1.1 L after dialysis was considered overhydrated, and OH of <−1.1 L was considered dehydrated [11] [12] .
2.6. Secondary Endpoint
The secondary endpoint was comparison of the mean systolic blood pressure (SBP) and diastolic blood pressure (DBP) between patients undergoing the different dialysis modalities and other parameters representing fluctuations in fluid volume during the dialysis session.
2.7. Statistical Analysis
A descriptive analysis was carried out for variables identified for baseline characteristics. The statistical analysis for comparison of parameters within the low-flux HD or ol-HDF session in each arm was performed using the Wilcoxon signed-rank test. Comparison of parameters within the A and B arms was performed using the Mann– Whitney U test. All variables are reported as means ± standard deviation (SD). All analyses were performed on an intention-to-treat basis, and a p value of <0.05 was considered to indicate statistical significance. All statistical analyses were performed using the SPSS software (version 15.0.0; SPSS Inc., Chicago, IL, USA).
3. Results
A total of 20 patients were enrolled, and 19 patients completed the study. Table 1 summarizes the baseline characteristics of the patient groups, and there were no statistically significant differences. Of the 20 patients who enrolled the study, 12 were allocated to the A arm and 8 were allocated to the B arm. A female patient of A arm did not complete the study because she died of a sudden cardiac death. The mean age of the study group was 54.47 ± 16.03 years. The patients comprised 4 (20%) male and 16 (80%) female patients. The mean baseline BMI was 23.82 ± 4.00 kg/m2, and the mean OH was 0.117 ± 1.32 L.
3.1. Systolic and Diastolic Blood Pressure
The mean difference in blood pressure during dialysis was calculated for each patient. The degrees of reduction in the SBP and DBP during dialysis from baseline blood pressure were not different between the A and B arms (SBP: A vs. B arm, –8.85 ± 9.22 vs. –4.64 ± 4.13 mmHg, p = 0.757; DBP: A vs. B arm, –7.22 ± 3.64 vs. –2.57 ± 2.47 mmHg, p = 0.316). In a comparison of the SBP and DBP reductions from baseline blood pressure between the HD and ol-HDF groups, statistically significant differences were observed only in the SBP of the B arm (SBP: HD vs. HDF, –9.83 ± 6.64 vs. –4.62 ± 1.61 mmHg, p = 0.036; DBP: HD vs. HDF, –3.29 ± 4.05 vs. –1.86 ± 1.49 mmHg, p = 0.261) and not in the A arm (SBP: HD vs. HDF, –10.32 ± 11.2 vs. –7.37 ± 8.79 mmHg, p = 0.347; DBP: HD vs. HDF, –5.54 ± 5.21 vs. –3.74 ± 3.92 mmHg, p = 0.155).
3.2. Interdialytic Body Weight Gains and Ultrafiltration Volumes
Comparison of interdialytic body weight gains (HD vs. ol-HDF, 2.52 ± 0.6 vs. 2.57 ± 0.7 kg, p = 0.754 in the A arm; HD vs. ol-HDF, 2.53 ± 0.6 vs. 2.54 ± 0.5 kg, p = 0.889 in the B arm) (Table 2) and ultrafiltration volumes (HD vs. ol-HDF, 2.85 ± 0.6 vs. 2.93 ± 0.6 kg, p = 0.530 in the A arm; HD vs. ol-HDF, 2.92 ± 0.6 vs. 3.05 ± 0.6 kg, p = 0.263 in the B arm) (Table 2) between the low-flux HD and ol-HDF groups revealed no statistically significant differences. There was no significant difference between the study arms in intradialytic BW gain (A vs. B arm, 2.55 ± 0.6 vs. 2.54 ± 0.6 kg) or ultrafiltration volume (A vs. B arm, 2.90 ± 0.6 vs. 2.99 ± 0.6 kg, p = 0.877) (Table 3).
3.3. Frequency of IDH
The difference in the mean frequency of IDH between dialysis modalities in the A and B arms was also not statistically significant (A vs. B arm, 83.3 ± 30.7 vs. 71.5 ± 18.2 events among all sessions, p = 0.562) (Table 3). The same was true in the comparison of dialysis modalities in each group (HD vs. ol-HDF, 44.6 ± 17.0 vs. 38.6 ± 17.4 events among all sessions, p = 0.272 in the A arm; 42.8 ± 16.7 vs. 28.6 ± 7.9 events among all sessions, p = 0.093 in the B arm) (Table 2).
3.4. OH Status
Patients were considered normohydrated if OH was between –1.1 and 1.1 L. If the absolute OH value increased,

Table 1. Baseline characteristics.
Table 2. Comparison of HD and on-line HDF in each arm with respect to volume status parameters.
†Mean frequency of IDH during all sessions; ‡Mean frequency of hyper/hypovolemia during all sessions.
Table 3. Comparison of the A and B arms in terms of volume status parameters.
†Mean frequency of IDH during all sessions; ‡Mean frequency of hyper/hypovolemia during all sessions.
the patients became further diverted from a normovolemic status. Thus, we decided to estimate the effect of each dialysis modality on volume control using the absolute OH value. The frequency of failure to achieve a normovolemic status, shown here as the frequency of hyper/hypovolemia, was also estimated. There was no difference in the absolute OH value assessed by BCM measurement after dialysis or the frequency of hyper/hypovolemia between study arms (absolute value of OH: A vs. B arm, 0.9 ± 0.5 vs. 1.4 ± 1.5 L, p = 0.847; frequency of hyper/hypovolemia: A vs. B arm, 5.3 ± 6.0 vs. 7.0 ± 6.5, p = 0.509) (Table 3) or between the low-flux HD and ol-HDF group in each arm (absolute value of OH: HD vs. ol-HDF, 0.9 ± 0.5 vs. 0.9 ± 0.6 L, p = 0.875 in the A arm; 1.4 ± 1.5 vs. 1.3 ± 1.4 L, p = 0.655 in the B arm; frequency of hyper/hypovolemia: HD vs. ol-HDF, 2.3 ± 2.9 vs. 3.0 ± 3.2, p = 0.107 in the A arm; 3.0 ± 3.6 vs. 4.0 ± 3.1, p = 0.197 in the B arm) (Table 2).
4. Discussion
Among the various causes of IDH, including rapid reductions in blood volume, lack of vasoconstriction, and certain cardiovascular factors, the most common is thought to be the larger amount of fluid removal compared with the total body fluid volume.
Recent trials have shown the value of BCM measurement on fluid control in dialysis patients [1] [13] [14] . The BCM provides an objective assessment of normohydration that is clinically applicable. Guiding patients toward this target of normohydration by the BCM leads to better control of dry weight in overhydrated patients and less intradialytic adverse events in HD patients.
This was a prospective randomized study, and the primary reason for designing this study was to clarify whether ol-HDF is superior to low-flux HD in reaching an accurate dry body weight as measured by the BCM. The crossover design excluded the halo effect, which may be caused by the dialysis modality sequence. For example, there is a possibility that the results would be better with the ABAB sequence than with the BABA sequence. A certain carryover effect may exist, which means that the benefits in terms of IDH prevention are prolonged in period A even beyond the end of the preceding period B. This phenomenon also occurs with dialysis techniques that differ from traditional HD, such as hemodiafiltration, which maintains a certain degree of protection with regard to hypotensive phenomena when prolonged for a certain period of time [15] . Therefore, we originally considered the crossover design. To eliminate possible confounding factors, the dialysis dose and ultrafiltration volume were matched. We decided to employ predilution-HDF and not hemofiltration alone to ensure matching of the dialysis dose. At the same time, we utilized a dose of hemofiltration during the intervention session (1.20 L/kg/session) that would have been sufficient if used as predilution hemofiltration monotherapy. Interactions between the blood components and the filter material may theoretically interfere with the hemodynamic parameters. To minimize this effect, polysulfone filter material originating from the same manufacturer was used in both treatment modalities. The predilution mode is also reportedly advantageous based on the results of a prospective multicenter randomized study performed by Locatelli et al. [9] , which showed a lower frequency of IDH in the predilution HF and predilution HDF groups than in the low-flux HD group.
Our study did not demonstrate a superior effect of ol-HDF over low-flux HD in controlling the volume status of IDH-prone patients in terms of the absolute OH value. It did, however, elucidate the degree of deviation from normovolemia and the frequency of failure to achieve normovolemia. This could be explained by the poor difference in the frequency of IDH and interdialytic body weight gains between the low-flux HD and ol-HDF groups. None of the parameters concerning the volume status of each group of patients was significantly different. Individuals at high risk for IDH should be kept within a safe range of the dialysis ultrafiltration rate (interdialytic weight gains of ≤3% of EDW). As a matter of fact, the mean interdialytic weight gains of our patients exceeded >4.5% of EDW. Despite advances in the understanding of the pathogenesis of IDH and technologic improvements in reducing the frequency of IDH, other factors influencing excessive intradialytic weight gains cannot always be overcome. As such, additional attention is required to improve patient compliance with dietary sodium restriction. Thus, the focus on these negative results was that our IDH-prone patients were intolerable to sodium and fluid restriction in spite of the strict diet education. We first intended to recruit 30 or more patients into the study, but only 20 patients were included. This small number of enrolled patients could be another limitation of our study.
5. Conclusion
We hypothesized that because of the superior hemodynamic stability of ol-HDF over low-flux HD, ol-HDF allows for easier control of the dry body weight of IDH-prone dialysis patients. However, our study did not show a better benefit of ol-HDF to reach the dry weight compared with low-flux HD in IDH-prone patients. A largescale study would be necessary to prove its benefit in managing the volume status of IDH-prone dialysis patients.
Acknowledgements
This work was supported by a grant from the Inje University in 2010.
Declaration of Interest
The authors report no conflict of interest. The authors alone are responsible for the content and writing of the paper.
References
- Chamney, P.W., Krämer, M., Rode, C., Kleinekofort, W. and Wizemann, V. (2002) A New Technique for Establishing Dry Weight in Hemodialysis Patients via Whole Body Bioimpedance. Kidney International, 61, 2250-2258. http://dx.doi.org/10.1046/j.1523-1755.2002.00377.x
- Ozkahya, M., Ok, E., Toz, H., et al. (2006) Long-Term Survival Rates in Haemodialysis Patients Treated with Strict Volume Control. Nephrology Dialysis Transplantation, 21, 3506-3513. http://dx.doi.org/10.1093/ndt/gfl487
- Reddan, D.N., Szczech, L.A., Hasselblad, V., et al. (2005) Intradialytic Blood Volume Monitoring in Ambulatory Hemodialysis Patients: A Randomized Trial. Journal of the American Society of Nephrology, 16, 2162-2169. http://dx.doi.org/10.1681/ASN.2004121053
- Agarwal, R., Alborzi, P., Satyan, S. and Light, R.P. (2009) Dry-Weight Reduction in Hypertensive Hemodialysis Patients (DRIP) A Randomized, Controlled Trial. Hypertension, 53, 500-507. http://dx.doi.org/10.1161/HYPERTENSIONAHA.108.125674
- Jirka, T., Cesare, S., Di Benedetto, A., et al. (2006) Mortality Risk for Patients Receiving Hemodiafiltration versus Hemodialysis. Kidney International, 70, 1524-1524. http://dx.doi.org/10.1038/sj.ki.5001759
- Canaud, B., Bragg-Gresham, J., Marshall, M., et al. (2006) Mortality Risk for Patients Receiving Hemodiafiltration versus Hemodialysis: European Results from the DOPPS. Kidney International, 69, 2087-2093. http://dx.doi.org/10.1038/sj.ki.5000447
- Panichi, V., Rizza, G.M., Paoletti, S., et al. (2008) Chronic Inflammation and Mortality in Haemodialysis: Effect of Different Renal Replacement Therapies. Results from the RISCAVID Study. Nephrology Dialysis Transplantation, 23, 2337-2343. http://dx.doi.org/10.1093/ndt/gfm951
- Vilar, E., Fry, A.C., Wellsted, D., Tattersall, J.E., Greenwood, R.N. and Farrington, K. (2009) Long-Term Outcomes in Online Hemodiafiltration and High-Flux Hemodialysis: A Comparative Analysis. Clinical Journal of the American Society of Nephrology, 4, 1944-1953. http://dx.doi.org/10.2215/CJN.05560809
- Locatelli, F., Altieri, P., Andrulli, S., et al. (2010) Hemofiltration and Hemodiafiltration Reduce Intradialytic Hypotension in ESRD. Journal of the American Society of Nephrology, 21, 1798-1807. http://dx.doi.org/10.1681/ASN.2010030280
- Moissl, U.M., Wabel, P., Chamney, P.W., et al. (2006) Body Fluid Volume Determination via Body Composition Spectroscopy in Health and Disease. Physiological Measurement, 27, 921. http://dx.doi.org/10.1088/0967-3334/27/9/012
- Wabel, P., Moissl, U., Chamney, P., et al. (2008) Towards Improved Cardiovascular Management: The Necessity of Combining Blood Pressure and Fluid Overload. Nephrology Dialysis Transplantation, 23, 2965-2971. http://dx.doi.org/10.1093/ndt/gfn228
- Van Biesen, W., Williams, J.D., Covic, A.C., et al. (2011) Fluid Status in Peritoneal Dialysis Patients: The European Body Composition Monitoring (EuroBCM) Study Cohort. PLoS One, 6, Article ID: e17148. http://dx.doi.org/10.1371/journal.pone.0017148
- Machek, P., Jirka, T., Moissl, U., Chamney, P. and Wabel, P. (2010) Guided Optimization of Fluid Status in Haemodialysis Patients. Nephrology Dialysis Transplantation, 25, 538-544. http://dx.doi.org/10.1093/ndt/gfp487
- Onofriescu, M., Mardare, N.G., Segall, L., et al. (2012) Randomized Trial of Bioelectrical Impedance Analysis versus Clinical Criteria for Guiding Ultrafiltration in Hemodialysis Patients: Effects on Blood Pressure, Hydration Status, and Arterial Stiffness. International Urology and Nephrology, 44, 583-591. http://dx.doi.org/10.1007/s11255-011-0022-y
NOTES

*Corresponding author.