Open Journal of Organic Polymer Materials
Vol. 3 No. 3 (2013) , Article ID: 34325 , 9 pages DOI:10.4236/ojopm.2013.33010
Experimental and Computational Study of the Effect of Temperature on the Electro-Polymerization Process of Thiophene
1Lab. Electroquímica de Polímeros, Departamento de Química Inorgánica, Facultad de Química, Pontificia Universidad Católica Chile, Av. Vicuña Mackenna, Santiago, Chile
2Nanobiotechnology Division at University of Talca, Fraunhofer Chile Research Foundation - Center for Systems Biotechnology, FCR-CSB, Talca, Chile
3FEG, FaMAF, Universidad Nacional de Córdoba, Córdoba, Argentina
4Department of Theoretical Chemistry, Ulm University, UIm, Germany
Email: mbcamara@uc.cl, maromer1@uc.cl, ceciliagim@gmail.com, wolfgang.schmickler@uni-ulm.de, *mdvalle@uc.cl
Copyright © 2013 María Belén Camarada et al. This is an open access article distributed under the Creative Commons Attribution License, which permits unrestricted use, distribution, and reproduction in any medium, provided the original work is properly cited.
Received March 20, 2013; revised April 18, 2013; accepted May 2, 2013
Keywords: Kinetic Monte Carlo; Conducting Polymers; Thiophene; Electro-Polymerization; Nucleation and Growth Mechanism
ABSTRACT
Temperature effect on the nucleation and growth mechanisms (NGM) of poly(thiophene) (PTh) was investigated through experimental and computational tools. The computational simulation method was based on a kinetic Monte Carlo algorithm. It reproduced key processes such as diffusion, oligomerization, and the precipitation of oligomers onto the electrode surface. Electrochemical synthesis conditions at temperatures between 263 and 303 K were optimized. The deconvolution of the i-t transients reflected two contributions: a progressive nucleation with three-dimensional growth controlled by diffusion and the other by charge transfer, PN3Ddif and PN3Dct, respectively. As temperature decreased, a diminution of the charge associated to each contribution was observed and the nucleation induction time increased. Experimental and computational evidence indicated that temperature does not change the nucleation and growth mechanism (NGM). This effect was ascribed to kinetic factors rather than to film conductivity. This work contrasts simulation and experimental evidence and demonstrates how computational simulations can help to understand the electrochemical process of conducting polymers formation.
1. Introduction
Conducting polymers are promising materials for innovative technological applications in research topics like electronic and optoelectronic science. They have been successfully implemented in light emitting diodes (LED’s), solar cells, transistors, nanoswitches, imaging materials and chemical sensors [1].
The electrochemical synthesis of conducting polymers, also known as electro-polymerization, is a very complex process where many factors are involved. During the last decades, the electrochemical synthesis of conducting polymers on metallic substrates has been thoroughly studied, however, the formation mechanism of this process is not completely clear.
The proposed model for the electro-deposition of conducting polymers [2-4] establishes that the nucleation process and subsequent growth on the electrode surface depends on the degree of saturation of the high density oligomeric region, HDOR, i.e. is determined by the solubility of the oligomers present at the electrode-solution interface. Thus, when oligomers reach a critical chain length they become insoluble, precipitate on the electrode surface and originate nuclei that cause polymer film growth.
Electro-polymerization depends of different experimental factors such as the chemical nature and concentration of monomer and electrolyte, the solvent, the physical and chemical nature of the electrode substrate, and the conditions of the electrical perturbation applied to the interface [4]. Among literature, it is possible to find some studies about the effect of experimental factors on the nucleation and growth mechanism (NGM), but only a few of them point to a systematic study regarding temperature effect on the NGM during the electro-synthesis of polymer films on metal substrates [3].
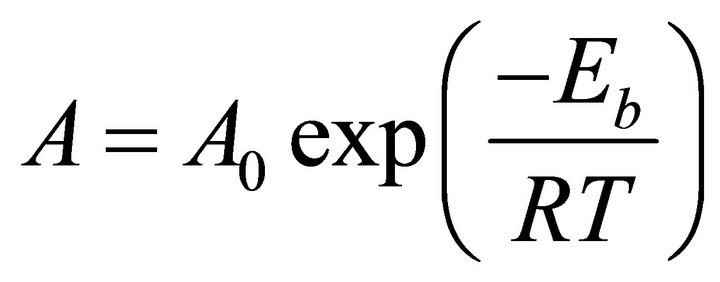
According to experimental evidence reported by Mostany and coworkers [5], a temperature increment during the electro-crystallization process, will not produce any modification in the nucleation and growth mechanism of the metal. This can be explained by the Arrhenius equation:
 (1)
(1)
where A and A0 are kinetic factors and Eb is the required energy to overcome the energetic barrier of any event, which in general is independent of the temperature. Consequently, the rate A is directly proportional to the temperature; an increase of the temperature will raise the rate of the event. Then, in a deposition process, temperature increments will not change the nature of the process; there will be only a higher probability of some events to occur.
In this work, we performed a computational and an experimental study of the electro-polymerization of poly (thiophene) (PTh), in order to identify the temperature effect on its electrochemical synthesis. The computational simulation method was based on a kinetic Monte Carlo algorithm [6] and reproduced key processes such as diffusion, oligomerization, and the precipitation of oligomers onto the electrode surface. Simulation results were compared to the experimental evidence to test the model and evaluate its prediction performance. Theoretical finds had excellent agreement with the experimental results and demonstrated how computational simulations can help to understand and predict the electrochemical process of conducting polymers formation.
2. Experimental and Computational Methodology
2.1. Experimental Details
A conventional three-compartment, three-electrode cell was employed throughout this work. A polycrystalline platinum disk (0.07 cm2 geometric area) was used as working electrode. The counter electrode was a coiled Pt wire with a surface area at least ten times greater than the working electrode. It was separated from the electrolytic solution by a sintered glass. All potentials quoted in this paper are referred to the saturated calomel electrode (SCE) [7]. All reagents were provided by Aldrich. The electro-polymerization of thiophene (≥99% purity) was carried out in anhydrous acetonitrile (99.8% purity, 0.001% water) using a concentration of 0.1 mol·L−1. Tetrabutyl ammonium hexafluorophosphate (TBAPF6, 0.1 mol·L−1) dried at 110˚C and kept into a dryer was used as supporting electrolyte.
Prior to all the experiments, solutions were purged with high-purity argon during 30 min and an argon atmosphere was maintained over the solution during the measurements. The optimal electro-polymerization conditions (monomer and TBAPF6 concentration and potential scanning range) and the potential range of chronoamperometry experiments were selected by potentiodynamic methodologies (cyclic voltammetry, CV). Potentiostatic measurements were performed to study nucleation and growth process of PTh films.
The electrochemical work was conducted on a PGP100 Voltalab potenciostat/galvanostat. Data was recorded by means of a compatible computational program (Voltamaster 4). Temperature was regulated and kept constant using a thermal bath controlled by a HAAKE G thermostat-cryostat that enables an ethylene glycol-water mixture to flow through the electrochemical cell jacket. The temperatures of work selected were 263, 273, 283, 293 and 303 K.
2.2. Model and Simulation Method
As described in our first report [8], a Fortran77 code based on kinetic Monte Carlo rules, was developed to model the electro-polymerization of thiophene. Monomers were represented as spheres and the electrolyte was not included explicitly. 3D reticular model was used (Figure 1) with a total of [s·s·(h + r)] positions, each representing a cube with an edge length d.
The size of d was selected according to the crystallographic center-center distance of the rings of the thiophene dimer [9] (d = 3.89 Å). The simulation cell contains at the upper end a reservoir of monomers, labeled A

Figure 1. Schematic representation of the simulation box.
in Figure 1. During the simulation monomers were added to A as needed in order to keep a constant number of particles. The region B, the reaction zone, is delimited by region A at the top, and at the bottom by a box representing the working electrode. Periodic boundary conditions were implemented along the code in the x and y directions parallel to the electrode surface. The reservoir was placed at a distance sufficiently large so that the monomers in A do not interact with particles near the surface. Particle entrance from zone B to A was not allowed.
Based on an experimental study of thiophene [10] (Th), the critical chain length was established as three units. The simulation started with the diffusion of monomers from the reservoir to the electrode. Every movement was selected randomly, and its probability was directly proportional to the magnitude of its rate in the processes catalogue, i.e. higher rate values have greater probabilities of being selected. The time corresponding to a movement Γ was calculated from a randomly chosen number μ, selected by a code’s subroutine [11], uniformly distributed between 0 and 1 according to Equation (2):
 (2)
(2)
where R corresponds to the total sum of all rates included in the processes catalogue.
In the model proposed, when a monomer reaches the electrode or gets in contact with already deposited oligomers, is automatically labeled as a radical cation, and can diffuse inside the zone B again. This radical monomer can react with other activated monomer creating a neutral dimer. Dimers can also become radical species in the same way as monomers, and can react with cationic monomers or dimers producing neutral trimers and tetramers, respectively. In accordance to experimental evidence, which indicates that the film grows parallel to the metal surface [12], the generation of oligomeric chains with geometry parallel to the z axis was not allowed. This consideration was reflected in a lower production of trimers, tetramers, pentamers and hexamers. The formation of branched or nonlinear chains was not permitted, in order to preserve the planarity and linearity of the oligomers. Triple linkage can also occur when radicals move up or down in the z axis and find two activated oligomers lined up on the electrode surface, generating trimers, tetramers, pentamers and hexamers. When the size of the chain exceeds two units, the oligomer can still diffuse inside the zone B, however, upward movements in the z direction are not allowed to guarantee the precipitation on the electrode. When insoluble oligomers reach the bottom of the simulation box or touch already deposited oligomers they become immediately fixed and thus, dendritic growth is expected. The diffusion of precipitated species was not permitted. The concentration set in the simulation (0.01 mol·L−1) was lower than the one used at the experimental study (0.1 mol·L−1) to reduce computational cost and calculation time.
Diffusion rates calculated by Molecular Dynamic (MD) simulations through the Einstein-Stokes expression [13] have been introduced for the oligomers (1 Th - 6 Th) present in the simulation. Each oligomer has the same rate in the three axes. Table 1 resumes these values.
The temperatures of the MD diffusion coefficients are considerably distant from the temperatures of the experimental part. However, the relevant factor in this study is the effect of temperature rising and not the quantity of increment.
3. Results and Discussion
3.1. Experimental Measurements
3.1.1. Cyclic Voltammetry
Figure 2 depicts voltammetric profiles recorded during the thiophene electro-polymerization at the extreme working temperatures: 268 and 303 K, respectively. No relevant differences related to the nucleation and growth potential range (closer to anodic inversion potential) were observed at these temperatures. Thus, in both cases the growth mechanism was studied between 1720 and 1770 mV.
Voltammetric profiles recorded at the same successive scan number were similar at both temperatures. This indicates that under the same electrochemical conditions, temperature has no critical influence in the electrochemical deposition mechanism of PTh. There is only a difference between the charges involved. The current recorded is higher at higher temperature, accounting for an increased deposition rate.
3.1.2. Potentiostatic Measurements
The deposition process of PTh by a potentiostatic perturbation (fixed potential) was also study. Figure 3

Table 1. Diffusion coefficient (105·cm2·s−1) of thiophene (Th) oligomers at different concentrations and temperatures*.
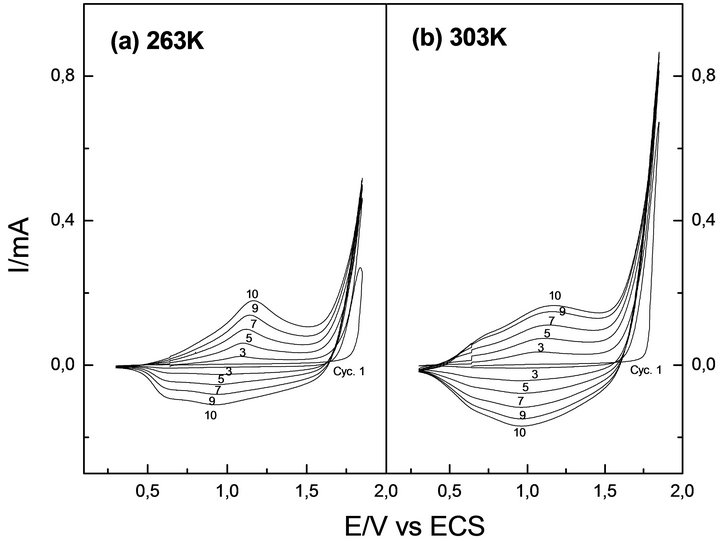
Figure 2. Potentiodynamic profiles of Th at (a) 263 and (b) 303 K. Interface: Pt| 0.1 mol·L−1 Th + 0.1 mol·L−1 TBAPF6, CH3CN. Scanning potential limits Es,c = 0.30 V and Es,a = 1.85 V.

Figure 3. Time-current transient of Th at (a) 263 and (b) 303 K. Interface: Pt| 0.1 mol·L−1 Th + 0.1 mol·L−1 TBAPF6, CH3CN.
shows the current-time (i-t) profiles at 263 and 303 K in a potential range between 1720 mV and 1770 mV. All profiles were recorded till constant current intensity.
At both temperatures the i-t transients exhibited a complex mechanism, with two clear steps: the first where PTh deposits on the bare surface of the working electrode, and a second step where a new layer of PTh layer grows on the first one. As previously reported [14], only the initial stage of the transients was considered for the analysis of the PTh deposition mechanism. This zone of the i-t profile delivers relevant information about the modification of the surface of the working electrode, first nuclei deposition and morphology development. As the working temperature increased, the second step appeared at shorter time. This fact suggests that all implicated processes come earlier.
Table 2 summarizes the induction time (τ) of the first

Table 2. Induction time (τ) of the electro-polymerization of thiophene at different temperatures. Interface: Pt| 0.1 mol·L−1 Th + 0.1 mol·L−1 TBAPF6, CH3CN.
step in the transient of PTh deposition at different temperatures from 263 to 303 K, being τ the time required to exceed oligomers saturation level at the electrode-solution interface, i.e. describes the HDOR (high density oligomer region) formation [2-4]. The values in Table 2 can be understood if a polymerization rate decrease is considered at lower temperatures, as demonstrated by the inferior polymer growth observed in Figure 2.
For lower temperatures, the rate of formation of the oligomers and thus, the HDOR, is smaller. Oligomers take longer time to reach the critical chain length and saturate the interface, and therefore, the nuclei generation occurs at longer τ values.
3.1.3. Nucleation and Growth Mechanism NGM
To study the NGM, current-time transients at different temperatures were recorded (Figure 4). In order to describe the deposition process, i.e. the nucleation and growth of PTh, τ was subtracted from all profiles (τ[0,0]). As before mentioned, the deconvolution of all transients was considered only for the first step of the profiles.
The analysis of the first step transients of Figure 4 revealed two different contributions: a progressive nucleation with growth under diffusional control (PN3Ddif), and a tridimensional progressive nucleation with growth controlled by charge transfer (PN3Dct). Equation (3) represents the global NGM:
 (3)
(3)
P1 and P2 are rate parameters of the progressive nucleation with growth under diffusional control (PN3Ddif). P3 and P4 are parameters of the tridimensional progressive nucleation with growth controlled by charge transfer (PN3Dct). The extended expression of all parameters is summarized in Table 3.
N0 is the number of the active sites on the surface, k is the rate constant of a nucleus, A is the nucleation rate constant (s−1), M is the molar mass, ρ the density of the deposited material, n is the number of transferred electrons, F the Faraday constant, k and k’ are the rate constant of the three-dimensional nuclei for growth parallel

Figure 4. Corrected current-time transients of the deposition of Pth at different temperatures. Interface: Pt| 0.1 mol·L−1 Th + 0.1 mol·L−1 TBAPF6, CH3CN. The line on the curves indicates the end of the first step of deposition of PTh.

Table 3. Expression of the parameters of the NGM: PN3Ddif + PN3Dct.
and perpendicular to the surface, D is the diffusion coefficient and C the concentration of the monomer in the bulk of the electrolytic solution.
Figure 5 shows the deconvoluted transients at 263 and 303 K. The black continuous line corresponds to the experimental measurement, while the red dotted line is the fitted curve: the sum of the two progressive contributions, the global deposition mechanism of PTh at these experimental conditions.
At all the temperatures employed in this study, the NGM is exactly the same as Figure 6 shows. Temperature does not affect NGM of PTh deposition. It accelerates or delays the development of each contribution to the mechanism and therefore, modifies the rate constant of the processes.
The time at each contribution appears is affected, which is directly related to the quantity and quality of the films. This fact is reflected in the values of the fitting parameters of the two contributions (Equation (3)), resumed in Table 4.
Parameters P1, P2 and P4 increased as temperature was raised. This indicates that the rates related to this process were higher producing an earlier definition of the contributions. Unlike the rest of the parameters, P3 presented

Figure 5. Time-current transient deconvolution at (a) 263 K and (b) 303 K. Interface: Pt| 0.1 mol·L−1 Th + 0.1 mol·L−1 TBAPF6, CH3CN.

Figure 6. Effect of the temperature on each mechanism contribution (a) PN3Dct and (b) PN3Ddif. Interface: Pt| 0.1 mol·L−1 Th + 0.1 mol·L−1 TBAPF6, CH3CN.
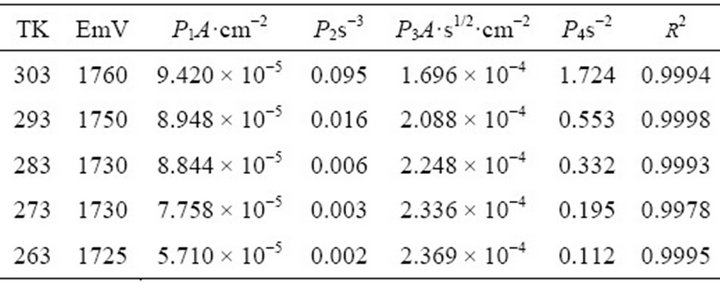
Table 4. Effect of the temperature in the parameters of Eq. 3 (NGM of PTh). Interface: Pt| 0.1 mol·L−1 Th + 0.1 mol·L−1 TBAPF6 , CH3CN.
lower values at higher temperatures. As previously showed in Table 4, this parameter depends of k’, the rate constant of perpendicular growth of 3D nuclei. As previously pointed, there is a second step in the profile not considered in the deconvolution of the transients where a second layer of PTh is deposited on the film surface.
As already shown in Figure 4, at lower temperatures there is a delay in the occurrence of the second step. Therefore, an increment of temperature will produce faster deposition of the second PTh layer, hindering the perpendicular growth of the first layer.
3.2. Computational Simulation
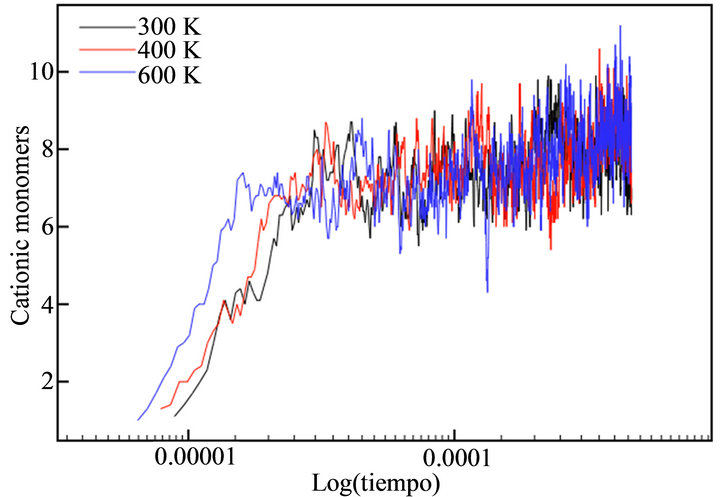
With the aim of simulating the temperature effect on the polymerization process of thiophene, a range of temperatures was selected: 300 K, 400 K and 600 K. The diffusion rates used in each case are showed in Table 1. The temperature effect was evaluated directly in the rate constants, because no thermal bath was implemented. The final simulation time (tf) in all cases was tf = 440 μs. This value corresponded to the moment the deposit at 600 K reached a height of h/4. Figure 7 depicts the evolution of cationic and insoluble oligomers during the simulation.
All profiles exhibited a similar number of cationic and neutral insoluble units along the simulation time, demonstrating that a temperature rise does not affect the growth or diffusion mechanism; there is only an acceleration of the processes, as previously described in the experimental finds.
In this sense, a plot of the induction time τ against the temperature is very useful to analyze the influence on time at the first oligomer precipitates. Figure 8 gives analogous results to the experimental evidence. Τ as the temperature grows up because all rates are greater and consequently, the probability of oligomer precipitation is superior. Induction times in the simulations are in the range 10 s, while in the experimental results τ (Table 2).
The experimental measurement of this quantity considers some factors not included in the simulation. First of all, the current registers the formation of several growing centers on the electrode unless one could detect currents in the order of nA. Additionally, τ value considers the charge of the double layer and the diffusion, represented by the Cotrell [15] equation, which has currents much superior to the processes appearing on the surface. Thus, the induction time reported by experimental measurements does not reflect the precipitation of the only and first nucleus on the electrode surface, and probably the measured induction time has a lower value.
 (a)
(a)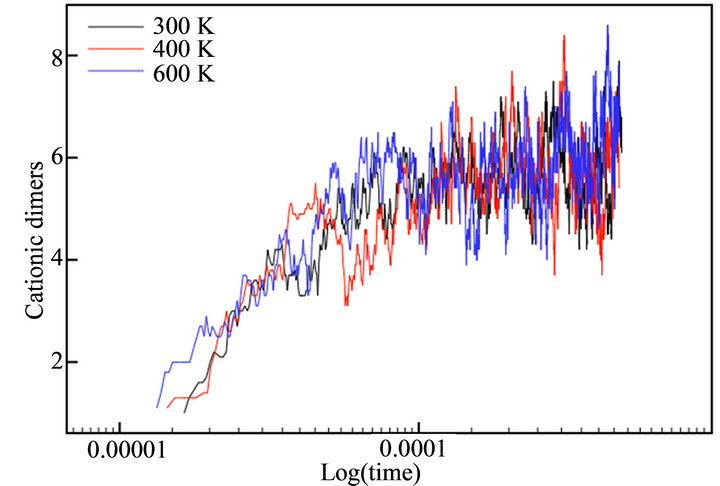 (b)
(b) (c)
(c)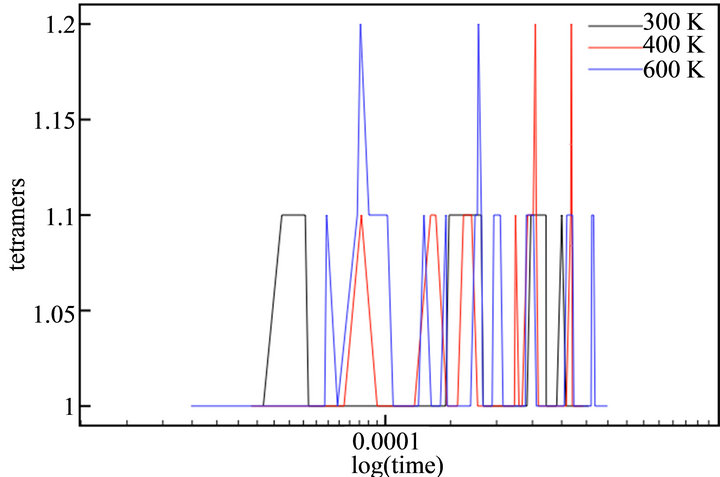 (d)
(d)
Figure 7. Number of thiophene cationic monomers (a) and dimers (b), neutral trimers (c) and tetramers (d) during the simulation time in logarithmic scale.
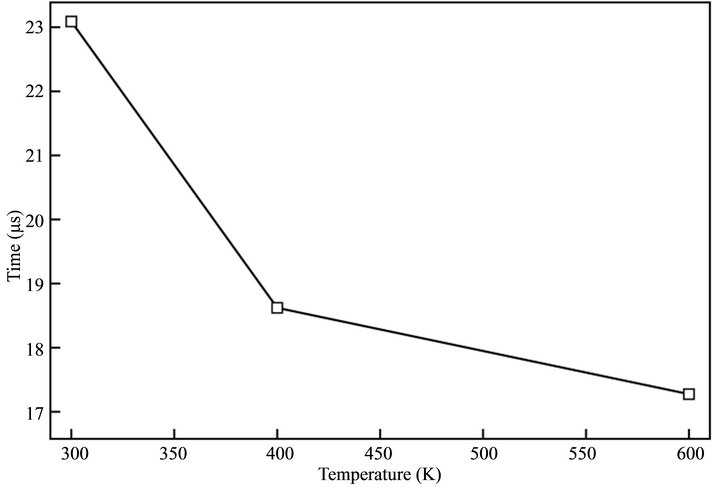
Figure 8. Time of appereance of the first mucleus on the surface of the electrode (τ) at different simulation temperatures.
On the other hand, the simulation has a size limitation. The height of zone B does not reproduce the real diffusion layer height. Then, the activation of monomers and precipitation of the first oligomer will be faster, registering lower induction times.
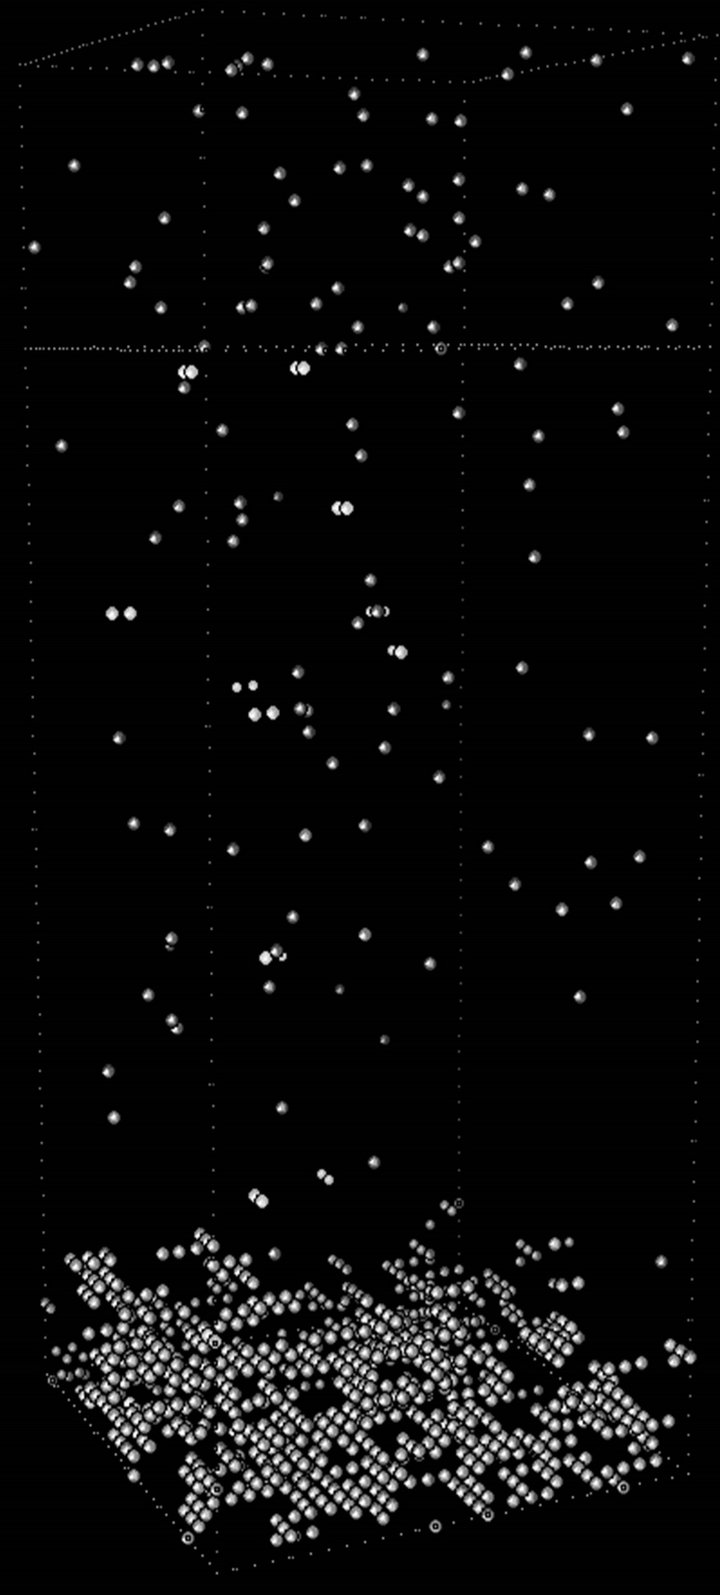
At higher temperature the deposition process is faster. Then at equivalent simulation time, films will present longer height, as Figure 9 depicts, where at 300 K, 400 K and 600 K the deposit exhibited 12, 13 and 15 unit cells, respectively. The number of deposited thiophene units increased with temperature.
Comparing the percentage of coverage degree (number of occupied sites per layer) against height (h) for all temperatures at the end of the simulations, it can be seen (Figure 10) that as the temperature grows up, the film presents less density of thiophenic units in the first layers.
At higher temperatures radicals are generated faster near the surface of the electrode or the just formed conducting polymer. The probabilities of producing longer oligomeric species with short-range diffusion are higher, giving place for a massive and less structured precipitation phenomenon. As already reported by our group3 the same effect of temperature in PTh films distribution was observed: at less temperature more compact and ordered polymeric films were synthesized, reflected in higher conductivity values.
In spite of all simplifications applied to the stochastic model, there was good agreement with the experimental observations. The introduction of accurate rates or diffusion after precipitation will improve the current model and will provide more details about the nucleation and growth mechanism of conducting polymers and the effect of experimental factors.
 300K
300K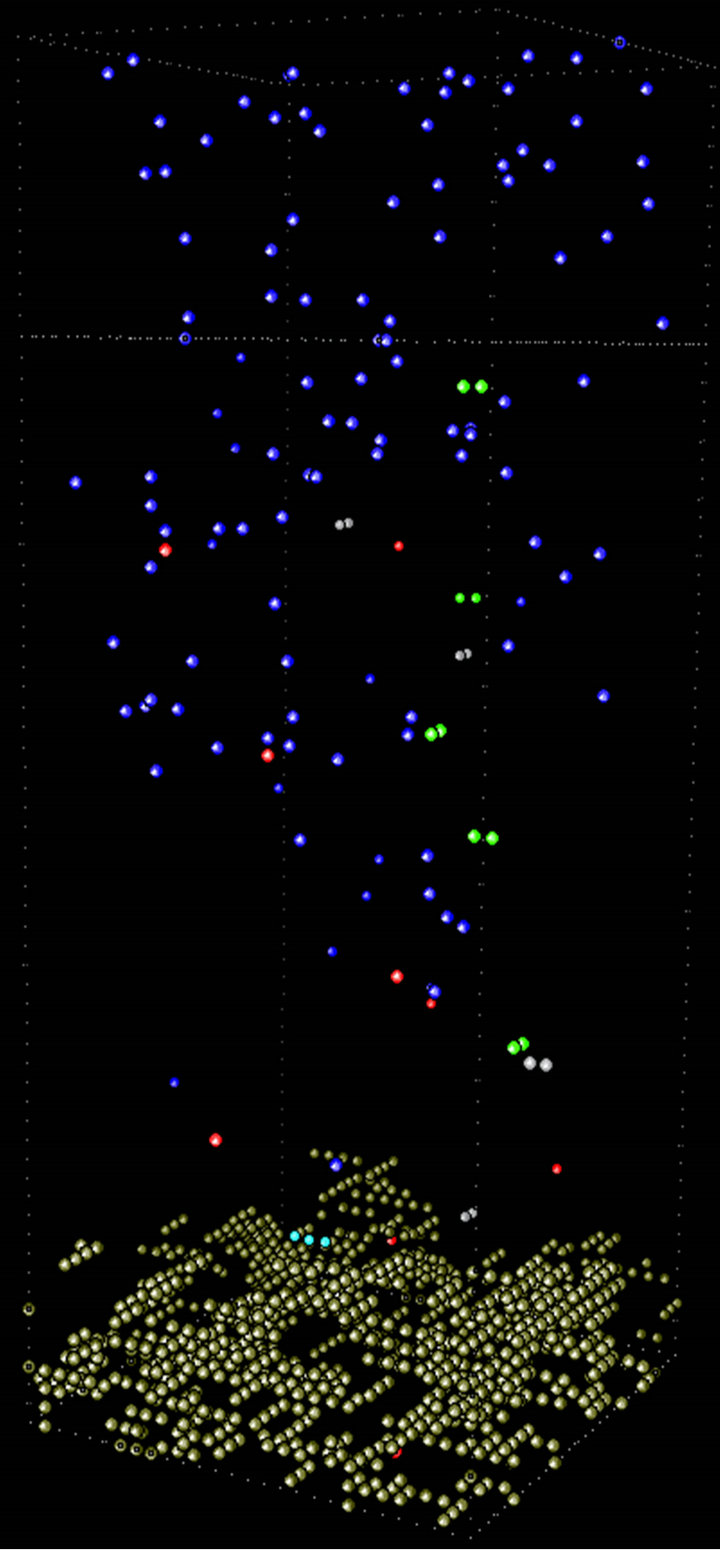 400K
400K 600K
600K
Figure 9. Snapshots of the electro-polymerization of thiophene at different temperatures visualized with the computational program ymol [16].
4. Conclusion
With the aim of studying the effect of temperature on the nucleation and growth process of the electrochemical conducting polymers synthesis, we have developed a new simulation scheme using stochastic methodologies. Like all simulation methods, our work demands a drastic simplification of the real system. Neither the solvent nor the supporting electrolyte was explicitly considered because of the size of the system. Despite all approximations the first results are quite favorable. Introduction of new considerations, like accurate diffusion coefficients or the diffusion of oligomers after precipitation, will improve the current model. New runs on other polymeric systems, other temperatures and rates will provide more details to corroborate the already proposed electro-polymerization mechanism.

Figure 10. Coverage degree at tf of each layer of the deposit at different temperatures.
5. Acknowledgements
M. R. is grateful to CONICYT for a Ph.D. fellowship (grant nº 57090050). M. B. C. acknowledges InnovaChile-CORFO (Project Code #09CEII-6991) and M. A. del V. acknowledges FONDECYT grant nº 1100055, for the financial support.
REFERENCES
- H. Chelawat, S. Vaddiraju and K. Gleason, “Conformal, Conducting Poly(3,4-ethylenedioxythiophene) Thin Films Deposited Using Bromine as the Oxidant in a Completely Dry Oxidative Chemical Vapor Deposition Process,” Chemistry of Materials, Vol. 22, No. 9, 2010, pp. 2864-2868. doi:10.1021/cm100092c
- M. A. del Valle, F. R. Díaz, M. E. Bodini, G. Alfonso, G. M. Soto and E. D. Borrego, “Electrosynthesis and Characterization of O-phenylenediamine Oligomers,” Polymer International, Vol. 54, No. 3, 2005, pp. 526-532. doi:10.1002/pi.1700
- M. Romero, M. A. del Valle, R. del Río, F. R. Díaz and F. Armijo, “Polymers Nucleation and Growth Mechanism: Solubility, a Determining Factor,” International Journal of Electrochemical Science, Vol. 7, No. 10, 2012, pp. 10132-10141.
- R. Schrebler, P. Grez, P. Cury, C. Veas, M. Merino, H. Gomez, R. Cordova and M. A. del Valle, “Nucleation and Growth Mechanisms of Poly(thiophene) Part 1. Effect of Electrolyte and Monomer Concentration in Dichloromethane,” Journal of Electroanalytical Chemistry, Vol. 430, No. 1, 2005, pp. 77-90.
- J. Mostany, B. Scharifker, K. Saavedra and C. Borrás, “Electrochemical Nucleation and the Classical Theory: Overpotential and Temperature Dependence of the Nucleation Rate,” Russian Journal of Electrochemistry, Vol. 44, No. 6, 2008, pp. 652-658. doi:10.1134/S1023193508060049
- M. B. Camarada, M. C. Giménez, W. Schmickler and M. A. del Valle, “A First Approximation to Simulate the Electro-Polymerization Process,” Journal of the Chilean Chemical Society, Vol. 57, No. 3, 2012, pp. 1267-1271. doi:10.4067/S0717-97072012000300015
- G. A. East and M. A. del Valle, “Easy-To-Make Ag/AgCl Reference Electrode,” Journal of Chemical Education, Vol. 77, No. 1, 2000, p. 97. doi:10.1021/ed077p97
- M. B. Camarada, P. Jaque, F. R. Díaz and M. A. del Valle, “Oxidation Potential of Thiophene Oligomers: Theoretical and Experimental Approach,” Journal of Polymer Science Part B: Polymer Physics, Vol. 49, No. 24, 2011, pp. 1723-1733. doi:10.1002/polb.22360
- A. Almenninger, O. Bastiansen and P. Svendas, “Electron Diffraction Studies of 2,2’-Dithienyl Vapour,” Acta Chemica Scandinavica, Vol. 12, 1958, pp. 1671-1674. doi:10.3891/acta.chem.scand.12-1671
- P. Lang, F. Chao, M. Costa and F. Garnier, “Electrochemical Grafting of Poly(methylthiophene) onto Platinum in Acetonitrile,” Polymer, Vol. 28, No. 4, 1987, pp. 668- 674. doi:10.1016/0032-3861(87)90486-1
- W. Press, S. Teukolsky, W. Vetterling and B. Flannery, “Numerical Recipes in Fortran 77, The Art of Scientific Computing,” Vol. 1, Cambridge University Press, Cambridge, 1992.
- J. Heinze, B. A. Frontana-Uribe and S. Ludwigs, “Electrochemistry of Conducting Polymers Persistent Models and New Concepts,” Chemistry Reviews, Vol. 110, No. 8, 2010, pp. 4724-4771. doi:10.1021/cr900226k
- M. B. Camarada, J. A. Olmos-Asar, M. M. Mariscal and M. A. del Valle, “Calculation of the Diffusion Coefficient of Thiophene Oligomers Using Molecular Dynamics,” Molecular Simulation, Vol. 38, No. 11, 2012, pp. 882- 885. doi:10.1080/08927022.2012.664772
- M. A. del Valle, P. Cury and R. Schrebler, “Solvent Effect on the Nucleation and Growth Mechanisms of Poly (thiophene),” Electrochimica Acta, Vol. 48, No. 4, 2002, pp. 397-405. doi:10.1016/S0013-4686(02)00685-0
- A. J. Bard and L. R. Faulkner, “Electrochemical Methods: Fundamentals and Applications,” 2nd Edition, John Wiley & Sons Inc., Hoboken, 2001.
- D. Spångberg, “ymol,” 1998.
NOTES
*Corresponding author.