Open Journal of Medicinal Chemistry
Vol.2 No.3(2012), Article ID:22907,7 pages DOI:10.4236/ojmc.2012.23006
3D-QSAR Topomer CoMFA Studies on 10 N-Substituted Acridone Derivatives
Department of Chemistry, Tennessee State University, Nashville, USA
Email: *cokoro@tnstate.edu
Received May 15, 2012; revised June 20, 2012; accepted June 30, 2012
Keywords: Acridone; Topomer; Acyclic; CoMFA; Cross-Validated; SAR
ABSTRACT
Topomer CoMFA models have been used to optimize the potency of 15 biologically active acridone derivatives selected from the literature. Their 3D chemical structures were sliced into three acyclic R groups, to produce a fragment that is present in each training set. The analysis was successful with 3 as the number of components that provided the highest q2 results: q2 is 0.56, which is the cross-validated coefficient for the specified number of components, giving rise to 0.37 standard error of estimate (q2 stderr), and a conventional coefficient (r2) of 0.82, whose standard error of estimate is 0.24. These results provide structure-activity relationship (sar) among the compounds. The result of the Topomer CoMFA studies was used to design novel derivatives for future studies.
1. Introduction
There are many biologically active fused heterocyclic rings. Acridone is one of such scaffolds known to be associated with biological activities due to the pharmacological activities of its nucleus [1]. It has a carbonyl group and nitrogen at the 9 and 10 positions, respectively. Acridones of natural and synthetic origins are known topossess a wide variety of biological activities [2], includeing inhibitory action against viruses, such as human cytomegalovirus [3-5], Epstein-Barr virus [6], adenovirus [7], and Junin virus [8]. In addition, acridone-based derivatives have been studied as anticancer agents, [9,10] which are believed to express their activity through binding of DNA [11]. Similarly, 10-N-substituted acridones, with the rigid aromatic tricyclic ring system, have been established to have potent chemo-sensitization pharmacophores [12].
Often, potency improvement is achieved by structural modification of lead candidate; one way is the systematic iterative analysis of accumulating structure-activity relationship (SAR) data. A notable QSAR methodology with global success [13] in analyzing structure-activity data [14,15] is comparative molecular field analysis (CoMFA). [16] Yet CoMFA has weaknesses. The most challenging is its input requirement that each ligand structure can be represented as a 3D model, by selecting an absolute orientation of a single conformational alignment [17]. Sometimes, the alignment can yield excellent models with superior predictive ability [18-20]. Howeveronly one method exists for validating the alignment procedure, which is the maximization of various q2 (crossvalidated r2) statistics. This averages the internal predicttive accuracy for every structure-activity observation. This difficulty is addressed by Topomer CoMFA, a completely objective and universal methodology for generating an alignment of a structural fragment [21], both a conformation and its orientation in a Cartesian space. By definition, structural fragments contain a common feature. Topomer CoMFA is a 3D-QSAR tool that automatically generates a model for predicting the biological activity or properties of compounds [22]. In this present work, Topomer CoMFA methodology has been employed to identify pharmacophoric units, and to establish the contributions of each of the identified R groups in the training sets.
Fifteen compounds were selected from the works of Cluadia et al. [8], and Jane et al. [12]. The structures of the compounds and their respective biological data are given in Tables 1 and 2, respectively. All molecular modeling calculations were done using SYBYL-X 1.3 [23] program (Tripos Associates Inc.), windows operating system version. Molecule building was done with a molecule sketch program. The molecular geometry of each compound was first minimized using a standard Tripos molecular mechanics force field with 0.05 kcal/(mol·Å) energy gradient convergence criterion. Their charges were computed by the Gasteiger-Huckel MMFF method [24-28]. Partial atomic charges were assigned to each atom before energy minimization was carried out, using Powell Method 100 iterations, and conjugate gradient method as

Table 1. Chemical structures of training sets.
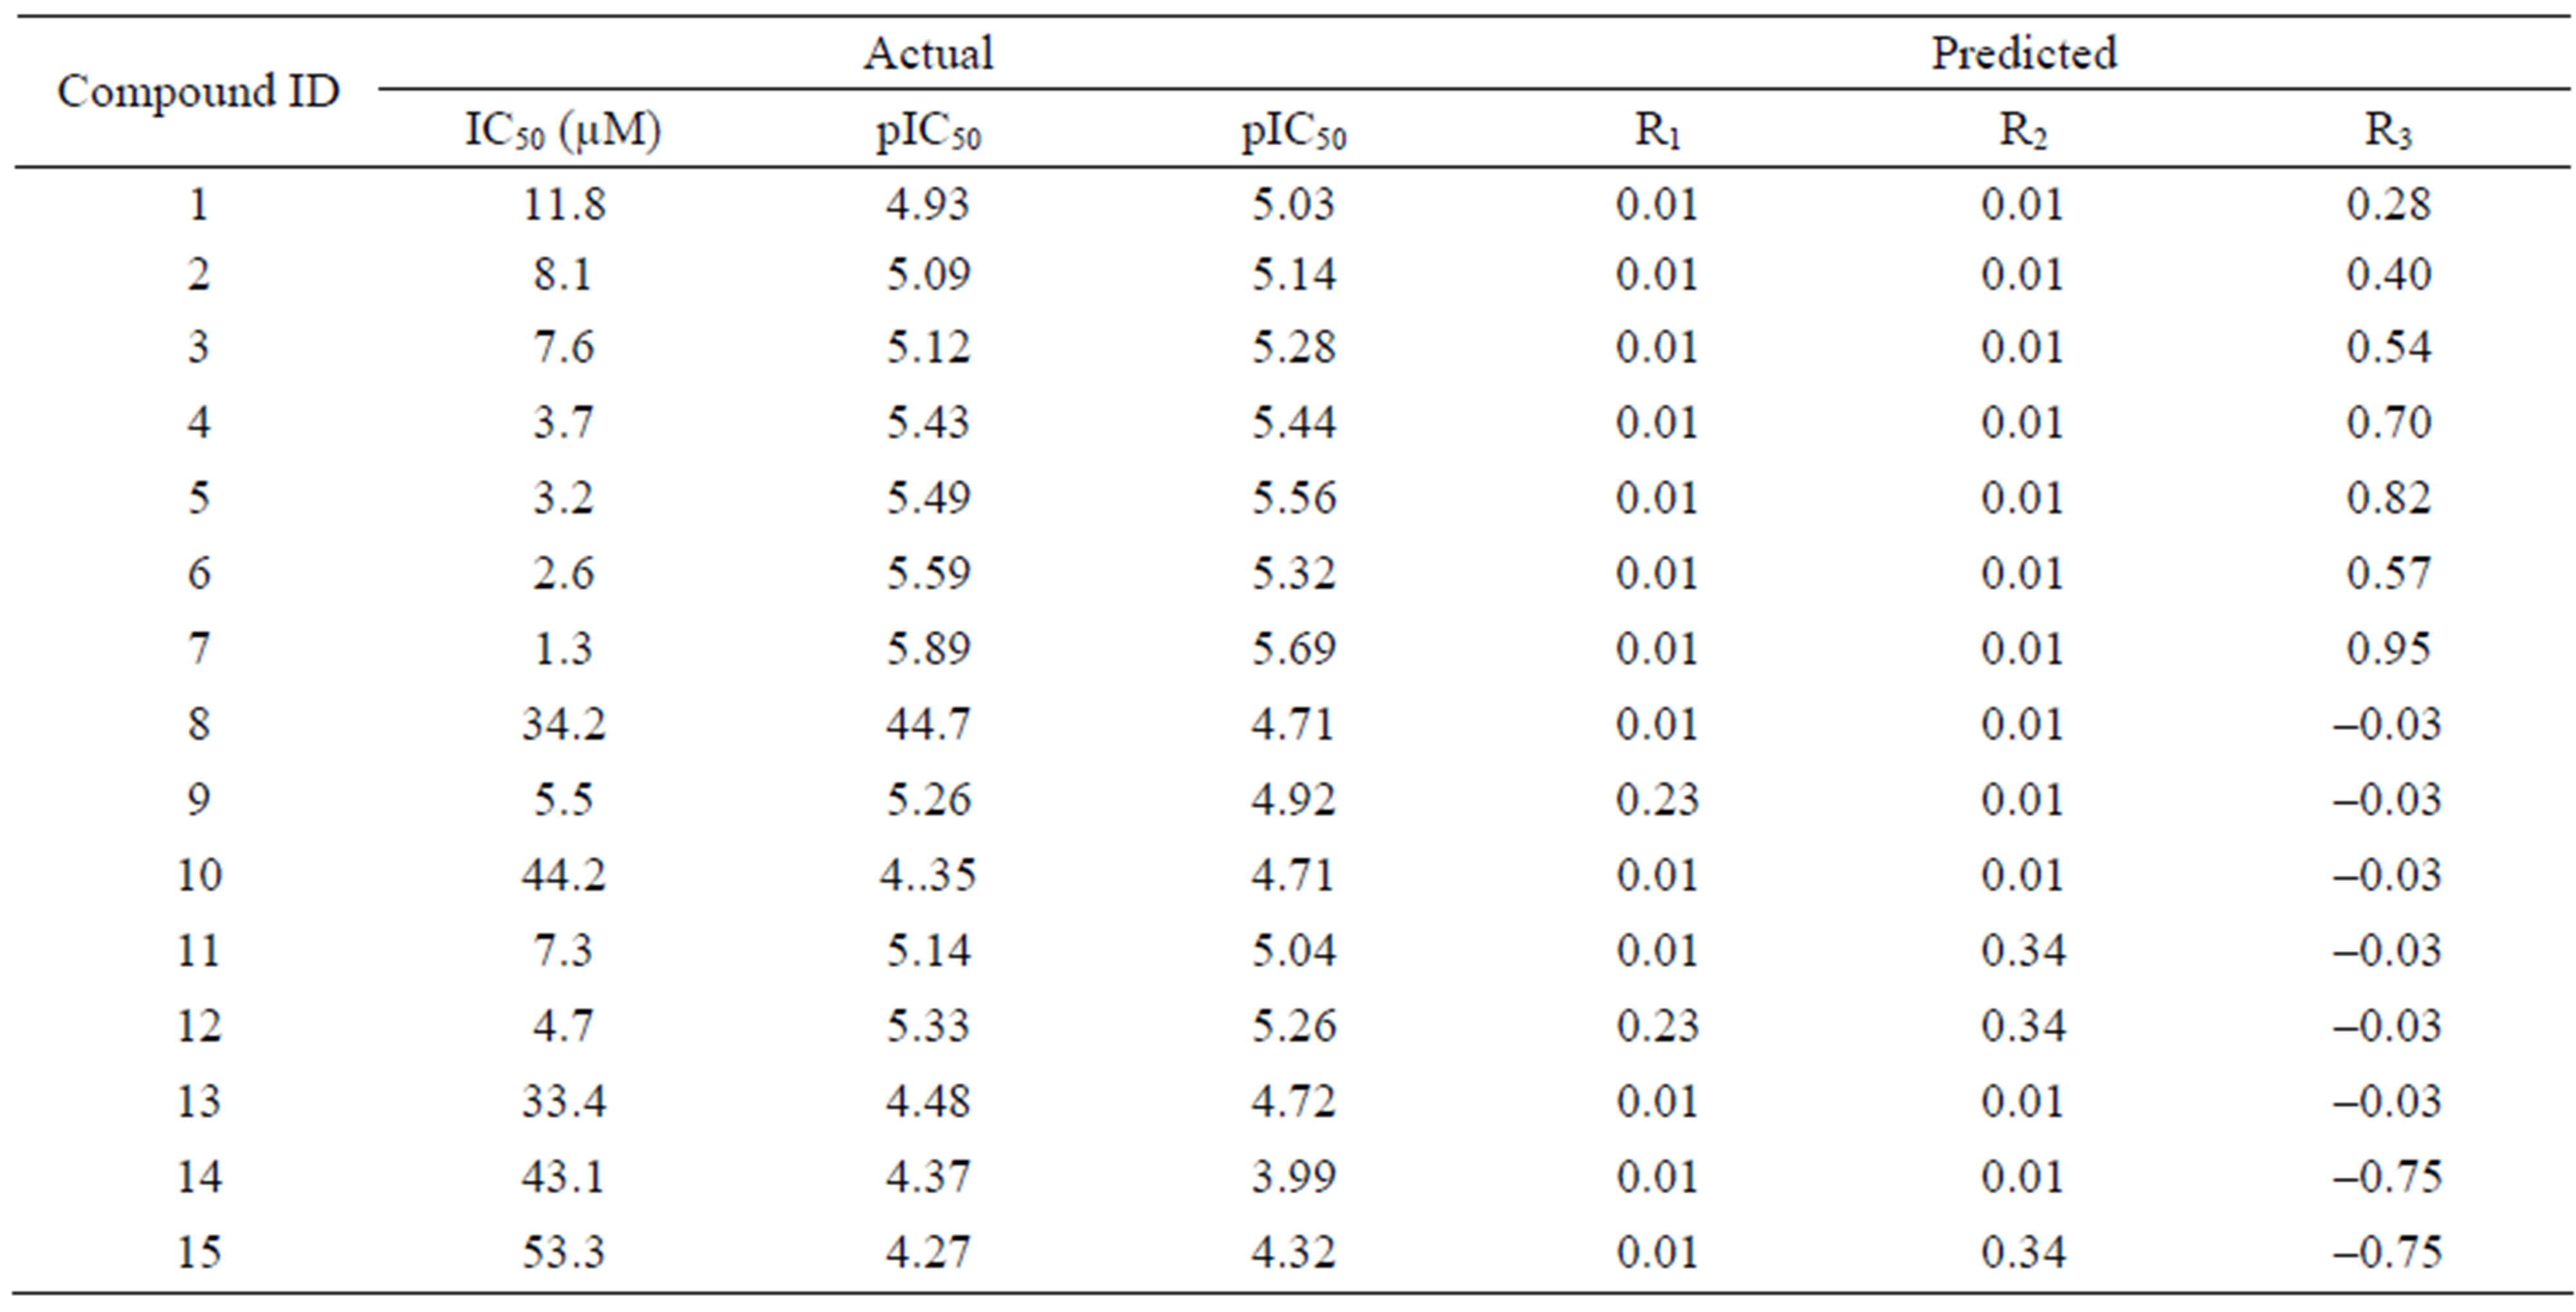
Table 2. The experimental and predicted activities of training sets, and the relative contributions of the fragments.
the termination, until molecule converged using Tripos standard force field with a distance-dependent dielectric function whose dielectric constant is 1.00.
Before submitting the job for Topomer CoMFA analysis, each of the training set structures was broken into three sets of fragments (also referred to as R-groups) as shown in Figure 1.
This was accomplished by specifying multiple acyclic single bonds to cut within each complete structure, since they all shared identical substructure (i.e., constant core). Once fragmentation was completed, the input structures were standardized, normalized and the topomers generated. The following values were reported in the Topomer CoMFA dialog after the model was created: the number of components that provided the highest q2 results; crossvalidated r2 (q2) value for the specified number of components; conventional r2 value; crosssvalidated standard error of estimate; y-intercept for the PLS analysis; predicted activity for the training sets, and fragment contributions of each R-group to the predicted activity (adding the sum of the fragment contributions with the PLS intercept value gives the predicted activity value). These results are summarized in Tables 2 and 3.
Topomer CoMFA calculates the contribution of each fragment (Rn in the equation below) toward the predicted activity by multiplying each grid point value for its steric and electrostatic fields by the corresponding coefficient, and summing these values. Thus, the pIC50 contributions from R-group are calculated using the CoMFA QSAR equation, an ordinarily invisible though fundamental result that, for Topomer CoMFA, includes up to 2000 terms for each R-group. For a particular R-group, this calculation commences by generating its Topomer and then its steric and electrostatic fields at each of the locations.

where SE is the steric interaction energy calculated at a particular spatial location; SC is the coefficient of the steric term, reflecting the relative contribution of a particular spatial contribution; EE is the electrostatic interaction energy calculated at a particular spatial location; EC is the coefficient of the electrostatic term, reflecting the relative contribution of a particular spatial location;  represent a particular spatial location.
The model generated was successful (since q2 > 0.2), and it was used to predict the activity of additional structures.
Topomer CoMFA produced large green contours around -OCH3, long aliphatic tertiary amine and -Cl groups as shown in Figure 2, indicating that the presence of a bulky substituent at these positions should improve biological activities. The Topomer CoMFA electrostatic map displays contours where the partial negative charge is associated with increased activity. As expected, they sit within the red regions in the electrostatic field, since their atomic charges (calculated using Gaisteiger-Huckel MMFF method) are all negative, except for the long red and blue contours due to alternating series of positive and negative charges. This suggests that they will improve activity. Based on these observations, 10 new compounds were designed (shown in Table 4), and the Topomer CoMFA model generated was used to predict biological activity for each compound. Substituents other than those present in the training set, especially R1 and R2, were explored to determine how they impact on activity. The Topomer CoMFA interface standardized and normalized the structures, and automatically applied the fragmentation rule used for the training set. Structures that failed to be split via fragmentation rule were manually split. Table 5 summarizes the results obtained.
Clearly, all the test compounds show better activity than the training set compounds with 17 as the most potent in the series. This is so because -SO3H has a superior steric bulk contribution than all other substituents at the metaposition, though it has about the same electrostatic contribution with -Cl at the same position. At the orthoposition, -OCH3 appears to improve activity more than any other groups examined at that position. Table 6 provides a summary of the steric and electrostatic con tributions of all the tested substituents, while Figure 3 (GM) shows an array of how they sit within the contours.
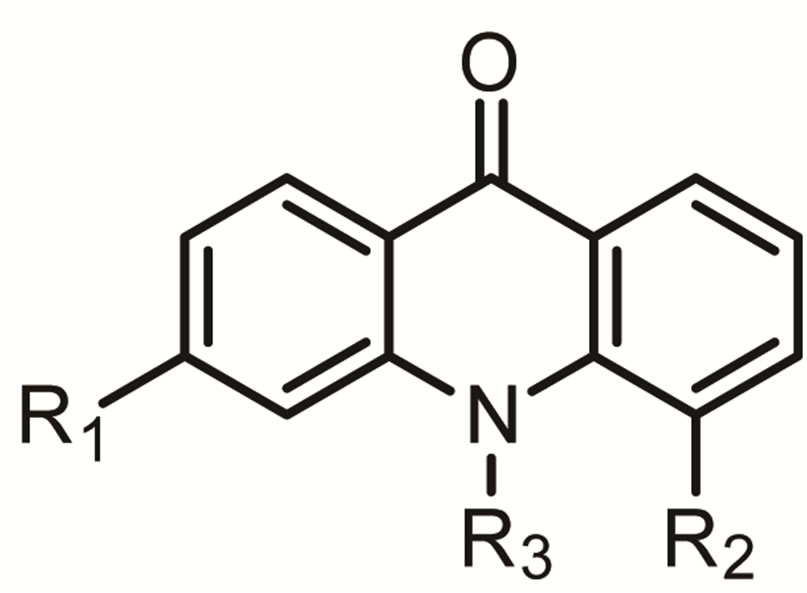
Figure 1. Fragments of training set structures.

Table 3. Results of the Topomer CoMFA analysis.
 (a)
(a)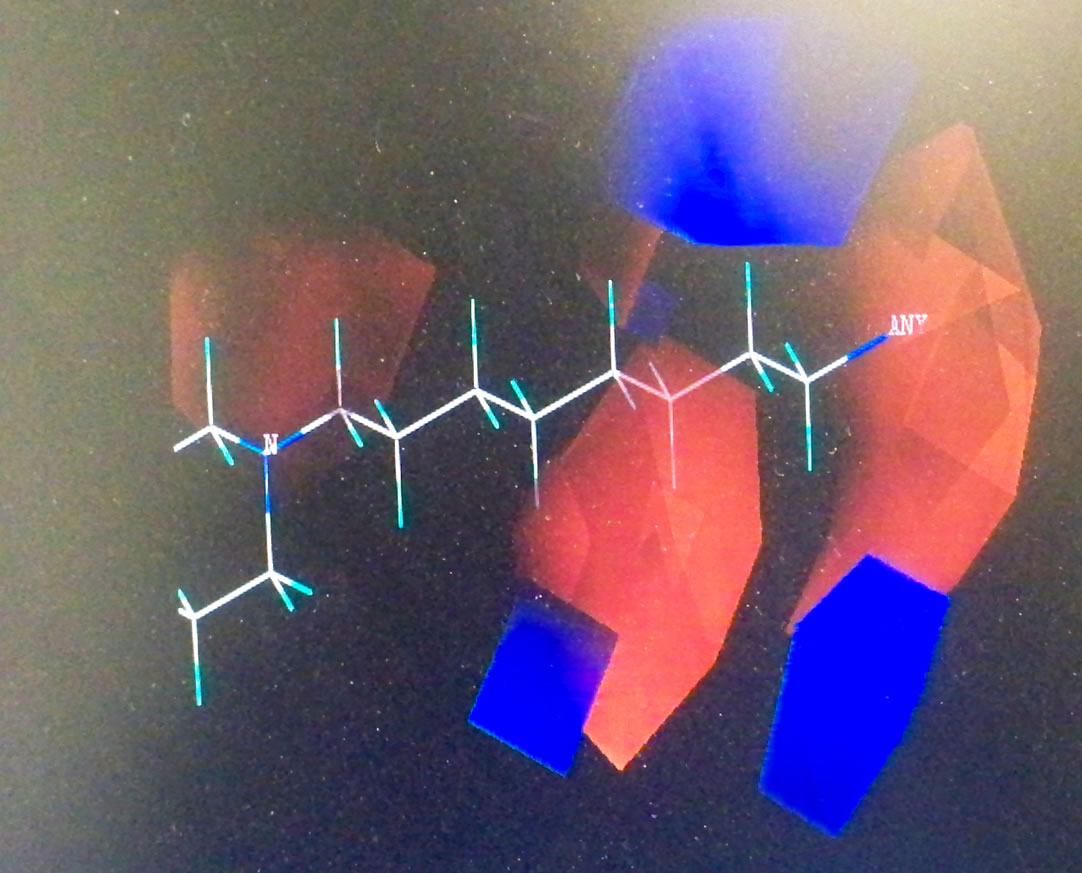 (b)
(b) (c)
(c)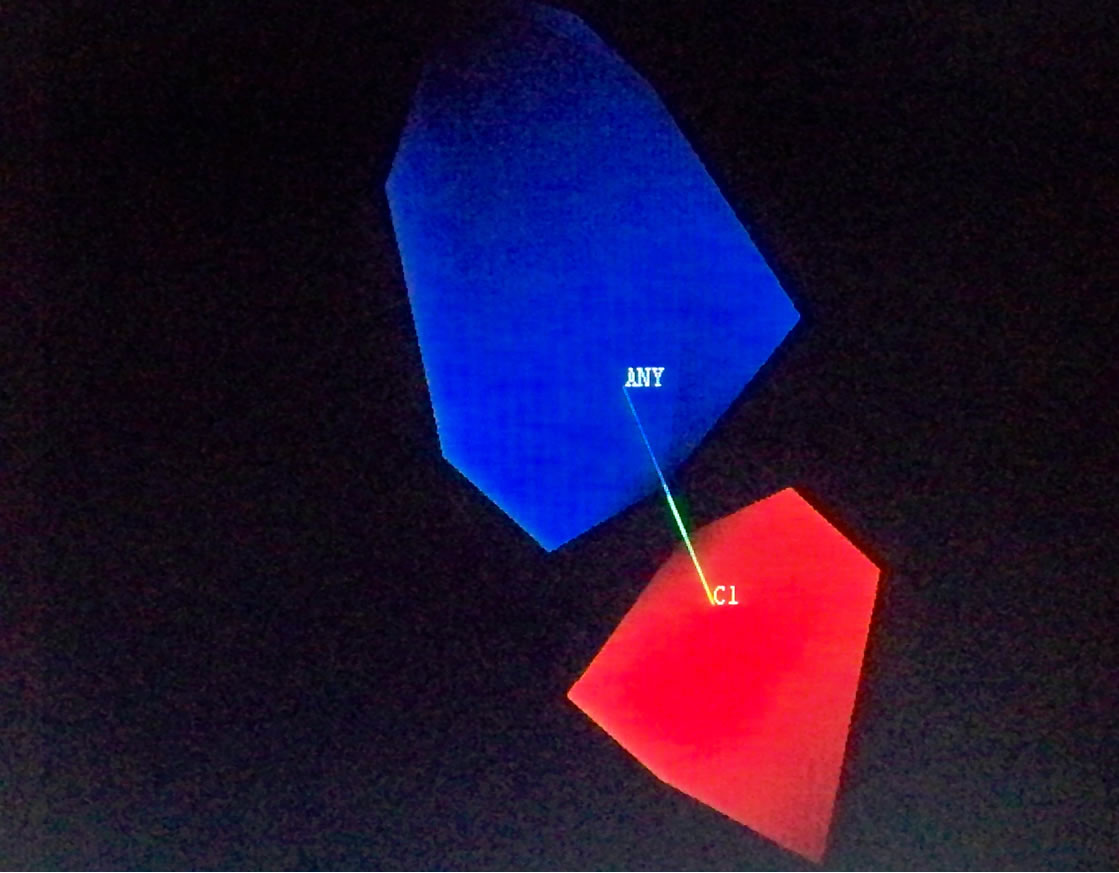 (d)
(d) (e)
(e) (f)
(f)
Figure 2. Topomer CoMFA steric (a), (c) and (e), and electrostatic contours (b), (d) and (f) for favored substituents steric contribution: Green areas favor steric bulk; adding substituents that sit within these pockets can improve activity. Conversely, yellow regions disfavor steric bulk. Electrostatic contribution: Blue areas favor positive charge and disfavor negative charge; adding positively charged substituents will improve activity. The red areas favor negatively charged substituents, and disfavor their positively charged counterparts.

Table 4. Chemical structures of test set.

Table 5. Predicted activity data for training set of compounds.
This present studies have established Topomer CoMFA as a 3D QSAR tool that automates the creation of models for predicting biological activity of compounds. The 3D QSAR results have revealed important sites where chemical modifications are desirable, which has led to the design of 10 novel derivatives for future studies.
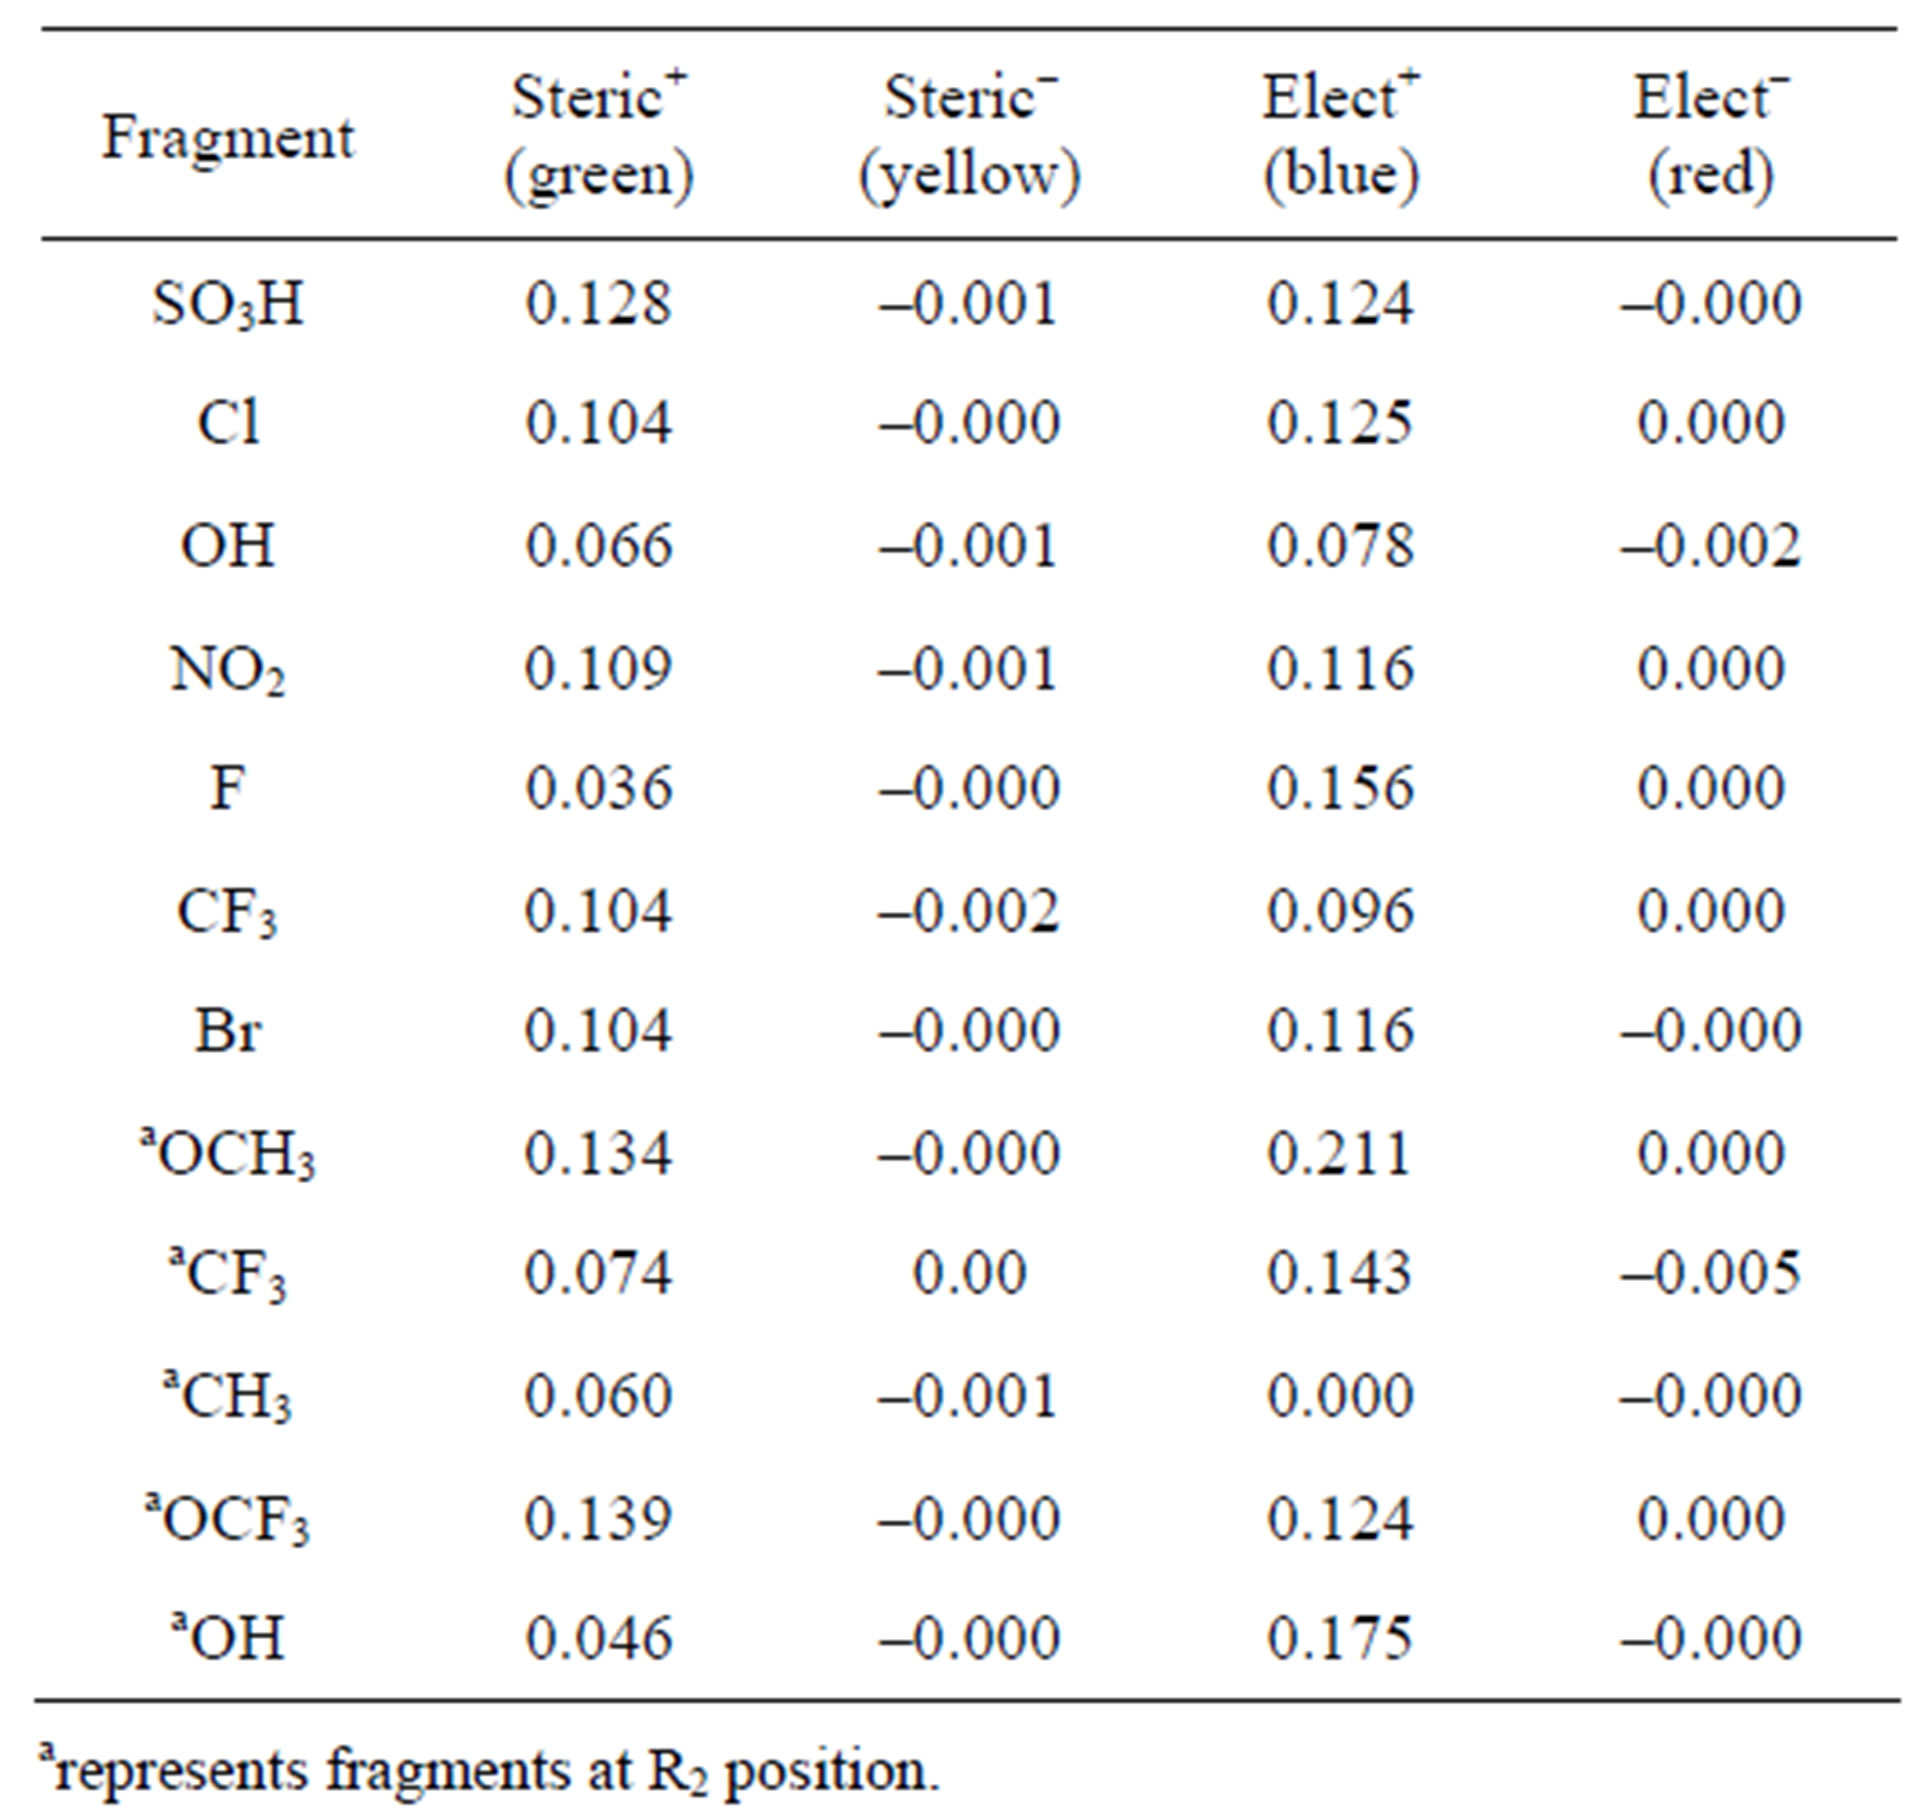
Table 6. Steric and electrostatic contributions of the substituents on test compounds.
 (a)
(a) (b)
(b)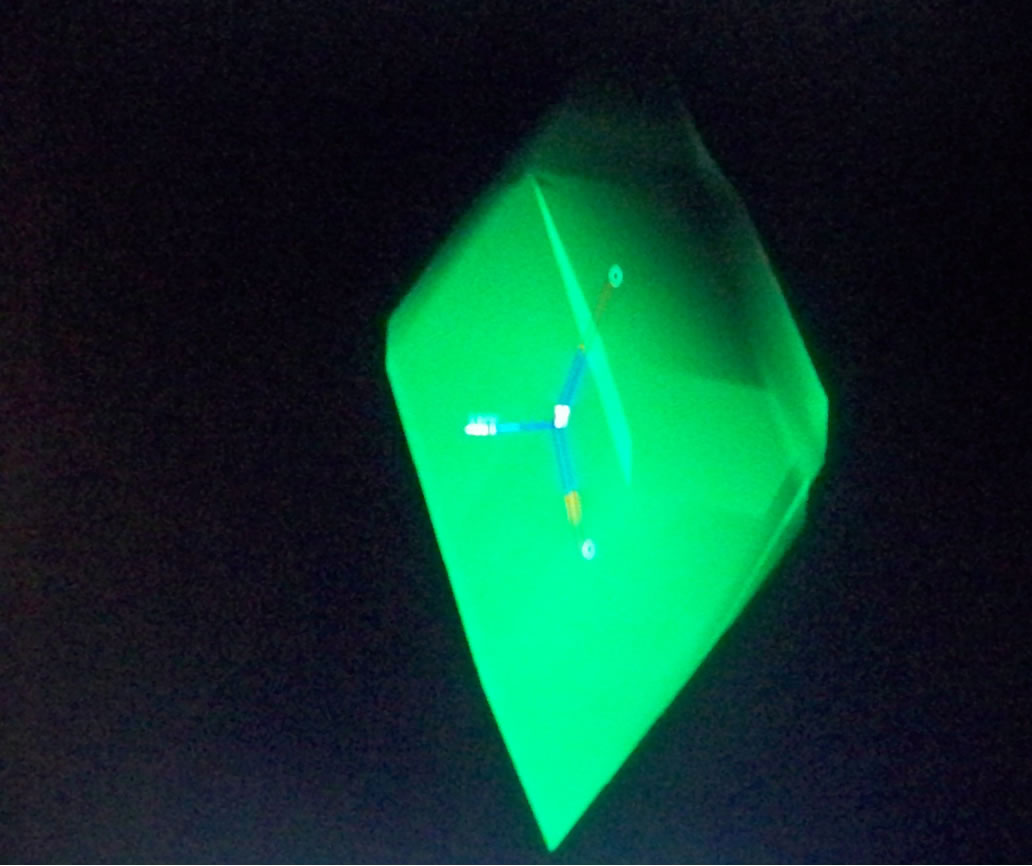 (c)
(c) (d)
(d)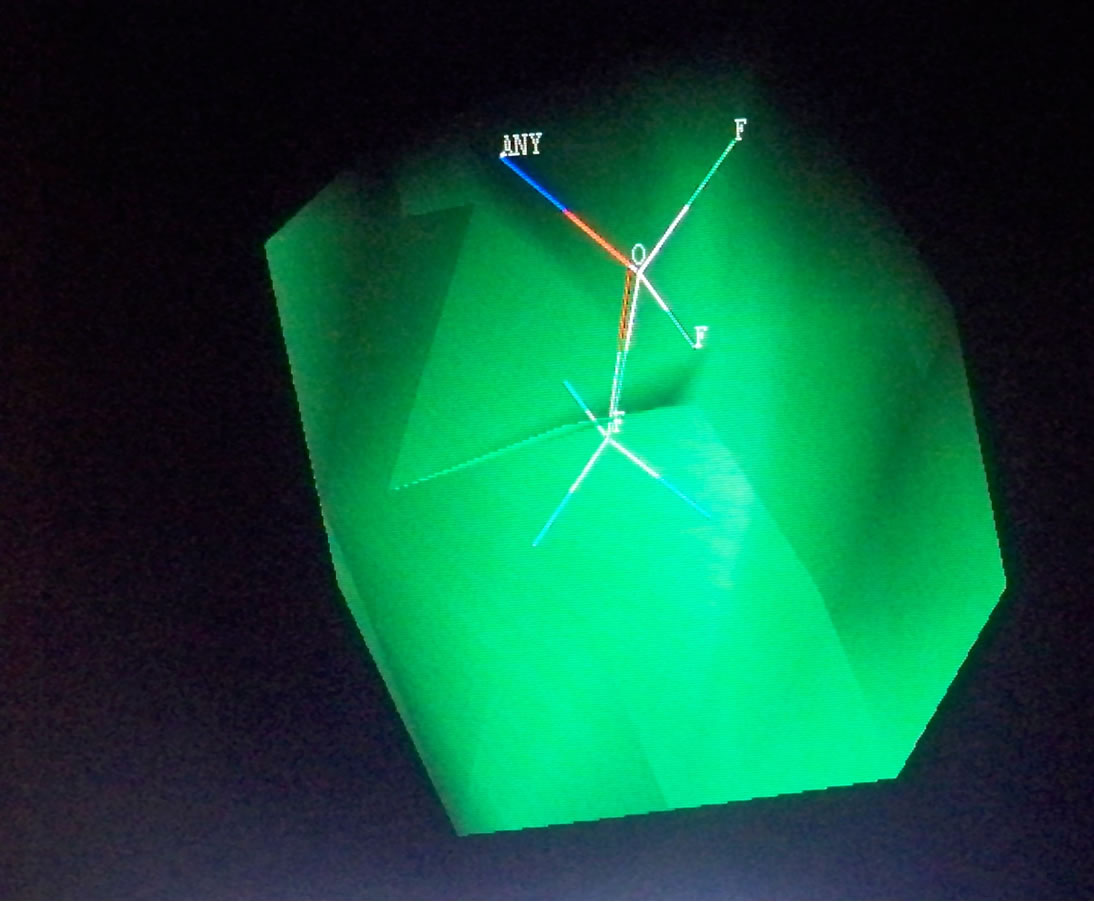 (e)
(e)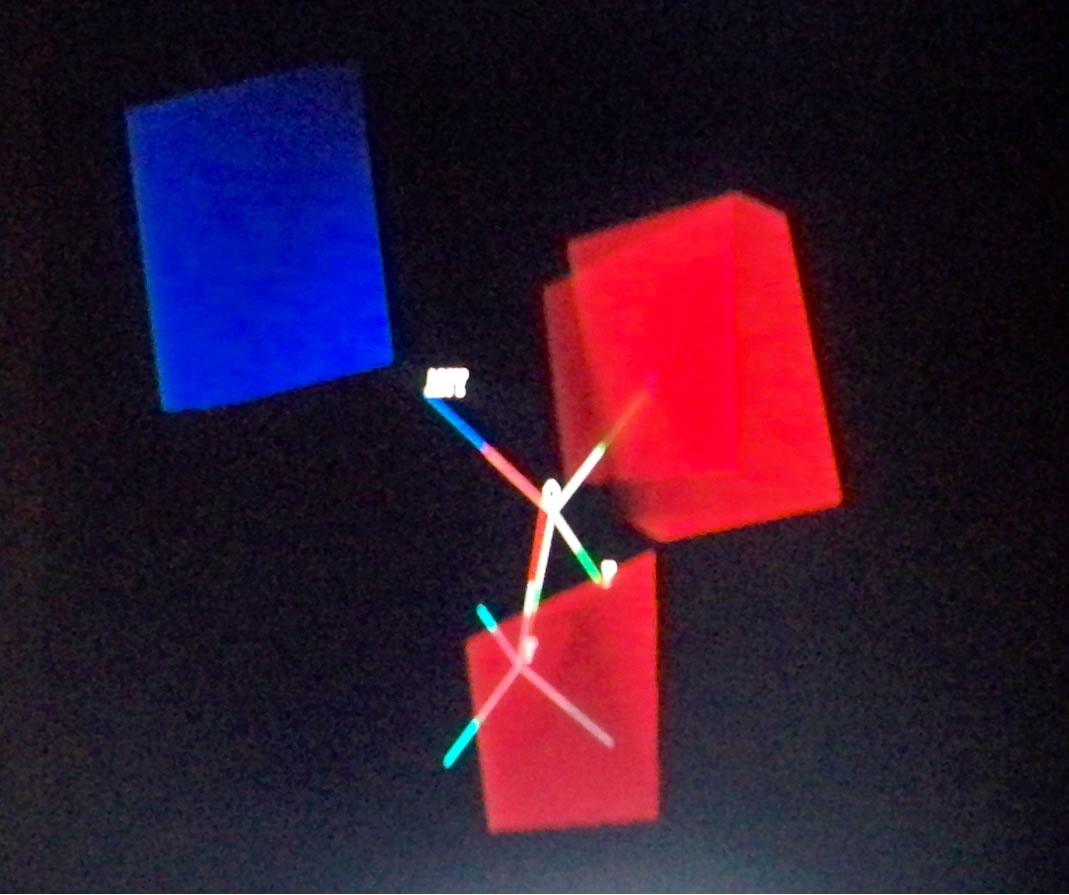 (f)
(f) (g)
(g) (h)
(h)
Figure 3. Steric and electrostatic contours of some test set fragments.
2. Acknowledgements
We are thankful to the US department of Education Title III Grant, Tennessee State University, for financial support.
REFERENCES
- K. Ramesh and K. Meena, “Chemistry of Acridone and Its Analogues: A Review,” Journal of Chemical and Pharmaceutical Research, Vol. 3, No. 1, 2011, pp. 217-230.
- W. D. Inman, M. O’Neill-Johnson and P. Crews, “Pyrroloacridine Alkaloids from Plakortis Quasiampkiaster: Structures and Bioactivity,” Journal of the American Chemical Society, Vol. 112, 1990, pp. 1-13.
- P. Akanitapichat, C. T. Lowden and K. F. Bastow, “1, 3-Dihydroxyacridone Derivatives as Inhibitors of Herpes Virus Replication,” Antiviral Research, Vol. 45, No. 2, 2000, pp. 123-134.
- J. R. Goodell, A. A. Madhok, H. Hiasa and D. M. Fergusson, “Synthesis and Evaluation of Acridineand Acridone-Based Anti-herpes Agents with Topoisomerase Activity,” Bioorganic & Medicinal Chemistry, Vol. 14, No. 16, 2006, pp. 5467-5480.
- C. T. Lowden and K. F. Bastow, “Cell Culture Replication of Herpes Simplex Virus and, or Human Cytomegalovirus Is Inhibited by 3,7-Dialkoxylated,1-hydroxy-acridone Derivatives,” Antiviral Research, Vol. 59, No. 3, 2003, pp. 143-154.
- M. Itoigawa, C. Ito, T.-S. Wu, et al., “Cancer Chemopreventive Activity of Acridone Alkaloids on Epstein-Barr Virus Activation and Two-Stage Mouse Skin Carcinogenesis,” Cancer Letters, Vol. 193, No. 2, 2003, pp. 133- 138.
- V. V. Zarubaev, A. V. Slita, V. Z. Krivitskaya, A. K. Sirotkin, A. L. Kovalenko and N. K. Chatterjee, “Direct Antiviral Effect of Cycloferon (10-Carboxymethyl-9-Acridanone) against Adenovirus Type 6 in Vitro,” Antiviral Research, Vol. 58, No. 2, 2003, pp. 131-137.
- S. S. Claudia, L. F. Mirta, B. M. Maria, L. D. Maite, F. P. Rolando, C. G. Cybele, B. D. Norma and B. D. Elsa, “Synthesis and Evaluation of N-Substituted Acridones as Antiviral Agents against Haemorrhagic Fever Viruses, Antiviral Chemistry & Chemotherapy,” Short Communications, Vol. 19, 2008, pp. 41-47.
- K. Dzierzbicka and A. M. kolodziejczyk, “Synthesis and Antitumor Activity of Conjugates of Muramyldipeptide, Normuramyldipeptide and Desmuramylpeptides with Acridine/Acridone Derivatives,” Journal of Medicinal Chemistry, Vol. 44, No. 22, 2001, pp. 3606-3615.
- S. A. Gamage, J. A. Spicer, G. J. Atwell, G. J. Finlay, B. C. Baguley and W. A. Denny, “Structure-Activity Relationships for Substituted Bis(Acridine-4-Carboxamides): A New Class of Anticancer Agents,” Journal of Medicinal Chemistry, Vol. 42, No. 13, 1999, pp. 2383-2393.
- T. Bentin and P. E. Nielsen, “Superior Duplex DNA Strand Invasion by Acridine Conjugated Peptide Nucleic Acids,” Journal of the American Chemical Society, Vol. 125, No. 21, 2003, pp. 6378-6379.
- X. K. Jane, J. S. Martin, A. C. Roland, D. L. Kristin, A. J. Robert, J. Aaron, A. D. Rozalia, J. H. David, W. Rolf and R. Michael, “Design, Synthesis and Evaluation of 10-NSubstituted Acridones as Novel Chemosensitizers in Plasmodium Falciparum,” Antimicrobial Agents and Chemotherapy, Vol. 51, No. 11, 2007, pp. 4133-4140.
- L. L. Zhu, T. J. Hou, L. R. Chen and X. J. Xu, “3DQSAR Analyses of Novel Tyrosine Kinase Inhibitors Based on Pharmacophore Alignment,” Journal of Chemical Information and Modeling, Vol. 41, No. 4, 2001, pp. 1032-1040.
- H. Kubinyi, “3D-QSAR in Drug Design: Theory, Methods and Applications,” ESCOM, Leiden, 1993.
- H. Kubinyi, G. Folkers and Y. C. Martin, “3D-QSAR in Drug Design: Recent Advances,” Perspectives in Drug Discovery and Design, Vol. 12, No. 13, 1997, pp. 3-23.
- R. D. Cramer, D. E. Patterson and J. D. Bunce, “Comparative Molecular Field Analysis (C0MFA). 1. Effect of Binding on Steroids to Carrier Proteins,” Journal of the American Chemical Society, Vol. 110, No. 18, 1988, pp. 5959-5967.
- Other Approaches Do Exist with Promising Direct 3D Database Searching with Potency Predictions, Such as Pseudo-Receptor Modeling, the Catalyst Suite, and Post- 3D-Searching CoMFA. However, They Are Limited in Speed, and Perhaps, Range of Applicability.
- Y. C. Martin, “3D QSAR: Current State, Scope and Limitations,” In: H. Kubinyi, G. Folkers and Y. C. Martin, Eds., Three-Dimensional Quantitative Structure Activity Relationships, Vol. 3, Springer, Netherlands, 2002, pp. 3-23.
- R. Bursi and P. D. G. Grootenhuis, “Comparative Molecular Field Analysis and Energy Interaction Studies of Thrombin-Inhibitor Complexes,” Journal of ComputerAided Molecular Design, Vol. 13, No. 3, 1999, pp. 221- 232.
- S. S. Sao and M. Karplus, “Evaluation of Design Ligands by Multiple Screening Method: Application of Glycogen Phosphorylase Inhibitors Constructed with a Variety of Approaches,” Journal of Computer-Aided Molecular Design, Vol. 15, No. 7, 2001, pp. 613-647.
- R. D. Cramer, R. D. Clark, D. E. Patterson and A. M. Fergusson, “Bioisosterism as a Molecular Diversity Descriptor: Steric Fields of Single ‘Topomeric’ Conformers,” Journal of Medicinal Chemistry, Vol. 39, No. 16, 1996, pp. 3060-3069.
- R. D. Cramer, “Topomer CoMFA: A Design Methodology for Rapid Lead Optimization,” Journal of Medicinal Chemistry, Vol. 46, No. 3, 2003, pp. 374-388.
- Sybyl-X 1.3, St. Louis, 2010. http://www.tripos.com
- T. A. Halgren, “A General Program for Modeling Molecules and their Interactions,” Journal of Computational Chemistry, Vol. 17, 1996, pp. 520-552.
- T. A. Halgren, “Merck Molecular Force Field III. Geometries and Vibrational Frequencies for MMFF94,” Journal of Computational Chemistry, Vol. 17, 1996, pp. 553-586.
- T. A. Halgren, “Merck Molecular Force Field V. Extension of MMFF94 Using Experimental Data, Additional Computation Data, and Empirical Rules,” Journal of Computational Chemistry, Vol. 17, 1996, pp. 616-641.
- T. A. Halgren, “Merck Molecular Force Field I. Basis, Form, Scope, Parameterization and Performance of MMFF94,” Journal of Computational Chemistry, Vol. 17, 1996, pp. 490-519.
- T. A. Halgren and R. B. Nachbar, “Merck Molecular Force Field IV. Conformational Energies and Geometries for MMFF94,” Journal of Computational Chemistry, Vol. 17, 1996, pp. 587-615.
NOTES
*Corresponding author.