Spectral Analysis Review
Vol.06 No.02(2018), Article ID:83626,10 pages
10.4236/sar.2018.62003
Application of Near-Infrared Spectroscopy in Determination of Schaftoside Acid in Desmodium styracifolium (Osb.) Merr.
Gengqiu Tang, Qingxi Cao, Dong Wang, Shengguo Ji*
School of Traditional Chinese Medicine, Guangdong Pharmaceutical University, Guangzhou, China

Copyright © 2018 by authors and Scientific Research Publishing Inc.
This work is licensed under the Creative Commons Attribution International License (CC BY 4.0).
http://creativecommons.org/licenses/by/4.0/


Received: January 20, 2018; Accepted: April 6, 2018; Published: April 9, 2018
ABSTRACT
The potential of Near Infrared Spectroscopy (NIRS) in quality control of Traditional Chinese Medicine has been evaluated. This study focuses on a rapid and non-destructive quantitative method for the determination of schaftoside acid content in Desmodium styracifolium by near-infrared spectroscopy. The schaftoside acid contents of 103 samples were determined by HPLC. The NIRS quantitative model of the ethanol extracts content was performed by partial least-squares (PLS) regression as linear regression with analysis values as calibration reference using 2nd derivative method as spectral preprocessing options. The model was verified by internal cross validation and external predictive validation with 22 Desmodium styracifolium samples. The correlation coefficients (r), the root-mean-square error of calibration (RMSEC), the root-mean-square error of prediction (RMSEP) and the root-mean-square error of cross-validation (RMSECV) of the calibration model for ethanol extracts content were 0.97201, 0.147, 0.162 and 0.433, respectively. The average recovery was 99.82%, and t-test showed that P > 0.5. Precision and repeatability RSD were 1.75% and 1.17%, RPD > 2.5. The data obtained from results showed that calibration model of NIRS was verified to be reliable, suggesting that the quantitative NIR models can be qualified to accurately quantify the ethanol extracts content of Desmodium styracifolium rapidly.
Keywords:
Desmodium styracifolium, Schaftoside Acid, NIRS, PLS

1. Introduction
Desmodium styracifolium (Osb.) Merr. (D. styracifolium), a plant belonging to genus Desmodium, family Fabaceae, is a traditional Chinese medicine that mainly distributes in China such as Guangdong, Guangxi and Hainan. It has been highlighted the use of its dry aerial parts as a cool-natured, sweet medicine for the treatment of many aliments like heat clearing, dampness, detumescence and kidney stone in clinical [1] . D. styracifolium has been confirmed having prophylactic effect in vitro study [2] [3] , as well as antiurolithic and antioxidant activities in vivo study [4] [5] . Phytochemical studies have shown that D. styracifolium contains alkaloids, flavonoids, glycosides, phenols, tannins and many other chemical components [6] , of which schaftoside acid is an active component that recorded in the Chinese Pharmacopoeia of 2015 edition (ChP) for quality control of ingredients [7] . Traditional Chinese medicine showed the presence of different chemical components. However, they are hardly to be rapidly determined. In recent years, Near Infrared Spectroscopy (NIR) technology has been widely applied in discrimination of Chinese medicinal material and Chinese medicinal preparations for its rapidity, non-destructiveness and accuracy [8] [9] [10] .
Near-infrared Spectroscopy (NIRS), a new rapidly and environmentally friendly analytical technology, has shown substantial promise and proved to be very effective for analysis and determination of agricultural products, food, petrochemical industry, traditional Chinese medicine, tobacco and wine, etc. due to its function of rapid, convenient and nondestructive testing and adaptability to on-line analysis [1] - [10] . Its region covers the wavelength range 12,000 - 4000 cm−1 (750 - 2500 nm), and the absorption covers enough chemical information for qualitative and quantitative analysis of TCM. Generally, the NIR mathematical models are established combined with multivariate data analysis methods including partial least-squares regression (PLSR), artificial neural networks (ANN), principle component analysis, multiple linear regression etc., among which PLS and ANN had been widely used in NIR analysis [11] .
So far, we have found no report about the application of Near-Infrared Spectroscopy in determination of schaftoside acid in D. styracifolium. Therefore, In this study, a collection of D. styracifolium from different producing areas has been determined by NIR methods using PLS, combined with a series of spectra preprocessing combination optimization, to set up the content of calibration model. Finally, the content of schaftoside acid has been carried on the quantitative analysis to develop a model of D. styracifolium and search for a better system of quality evaluation.
2. Materials and Methods
2.1. Plant Materials
D. styracifolium (Osb.) Merr. used in this study were collected from Guangdong Province, Guangxi Province and Hainan Province, China, taxonomically identified and authenticated by Prof. Shengguo Ji, School of Traditional Chinese Medicine, Guangdong Pharmaceutical University of China. Samples were powdered to a homogeneous size in a mill, passed through a No. 50 mesh and preserved in desiccators for NIRS study.
2.2. Near Infrared Instrument
The NIRS were measured with Fourier transform NIRS analyzer, furnished with integrating sphere (diffuse reflection, InGaAs detector), sample spinner, quartz sample cup attachments. This instrument was controlled with the OMNIC software (Nicolet 6700, Thermo scientific, USA). Classification analysis was carried out using TQ analyst 8.0 software, and clustering was calculated by OPUS 6.5 software (Bruker, Germany).
2.3. NIRS Data Collecting and Analysis
Each powdered sample about 4 g was weighed and fully mixed in the quartz sample cup with slightly quaking to be fully distributed. All the NIRS datas were acquired under the same measurement conditions i.e. scan region: 12,000 - 4000 cm−1; number of scans: 32; resolution: 8 cm−1; temperature: 25˚C ± 2˚C; relative humidity: 40% - 45%. Each pulverized sample was loaded and measured five times to obtained five spectrums of the same sample, the mean of which was for analysis. All the spectrums were represented in Figure 1.
3. Results
3.1. Selection of Spectral Pretreatment for the Calibration Model
Differences between NIRS spectrum will be occurred due to the particle size,

Figure 1. Near-infrared spectra of 103 Desmodium styracifolium samples.
crystal shape and other physical properties of powder samples in collection of near infrared diffuse reflectance spectra of the sample. Therefore, the combination of computer software technology and chemometrics method to pretreat the original spectrum was carried out in order to remove the spectral drift caused by the differences between sample physical properties, improve the resolution and sensitivity, distinguish the overlapping peaks and shoulder peaks, reduce the signal-to-noise ratio, and ensure a good correlation between the spectral data and component information [10] . The pretreatment of spectral includes Multiplicative scatter correction (MSC), standard normal variate (SNV), 1st derivative, or 2nd derivative methods. MSC and SNV methods were used to eliminate the influence of radiation scattering customary, and 1st and 2nd derivative spectra were compared to solve the effects of baseline drift. The data listed in Table 1 revealed that the optimal parameters for the calibration model were that second derivative as spectral pre-processing method due to its higher coefficient of correlation (r2) and lower RMSEC and RMSEV. In this study, we use partial least squares method for the modeling approach after getting the pretreatment data. The composite indicators that examine different pretreatment methods on the established model include r2, RMSEC, RMSEP and RESEV. The model for the D. styracifolium had the highest coefficient of correlation (r2 = 0.972). Coefficient of correlation, RMSEC and RMSEV of the schaftoside acid model of the D. styracifolium were 0.972, 0.147 and 0.433, respectively, which demonstrated a good predictive capacity.
3.2. Selection of the Wave Band for the Calibration Model
The selection of suitable wave band is an important step for calibration models building. Generally the performance of calibration models would be greatly influenced when the selected wave band is too wide to cover a large numbers of miscellaneous information. By contrast, the calibration models may be overfitting when the selected wave band is too narrow to lose the important structural information. In this study, r2, RMSEC, RMSEP and RESEV were used as the integrated indicators to study the effects of different wave band for the model. It

Table 1. The influence of different pretreatment methods on the model.
showed that the wave band of 7796 cm−1 - 4037 cm−1 levels has high relevance to D. styracifolium compared with other bands. The results were showed in Table 2.
3.3. Selection of the Optimum Number of Factors for the Calibration Model
In order to make full use of the effective information of the spectrum signal and avoid overfitting state while using PLS method to establish the quantitative calibration models, it is necessary to make a reasonable selection in the main factors. In this study, the optimum number of factors was selected regarding the lowest values of RMSECV using cross validation method [12] . It was found that the minimum value of RMSECV was 0.433, and the best main factor was corresponding to the number 7. The results were showed in Figure 2.
3.4. Establishment of Calibration Models
The contents of schaftoside acid in D. styracifolium of 103 samples were determined by HPLC. Each sample was determined for three times to obtain the average value. The results of methodology verification including the calibration
Table 2. The influence of wave band for the model.

Figure 2. Near-infrared spectra of 103 Desmodium styracifolium samples.
curves, precision and average recoveries were listed in Table 3. A correlation diagram NIR between the predicted value and the reference value of 103 samples obtained by cross-validation was showed in Figure 3, which can be seen that the calibration samples uniformly distributed on both side of the regression line. RMSECV obtained by internal cross-validation was 0.433, and r2 of the model was 0.972, which meet the requirements of r2 > 0.95 and RMSECV < 1.5. The results showed the preferably quality of the model to predict high precision. A Deviation between NIR value and HPLC value of calibration and validation samples was showed in Figure 4, with absolute deviations of ±0.4 between calibration and validation.
3.5. External Validation of the Calibration Model [4]
External validation of the performance of the calibration models including their
Table 3. The methodology verification results of HPLC method.
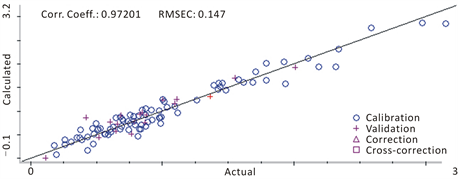
Figure 3. Relationship between reference and predictive value in calibration samples.

Figure 4. Deviation between NIR value and HPLC value of calibration and validation samples.
accuracy, repeatability, stability and transitivity were conducted after the establishment of the model. In this study, the validated sets of samples were completely independent to the calibration set of samples. All information of chemical component of testing samples were included in the number of calibration set of samples, and 95% of concentration of calibration set of samples was covered the concentration of validated set of samples, which distributed uniformly. 22 parts of the samples were used to predict results of inspection of the model. The lower RPD of validation and prediction set, the higher accuracy it is. Test results were showed in Table 4. Prediction average recovery of D. styracifolium was 99.82%. RPD of D. styracifolium determination of model was 2.7, indicating that the model is acceptable. By the statistical test and according to a given level of significance (0.5), t-test result showed that predicted and observed values of (0.5, 21) was 0.686, 22 samples of 0.29, t < t (0.5, 21), p > 0.5, which indicated the difference was not significant. Therefore, there is no systematic error between the pharmacopoeia methods and spectrometry reference method. By consolidated
Table 4. Average recovery of 22 validation samples.
analysis of the respective results, it reveals that the model meets the needs of fast and non-destructive testing in D. styracifolium.
3.6. Validation of the Above Method
3.6.1. Inspection of Precision
A sample powder 4 g was weighed to get NIR spectrum scanning six times repeatedly, and inputs NIR analysis model to calculate the content. It was found that the RSD is 1.75%.
3.6.2. Inspection of Repeatability
Each of six sample powders 4 g was weighed, respectively, to get NIR spectrum scanning six times repeatedly, and inputs NIR analysis model to calculate the content. It was found that the RSD is 1.17%.
4. Discussion
Since growing environment of D. styracifolium and the origin of place are of certain influence to the change of the chemical compositions, we were collecting 103 batches of samples with different growing environments and origins to ensure that the universality of the samples.
Several studies indicated that physical-constituents of samples showed significantly characteristics, such as particle size, water content and interaction between them, which influenced the results of near infrared absorption and variation in the NIR [8] [9] [10] [12] . For the sake of avoiding the existence of the error, all the samples were powdered to a homogeneous size in a mill, passed through a No.50 mesh and preserved in desiccators. In the actual application the reliability of the model needs to be strictly controlled, but the ingredients of traditional Chinese medicine are complex, resulting in serious NIRS band overlapping. At present, the application on evaluating quality of traditional Chinese medicine by establishing a model is being considered more and more [13] [14] . However, most of evaluation parameters in the adopted model, such as R, RMSEV, RMSEP of variance, are lack of a methodology validation in model, leading to insufficient predictability and stability of the model. In order to make the NIRS quantitative model for comprehensive evaluation and validation, and solve the problems of NIRS quantitative analysis method, we adopted chemical metrology verification method, t-test and model methodology. The results obviously showed that RMSECV by internal cross-validation was 0.433, the r2 of model was 0.972, and the average recovery was 99.82%. Prediction and repeatability was 1.75%, 1.17%, respectively, RPD > 2. All of these suggested that the results of model prediction are acceptable, and results of t-test also passed the verification and inspection of the model. Therefore, the content of D. styracifolium can be accurately predicted by PLS quantitative correction model established by NIR spectra.
Popularization and application of NIRS method in the production of traditional Chinese medicines relies on its accuracy, and verifies the validity of the method. Since conventional chemical metrology verification method cannot satisfied the needs of analysis, the introduction of methodology and validation of the model, and the comprehensive effective method on the quantitative model validation were put forward in this paper to ensure that the result of the analysis was accurate and effective. Therefore, the validation of NIRS method can be used in traditional Chinese medicine production, from medicinal materials to the final preparation process monitoring.
5. Conclusion
The experiments were carried out by near-infrared spectroscopy combined with conventional HPLC measuring method for rapid quantitative determination of schaftoside acid from D. styracifolium. The results demonstrated that the NIRS model of D. styracifolium showed high specificity and accuracy by analysis of RMSEC, correlation coefficient, RMSEP and Rp values. Therefore, PLS calibration model quantitatively established by NIR spectroscopy can be more precise to predict the content of schaftoside acid, solve the problems of the cumbersome process on online analysis of conventional method, and is fast, without compromising to the medicine, which can be used as the rapid detective methods in content of medicines, and can be applied to the process of content quality control.
Conflicts of Interest Statement
No conflict of interest exits in the submission of this manuscript, and manuscript is approved by all authors for publication.
Acknowledgements
Authors are greatly thankful to Guangdong Pharmaceutical University for providing necessary facilities and encouragement to carry out the work successfully.
Cite this paper
Tang, G.Q., Cao, Q.X., Wang, D. and Ji, S.G. (2018) Application of Near-Infrared Spectroscopy in Determination of Schaftoside Acid in Desmodium styracifolium (Osb.) Merr. Spectral Analysis Reviews, 6, 33-42. https://doi.org/10.4236/sar.2018.62003
References
- 1. Liu, L., Chen, M. and Chen, X. (2015) Analysis of Alcohol Dehydrogenase Inhibitors from Desmodium Styracifolium Using Centrifugal Ultrafltration Coupled with HPLC-MS. Journal of the Serbian Chemical Society, 80, 23-23. https://doi.org/10.2298/JSC140919023L
- 2. Moe, O.W. (2006) Kidney Stones: Pathophysiology and Medical Management. Lancet, 367, 333-344. https://doi.org/10.1016/S0140-6736(06)68071-9
- 3. Gürocak, S. and Küpeli, B. (2006) Consumption of Historical and Current Phytotherapeutic Agents for Urolithiasis: A Critical Review. Journal of Urology, 176, 450-455. https://doi.org/10.1016/j.juro.2006.03.034
- 4. Xiang, S.T., Zhou, J.F., Gan, S., Rong, X.L., Li, J. and Wang, S.S. (2013) Antiurolithiatic Activity of Aqueous Extract from Desmodium styracifolium (Osb.) Merr. on Renal Calcium Oxalate in Rats. Chinese Journal of Experimental Surgery, 30, 1166-1166.
- 5. Xiang, S.T., Gan, S., Zhou, J.F., et al. (2014) Effects of Aqueous Extract from Desmodium styracifolium (Osb.) Merr. on Oxidative Stress of Renal Calcium Oxalate Rat Models. Chinese Journal of Urology, 35, 465-468.
- 6. Zhang, Y.Q., Luo, J.G., Han, C., Xu, J.F. and Kong, L.Y. (2015) Bioassay-Guided Preparative Separation of Angiotensin-Converting Enzyme Inhibitory C-Flavone Glycosides from Desmodium styracifolium by Recycling Complexation High-Speed Counter-Current Chromatography. Journal of Pharmaceutical & Biomedical Analysis, 102, 276-281. https://doi.org/10.1016/j.jpba.2014.09.027
- 7. Committee, N.P. (2015) Pharamcoeia of People’s Republic of China (Part 1). Chemical Industry Press, Beijing.
- 8. Guo, N.X., Cai, J.L., Huang, J.Y., Li, L.L. and Ji, S.G. (2013) Quantitative Model for Hesperidin Content in Citrus Reticulate by NIR Spectroscopy. China Pharmacy, 24, 2932-2934.
- 9. Li, L.L., Wang, H.X., Ling, P. and Ji, S.G. (2013) Application of Near-Infrared Spectroscopy in Determination of Moisture Content in Eriobotrya Japonica. Chinese Journal of Experimental Traditional Medical Formulae, 19, 104-109.
- 10. Wang, D., Jia, Y. and Ji, S.G. (2013) Identification of Dihuang Steamed for Different Hours with Near-Infrared Spectrum. Chinese Journal of Spectroscopy Laboratory, 27, 1356-1360.
- 11. Kirchler, C.G., Pezzei, C.K., Beć, K.B., Henn, R., Ishigaki, M., Ozaki, Y., et al. (2017) Critical Evaluation of NIR and ATR-IR Spectroscopic Quantifications of Rosmarinic Acid in Rosmarini Folium Supported by Quantum Chemical Calculations. Planta Medica, 83, 1076-1084. https://doi.org/10.1055/s-0043-107032
- 12. Li, W., Wang, Y. and Qu, H. (2012) Near Infrared Spectroscopy as a Tool for the Rapid Analysis of the Honeysuckle Extracts. Vibrational Spectroscopy, 62, 159-164. https://doi.org/10.1016/j.vibspec.2012.07.005
- 13. Pezzei, C.K., Schönbichler, S.A., Hussain, S., Kirchler, C.G., Huck-Pezzei, V.A., Popp, M., Krolitzek, J., Bonn, G.K. and Huck, C.W. (2017) Near-Infrared and Mid-Infrared Spectroscopic Techniques for a Fast and Non-Destructive Quality Control of Thymi Herba. Planta Medica. https://doi.org/10.1055/s-0043-121038
- 14. Nie, L., Dai, Z. and Ma, S. (2016) Enhanced Accuracy of Near-Infrared Spectroscopy for Traditional Chinese Medicine with Competitive Adaptive Reweighted Sampling. Analytical Letters, 49, 2259-2267. https://doi.org/10.1080/00032719.2016.1143479