Wastewater Remediation Using Algae Grown on a Substrate for Biomass and Biofuel Production ()
1. Introduction
Surging oil prices hit farmers particularly hard through high fuel, feed and fertilizer costs. Farm-based local sources of renewable energy and animal feed have the potential to insulate farmers from global fluctuations in cost and availability. Development of rural-based production and processing of these commodities could effectively bolster rural economies.
Nutrient contamination of surface waters has led to widespread excessive algae growth, a process known as eutrophication. Eutrophication can lead to fish kills through oxygen depletion or the growth of toxic dinoflagellates that produce neurotoxins harmful to fish and humans [1] -[3] . Eutrophication also can cause taste and odor issues that create expensive problems for municipalities that rely on surface water for their drinking water and individual households depending on groundwater [4] [5] . Surface-water nutrient contamination occurs in many areas because concentrated animal feeding operations (CAFOs) (such as dairy and swine) capture farm runoff in holding ponds (lagoons) and then apply water from these lagoons to their fields [6] [7] . Due to the imbalance between the typical nutrient concentrations of lagoon effluent and the nutrient requirement of crops, excess nutrients (particularly phosphorus) can build up in the soil potentially causing significant nutrient runoff into surface waters [8] -[12] .
Additionally, both livestock and human wastes contain high amounts of persistent organic pollutants such as pharmaceuticals. Pharmaceuticals such as 17α-ethinylestradiol and other hormones, antibiotics, and antidepressants have been shown to be present in municipal sewage treatment effluents and have been found to have profound effects on aquatic life. Antibiotics in waterways drive the evolution of antibiotic resistant bacteria [13] [14] . Antidepressants in streams may be causing disruptive effects on reproduction, behavior and development in freshwater mussels [15] -[17] and fish [18] [19] . Estrogenic compounds have also been shown to cause adverse effects in reproduction for stream life. For example, many river basins have been found to have intersex bass, i.e. male fish with eggs developing in testes, with occurrence rates as high as 91% [20] . The ecological effects of these compounds individually and in combination [21] are just beginning to be understood.
While tertiary treatment of municipal sewage effluents and remediation of animal waste streams is an additional technological and economic pressure on municipalities and farms that threatens their economic sustainability, it also presents an opportunity. As fuel supplies begin to dwindle and prices climb there is a renewed interest in using algae as a feedstock for fuel oil. Algae are fast growing, offer considerable advantage in terms of photosynthetic efficiency, and many produce high amounts of oil [22] . For growth, algae require CO2, sunlight, and the very nutrients that are so rich in animal waste, such as nitrate, ammonia, and phosphorous. Algae turn these inputs into oil and many other cellular constituents. During their normal metabolic processing they are also capable of uptake and degradation of some of the pharmaceuticals in the water the algae inhabit [23] .
Using algae to absorb the nutrients from human and animal waste could be a low-cost treatment option. Moreover, algae afford the added value of producing fuel through the synthesis of oil. After oil is extracted, the remaining “algae cake” becomes a nutrient rich animal feed. Such a system would allow the farmer to turn waste into value-added products. However, there are a number of problems with current algae growth systems. Algae grown in an open pond or raceway system are suspended in the water in the presence of soluble and suspended waste. Such algae can be extremely difficult to harvest due to the fact that oilagenous algae are approximately 5 - 10 micrometers in diameter. Many of the most productive microalgae cannot be easily filtered and harvest through centrifugation is expensive [24] . Algae can be harvested by sedimentation. However, this is a slow process and requires considerable space. Metal salts can be used as flocculants to facilitate sedimentation however that leaves the water contaminated. Algal pond systems are also susceptible to washout, where algae leave the system and enter surface waters.
An alternative approach uses algae attached to a substrate. The most common is referred to as an algal turf scrubber (ATS) that grows the algae fixed to a substrate, thereby holding the algae in the system as wastewater passes by the algae. This allows for continuous nutrient extraction and facilitates harvest from the substrate rather than trying to dewater an algal suspension. This type of system is currently in use for lowering nutrient loads in surface waters and can be quite effective at reducing nutrient loads [25] . One problem with ATS is that the water flows quickly past the algae and contaminants mostly are not in close contact with the algae. This requires an expansive system for maximum effectiveness. We have designed a modified system that increases fluid-phase nutrient interaction with algae. In our design algae were grown on a cotton cloth substrate (in unpublished work we have determined better materials for this process). When the algal cells have achieved a high density on the substrate, the cloth was removed and allowed to drip then air dry. This harvesting method bypasses the need to filter, centrifuge or flocculate, making it effective and economical. The dried algae can then be scraped off and pressed to release the oil. Finally, the algae cake that remains can be used as a protein and carbohydrate rich feed for livestock, or used directly for biomass energy production. The cotton cloth itself can be returned to the trough and re-inoculated with algae to begin another cycle.
The goal of this research was to demonstrate proof of concept and to characterize the parameters of a benchscale system in order to design a prototype field-scale system.
2. Methods
2.1. Experimental Set-Up
We constructed nine trough systems with four inch square PVC fence post cut to four foot lengths. One side of the post was removed leaving supports at one foot intervals, and the ends were capped with fence post caps and eleven pairs of 10 cm long PVC corner protectors per trough were glued 45 degrees to the long axis and 4.25 inch (10.8 cm) intervals on the sides for filter supports. Filter baffle backings (9 by 11 cm) were constructed of porous plastic material (Sweers Sheerflow Gutter Filter). Muslin cloth was cut to wrap around the baffles and secured with staples (Figure 1(a)). Eleven evenly-spaced filter baffles were installed into each trough and positioned at 45 degrees from vertical. Water was added to the upper end of the trough and flowed by gravity through the filters to the lower end, dropping 1.5 inch (3.8 cm) over the 4 foot (121.9 cm) length. At the lower end the water dropped into a capped, 10 cm (d) ´ 0.3 m (h) cylindrical PVC pipe reservoir. A small impeller type fountain pump in the reservoir pumped the water through tubing back into the upper end of the trough (Figure 1(b) and Figure 1(c)). Each trough was equipped with a 4 ft (1.22 m) shop light with two 40 W white fluorescent lights at a height of 25 cm above the trough. Preliminary experiments showed that aeration did not afford any greater growth as the surface to volume ratio was high, therefore, aeration was not used during these

Figure 1. Filter baffle with algae growth (a); Bench-scale trough system with algae covered filter baffles (b); and General configuration of trough system with reservoir (c).
experiments.
Chlorella vulgaris stock cultures were grown in two 30-gal (113.6 L) tanks (plastic barrels) each with two 15 W fluorescent bulbs inside clear acrylic sleeves for internal lighting. A motorized paddle mixed the suspension at approximately 60 rpm. Algae were aerated with air using aquarium air stones and fed with a standard algae F2 nutrient medium [26] . For each experiment algae were adjusted to an absorbance of 0.30 at 680 nm prior to inoculation of troughs. Nine liters of the algae solution were transferred to each trough and recirculating pumps turned on. The liquid was recirculated for three days prior to commencing the experiment at which time essentially all algae were attached to the filters. For purposes of experimental design the nine troughs were divided into three groups of three with one group serving as the control (no algae) and the other two as treatments with variable nutrient concentration.
2.2. Determination of Flow Rate
The flow rate in each trough was measured as the number of seconds it took to fill a 500 mL graduated cylinder. This was converted to mL/sec flow rate then to m3/sec. The average water depth in the troughs was about 3 inches (0.0762 m) and the troughs were 4 inches wide (0.1016 m) making the cross-sectional area of the water flow 0.007742 m2. From this and the flow rate a velocity (m/sec) was determined using Equation (1).
V = Q/X (1)
where:
Q = flow rate (m3/s);
X = cross-sectional area of flow (m2);
V = velocity of flow (m/sec).
Then based on the length of time the trial was run (4 days) a total linear distance traveled was determined.
2.3. Nutrient Uptake Analysis
After algae had completely attached to the filters, the reservoirs were drained and replaced with water with known concentrations of nutrients. The standard F2 media provides phosphate and nitrate at concentrations of 2.8 ppm and 13 ppm, respectively. In our trials, a low nutrient concentration was established at five times (5×) this standard concentration (14 ppm phosphate and 65 ppm nitrate), and a high nutrient concentration was established at twenty-five times (25×) this standard concentration (70 ppm phosphate and 325 ppm nitrate). Low and high treatments were performed in triplicate. The water was recirculated for 4 days. On day four, 50 mL samples were collected from each trough. Samples were filtered and prepared for ion chromatograph (IC) analysis (Dionex ICS-3000 ion chromatography system using Whatman Syringeless filters (0.2 um pore size)). A two-tailed unpaired t-test was used to test the significance of the results, with a P value of less than 0.05 indicating a significant difference.
Using percent removal, flow rate and distance traveled an approximation of percent removal of nutrients from a given solution volume over a given distance of trough system could be estimated.
2.4. Pharmaceutical Removal Analysis
One of the goals of this study was to develop a system that is also effective at removing pharmaceuticals from wastewater. 17ß-Estradiol (E2) was used for these experiments since it is an important contaminant in municipal wastewater and a commercial quantitative assay was available (Cayman Chemical, Estradiol EIA Kit). A solution with an initial concentration of 5000 ng/L E2 was introduced into the trough system (n = 3/treatment) and the water was recirculated for 2 days at a flow rate of 1.5 L/min. Treatments included 1) baffles with no algae and no aeration, 2) baffles covered with algae and with no aeration and 3) algae covered baffles and aerated with CO2. On day 0 (1 hr post introduction), 1 and 2, 1 L samples of the trough water were collected, vacuum filtered, and concentrated by C18 solid phase extraction columns (Agilent ABS Elut-NEXUS, 500 mg 12 mL) eluted with 5 mL dichloromethane at a rate of 2 mL/min. Extracts were dried in a CentriVap (Labconco) and resuspended in 10% methanol. Samples were assayed for E2 in duplicate following the Cayman E2 EAI kit protocol, the plate was read for absorbance at 405 nm wavelength. Absorbance was plotted as %B/B0 vs log[E2 pg/mL] and results of the assay reported as ng/mL E2. Statistical testing was done as with nutrients.
2.5. Algal Biomass Quantification
The third and ninth filters from the inlet of each trough (to represent the upper and lower ends of the troughs) were removed and weighed, then dried and reweighed. Subtracting the weight of the baffle from each resulted in wet and dry weights of algae biomass produced. Measurements were taken after two and five weeks of growth in the systems. All troughs in these trials were grown under the low nutrient regime of 14 ppm phosphate and 65 ppm nitrate.
3. Results
3.1. Nutrient Uptake
Figure 2 illustrates that nitrate removal was significant in the trough systems over a four day period for both the high and low nitrate solution concentrations. The mean concentration of the high concentration trials after 4 days were significantly reduced to 199 ± 34 ppm (p < 0.0001, n = 9). For the low concentration trials, after 4 days the nitrate concentration was significantly reduced to 39 ± 6 ppm (p < 0.0001, n =9).
Removal of phosphate was also significant for both high (p < 0.0029, n = 3) and low (p = 0.0027, n = 7) phosphate solution concentrations in the algae trough systems over four days of circulation (Figure 3).
The mean concentration of phosphate in the high and low concentration trials after 4 days was 25 ± 4.2 ppm, and 9.0 ± 2.7 ppm, respectively.
Overall, removal of nitrate and phosphate regardless of initial concentration was on average 39.9 and 43.2 percent respectively, but the percent removal of nitrate and phosphate was not significantly different (p = 0.6433, df = 20) (Figure 4).
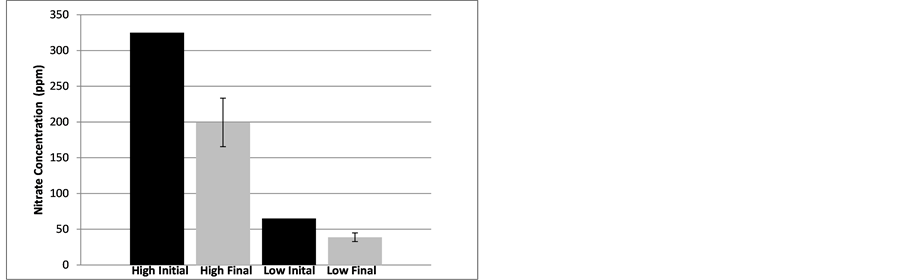
Figure 2. Initial and mean (with standard deviation) final concentrations) of nitrate (ppm) in trough systems with a high initial concentration and a low initial concentration after four days of flow-through treatment.

Figure 3. Initial and mean (with standard deviation) final concentrations of phosphate (ppm) in trough systems with a high initial concentration and a low initial concentration after four days of flow-through treatment.
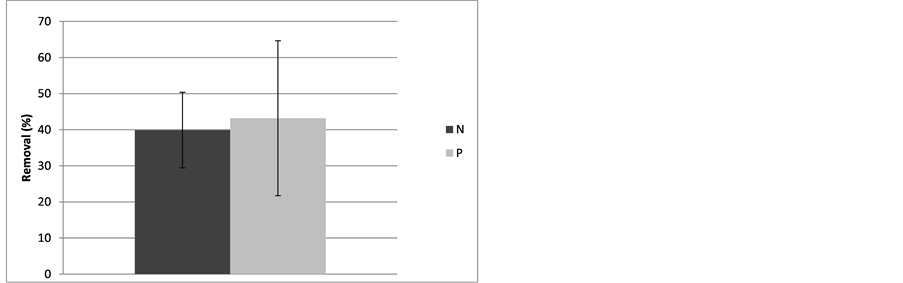
Figure 4. Mean (with standard deviation) percent reductions of concentrations of phosphate (P) and nitrate (N) in trough systems after four days of flow-through treatment (p = 0.6433, df = 20).
3.2. Flow Rate and Rate of Nutrient Removal
On average the water depth in the troughs was about 3.0 inches (0.076 m) and the width of the trough was 4.0 inches (0.10 m) creating a cross-sectional flow area of 12 in2 (0.0077 m2). The empirically measured average flow rate for the nitrate trials was 2.5 ´ 10−5 m3/sec (1.5 L/min) and 2.4 ´ 10−5 m3/sec (1.5 L/min) for the phosphate trials. Using Equation (1) gives an average velocity of 3.2 ´ 10−3 m/s for both the nitrate and phosphate trials. For each trial Equation (1) and time of trial (4 days) was used to compute a distance traveled by the volume of water. Flow rates were not identical in each trough, but there was not a significant difference between distances traveled by the water volume through the trough systems of the different trials over the four day period (p = 0.7886, df = 17).
In general it can be said that about 1090 meters of a trough system, as used in the experimental trials (eleven baffles per four feet (121.9 cm)), can treat a flow of 1.5 liters/min and remove from 30% to 50% of nitrate and 22% to 65% of phosphate (Figure 4).
There was not enough data to confirm whether a greater length of travel of the wastewater volume would remove a higher percentage of nutrients. However, it would be anticipated that the longer the wastewater is in contact with the algae the higher the nutrient removal would be.
3.3. Pharmaceutical Removal
A trial E2 removal study in the trough systems was conducted and indicated a potential for high removal and a promising future for pharmaceutical removal in these systems (Figure 5). After only 1 hr of circulation E2 levels were greatly reduced from the initial 5000 ng/L concentration, presumably due to adsorption to the trough, algae, and baffles. The control group showed a large reduction in E2 between Day 0 and Day 1 (67%), a 10% reduction between Day 1 and 2, and a mean overall reduction of 71% by Day 2. The Day 1 algal treatments showed a further significant reduction in E2 when compared to the Day 0 levels [from 1100 ng to 363 ng E2 (67% reduction; Students t-test p = 0.015) and 398 ng E2 (63% reduction; p = 0.002), in CO2 aerated and non-aerated troughs, respectively]. By Day 2, E2 levels were further significantly reduced to 40 ng (89% reduction, p = 0.008) and 44 ng E2 (89% reduction, p = 0.002) in CO2 aerated and non-aerated troughs, respectively, when compared to Day 1. Therefore, 96% of the E2 was reduced, absorbed or metabolized in both algae treatments after 48 hrs. There were no significant differences in algal troughs aerated with or without CO2. Although not significantly different (p = 0.10, 0.11, 0.06 for Days 1, 2, and 3, respectively), the algal treatments were more efficacious than controls at removing E2.
3.4. Algal Biomass Quantification
Figure 6 shows that there was a significant growth of algae on the baffles after five weeks compared to two weeks in the low nutrient solution (p = 0.0052). By week two a mean (n = 11) of 0.114 grams of algal dry biomass had grown on individual baffles and by week five a mean of 0.249 grams had grown on individual baffles,
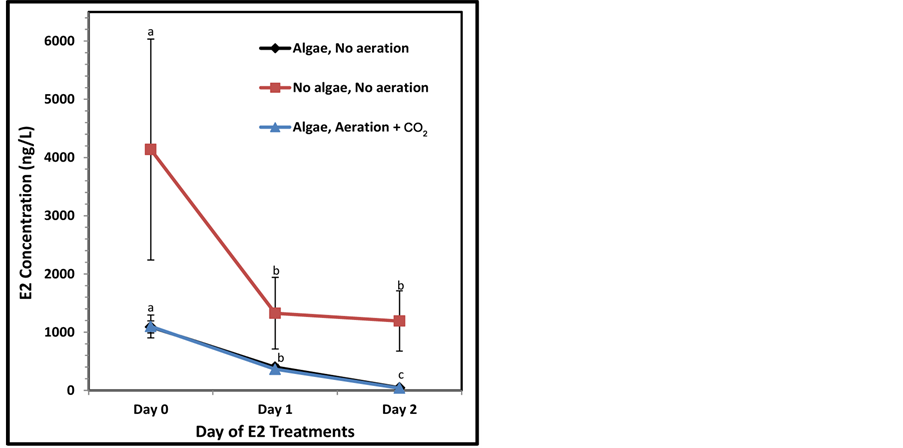
Figure 5. E2 levels (ng/L) over a two day trial period: controls (no algae), algae & no aeration, and algae & CO2 aeration. Letters indicate significant differences between days.
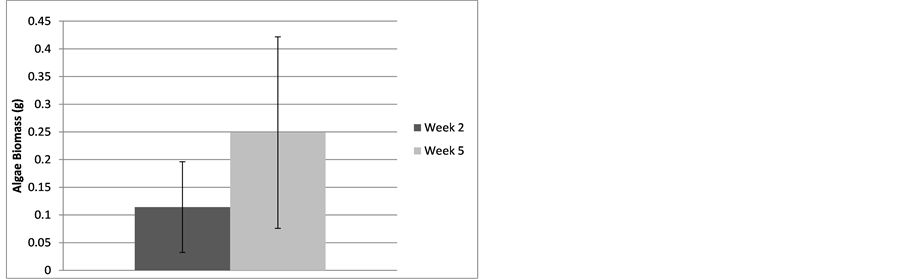
Figure 6. Mean (with standard deviation) dry weight of algae biomass in trough systems after two weeks and five weeks of growth.
though there was a fairly high amount of growth variability from baffle to baffle with some exhibiting relatively little growth.
4. Discussion and Conclusions
As configured, the bench-scale algae trough system promoted vigorous algae growth on the baffle substrate in a nutrient solution (Figure 1 and Figure 6), and removed a substantial amount of nutrients from nutrient solutions at both high and low concentrations (Figure 2 and Figure 3). Removal efficiencies for nutrients averaged 40 to 43 percent (Figure 4).1
In addition, the trials involving estrogen demonstrated the potential for significant removal of pharmaceuticals (Figure 5). Others have determined that adsorption of estrogens to the cell walls of algae and/or experimental vessels does occur [23] [27] , but the rates of estrogen removal by algae specific processes in constructed wetland mesocosms ranged from 42%, 24%, 55% (estrone (E1), E2, EE2, (ethynylestradiol), respectively) with Spirogyra [27] and 100% of the unbound ~30 ng/L E1 was removed from media in a separate experiment after 72 hrs. Our results also indicate that troughs were capable of removing E2 more efficiently between the 24 hr and 48 hr samplings in the presence of algae (89% removal in algal treatments compared to 10% in the control troughs). This small contribution to E2 removal could be explained by a bacterial/bluegreen algal biofilm that colonized the control troughs. Using the algae Selenatrum capricornutum, it was determined that estrogens are removed principally by glucosylation biotransformation with rates as high as 30% transformation of EE2 in 36 hrs [23] .
It is worth noting that when choosing an algal culture to use for bioremediation, one should be cautious because some algae and cyanobacteria have been reported to produce their own phytoestrogens [28] and therefore could contribute to the very problem which they are employed to resolve.
Based on a mean biomass production of 249 mg per baffle at five weeks (Figure 6) and a baffle area of 99 cm2, we can assume a potential biomass production rate of 0.503 mg/cm2/week.
In order to extrapolate results from the bench-scale to a pilot-scale system it is hoped that by using percent nutrient removal and distance traveled, a removal rate of percent/meter can be estimated based on a given flow velocity. The goal is to maximize velocity (flow rate) and removal rate so that the most volume of water can be treated sufficiently in the shortest distance. It is assumed that a slower flow rate will tend to enhance the removal rate for a given volume over a given distance, permitting a single pass system to be shorter and thus less expensive to construct and maintain. However, a slow flow rate would reduce the total amount of water that could be treated over time. Therefore, a curve of velocity versus removal rate needs to be determined so the optimal flow rate for a given removal need can be met, taking into account maximizing flow rate while minimizing trough length and expense.
In order to create a meaningful velocity versus removal rate relationship, trials with the same concentration at different velocities need to be performed. The different velocities would determine the length of the trial period so that travel distances of the solutions would be equalized.
In our recirculating system, nine liters went through the equivalent of 9836 baffles in four days (Equation (2)).
 (2)
(2)
If the baffles were spaced 0.3 m apart, the trough would have to be 2951 m long. If they were spaced 0.1 m apart then the trough would be 984 meters long, and at a velocity of 0.0033 m/s it would take the wastewater 3.45 days to pass through the system (Equation (3)).
 (3)
(3)
In addition, since each baffle was 99 cm2 and there were 9836 baffles, it took a baffle area of 973,764 cm2 to treat 9 liters. To treat 1000 gallons (3785.4 L) it would take over 4 × 108 cm2 (Equation (4)) or about 40,000 m2 of baffle area which would require 1000 meter of trough with two meters by two-meter baffles with baffles every 0.1 meter (Equation (5)).
 (4)
(4)
 (5)
(5)
If we assume the growth rate of 0.503 mg/cm2/week then the system could produce up to 201 kg algae per week or 10.4 Mg per year. If we assume a very conservative 20 percent lipid content from the algae after extraction [29] and a 70 percent conversion of the lipid to biodiesel and a biodiesel density of 0.875 g/mL [30] , then a rough estimate of the amount of biodiesel that could be produced by such a system per year is 1674 liters. At current market prices in the US of $3.50 to $3.85 per gallon ($0.92 to $1.02 per liter) [31] , the biodiesel produced would have a market value of $1540 to $1707. Besides biodiesel production, algal biomass has many other potential and more profitable uses on the farm, such as a high protein feed supplement for livestock, a source of bio-fertilizer, and a feedstock for both anaerobic digestion and pyrolysis, and direct combustion [32] .
Based on our experimental trials, it can be assumed that about 1090 meters of a trough system (eleven baffles per four feet (121.9 cm)) can treat a flow of 1.5 liters/min and remove from 30 to 50 percent of nitrate and 22 to 65 percent of phosphate (Figure 4).
Acknowledgements
This publication was made possible by USEPA grant (SU83471501). Its contents are solely the responsibility of the grantee and do not necessarily represent the official views of the USEPA. Further, USEPA does not endorse the purchase of any commercial products or services mentioned in the publication.
For their excellent technical assistance we would like to thank Kyle American Horse, Thalia Boozell, Michael Cutshall, Chase Gorowski, Melanie Podbielski and Lauren Wolf.
NOTES
1In these experiments we used an F/2 medium which is nutrient balanced for the needs of algal growth and therefore the removal rates we observed for nitrogen and phosphorous were comparable. When dealing with livestock or municipal wastewater this is likely to not be exactly the case and removal of one nutrient will likely limit removal of the other.