Implementation of GIS and Geographic RDBMS Prototype for Water Resources Management. Zeuss-Koutine Basin (South of Tunisia) ()
1. Introduction
Water is an essential element for industrial, agricultural and tourist development; however, it is becoming increasingly rare, overexploited, unevenly distributed and more polluted.
Many studies and models have been proposed with the objective to evaluate or assess and overcome these problems by provisional or sustainable order.
This study tends to propose some water management support using GIS tools by data manipulations and with a practical solutions and recommendations. To reach this aim, a development and an implementation of a relational database and a GIS operational for effective and sustainable planning and management of Zeuss-Koutine groundwater will be done.
For a detailed geological study, an interaction of the aquifer and an exchange between aquifers, seawater intrusion and recharge are quite necessary.
This work involves field campaign (work), geological section, qualitative analysis (piezometric, salinity, geochemistry), quantitative one (flow rate and operating), and determination of the geometric extension of the reservoir.
The use of geographic information systems (GIS) for spatial hydrologic data analysis has provided many benefits for water resources permitting and design. Indeed, different techniques are used such as spatial analysis, and interpolation by developing the DEM and the extraction of these derivatives, we have provided new supports and new information planes responding effectively to our needs.
All these attributes and spatial information were allowed into Geographic Relational DataBase Management System (RDBMS), pertinent non-redundant and easily exploitable allowing a better water resources management.
2. Methodology
A Geographic Information System (GIS) is a dynamic information tool to store, organize and spatialize data in a comprehensive manner, persistent and with less redundancy.
The geographic information systems (GIS) implementation process starts with the initial decision to use a GIS [1], proceeds through system selection, information collection, and classification data in two formats: spatial and attribute format, acquisition and processing installation, training and up to database development and product generation.
This system has demonstrated its simplicity of use and its effectiveness in other works for the management of water resources; that is why we have chose it to do our current study. The realization of the “Zeuss-Koutine” and “GIS” requires the different stages below (Figure 1).
2.1. Attributes Data Collections and Manipulation
Geological, hydrological and hydrogeological information’s monitored from previous studies that have been interested in the region of Zeuss-Koutine. It is also based on reports available for drilling DGRE, SONEDE (Tunisian institutions) [2].
All attribute data are classified in the following Table 1.
Then, we have to choose a Relational Database Management system to organize it. A Relational Geographic Database Management System RGDBMS is a software application designed to organize the efficient and effective storage and access of water resources data into a relational database comprises a set of tables, each a twodimensional list (or array) of records containing attributes about the objects under study.
In the first, conception of the geodatabase was elaborated and modeling by PowerAMC software; there are three principal steps of modeling attribute data in RDBMS:
• Conceptual Communication Model (CCM)
• Conceptual Database Model (CDM)
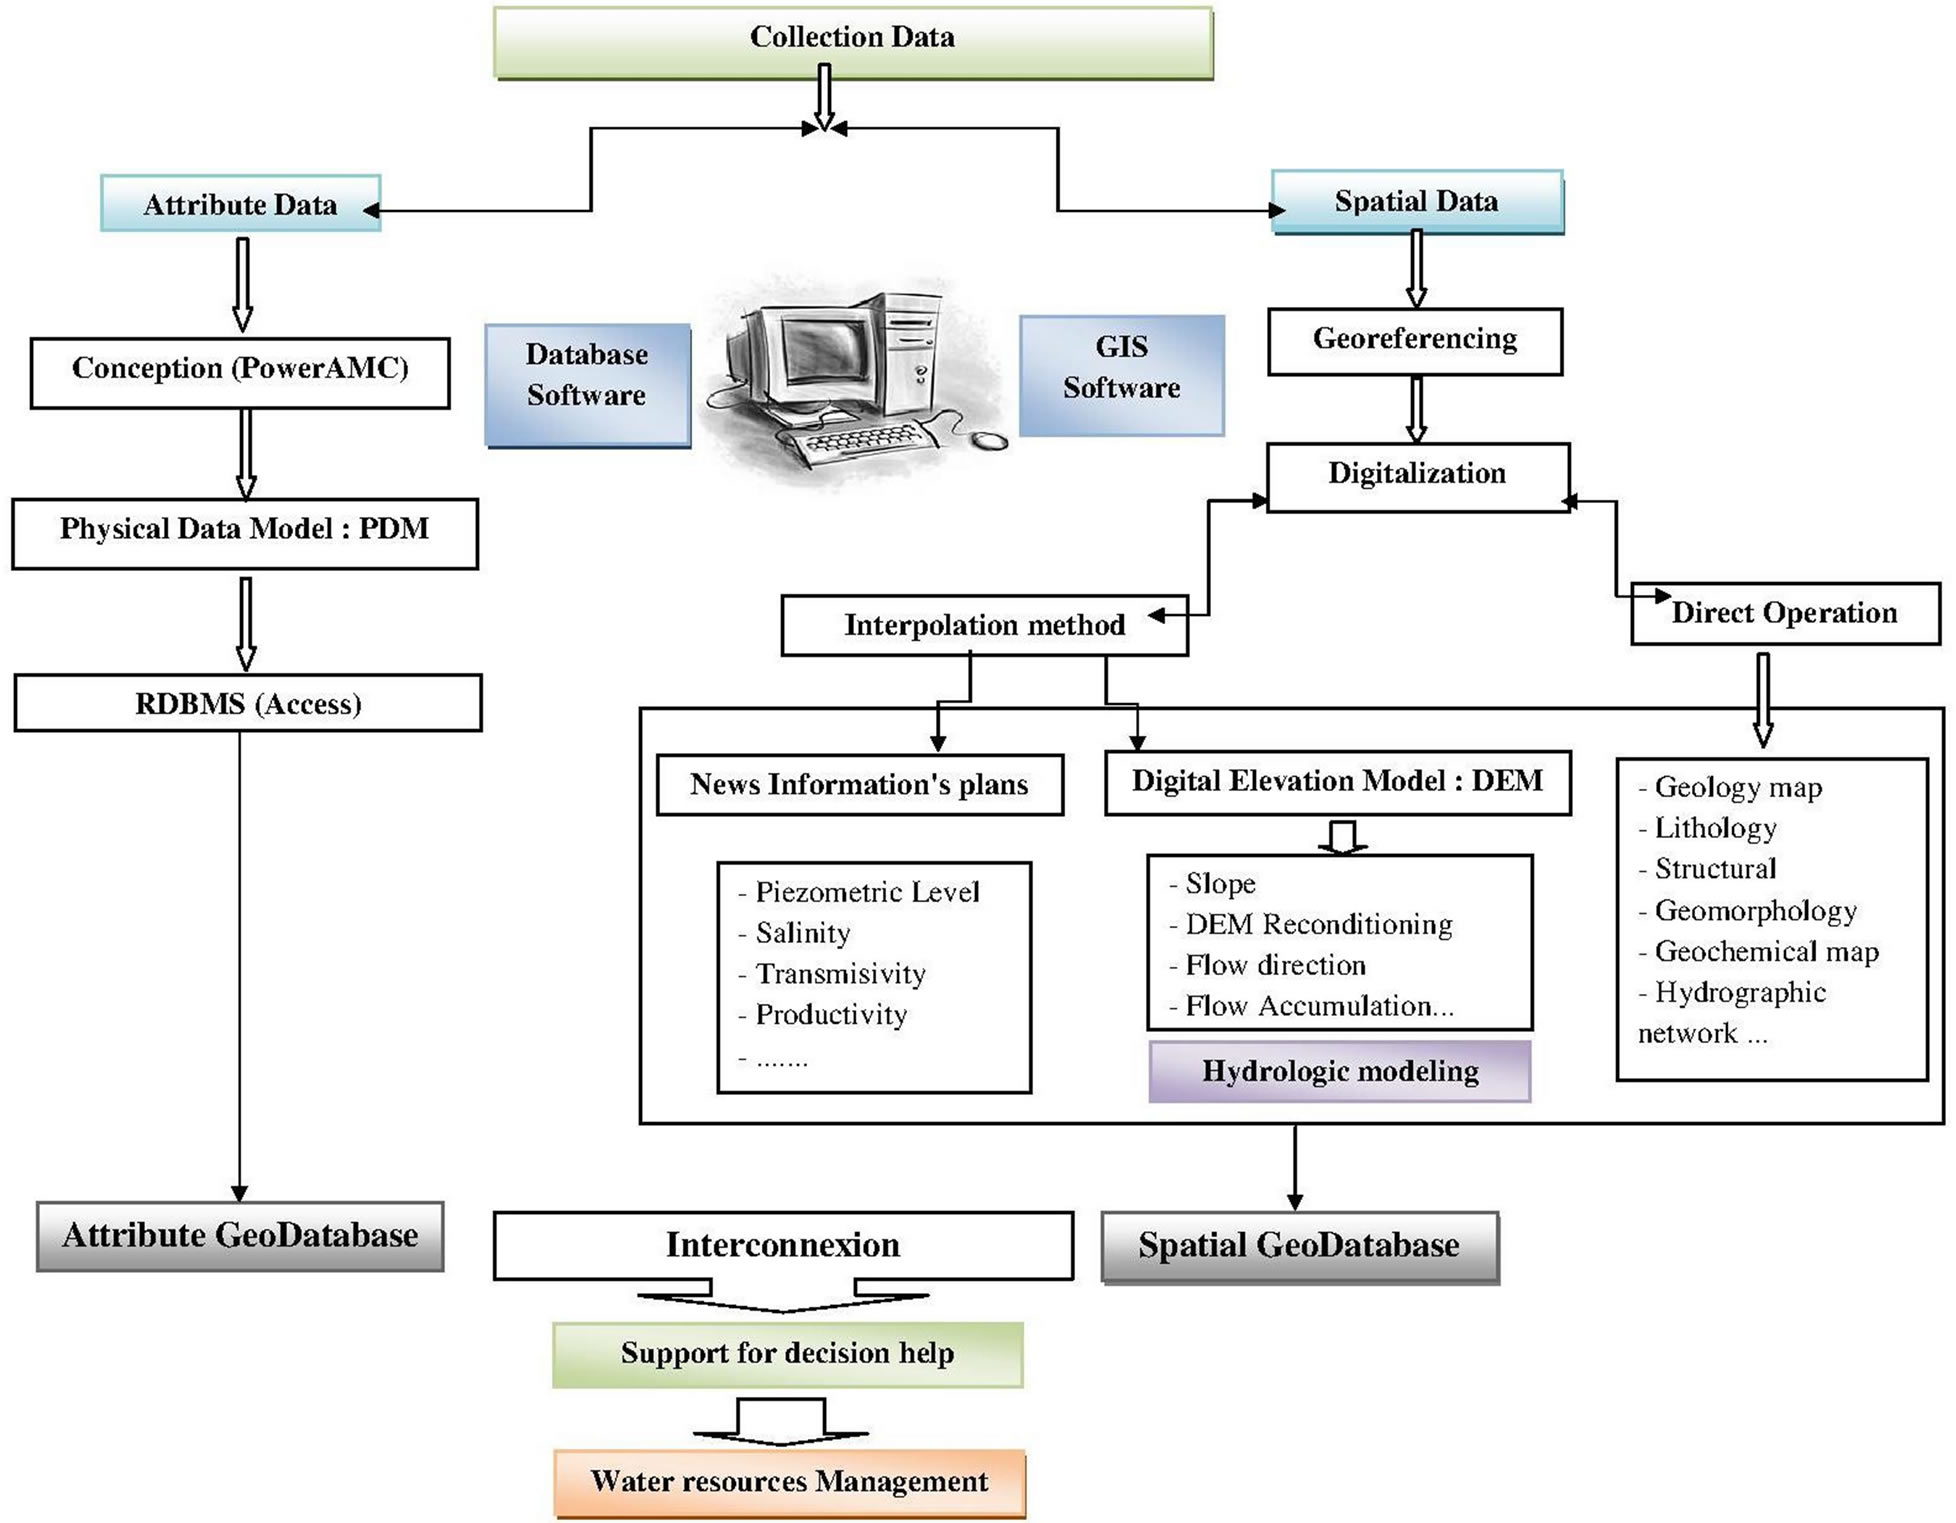
Figure 1. Chart showing the steps followed in this study.
• Physical Database Model (PDM)
In the second step, the PDM generated will be allowed into Access Windows software.
2.2. Georeferencing
Organization of spatial data is beginning with georeferencing. The georeferencing describes the process of locating an entity in “real world” coordinates. It consists of establishing a mathematical relationship between coordinates taken from a planar map (inches or millimeters) and real coordinates (geographic).
This step is directly related to the type of map projection. In our case we chose the projection UTM (Universal Transverse Mercator Zone 32).
2.3. Digitalization and Topology
After georeferencing, the digitization of different topographic and geologic maps of the study area was made. The study sector covers four maps (1/100,000) of Mareth, Ajim, Matmata and Medenine; creating vectors layers was done using a digital table with the modules Arc Edit of Arc Info which transforms the spatial entities defined previously in vector format (X, Y).
2.4. Interpolation
Interpolation is a way of generating information to points in space not surveyed; it is the largest operation in the production of Digital Elevation Models. It identifies, after a series of known values, the estimation of additional data in areas with no samples [3]. The use of ordinary kriging, in soil science and hydrology, is common and widely accepted [4].
The principal interpolation techniques are the following:
§ The krigeage
§ IDW (Inverse Distance Weighted)
§ Spline The interpolation spline method is suitable for many applications. It consists of passing a line through the points of the neighborhood and minimizes surface curvature (mathematical function surface equation). The neighborhood is defined by the (n) nearest points.
In this study, we use this technique to develop maps of salinity, piezometry and derived maps from the Digital Elevation Model DEM used essentially for hydrologic modeling of Zeuss-Koutine basin.
2.5. Classification and Spatial Analysis
In the last step, classification is made by color or by any descriptive criteria (symbol) [5]; it’s a critical step for better displays of the spatial distribution of hydrogeologic parameters like the piezometric evolution, salinity and geochemical elements. New information plans, histograms, statistical curves can be made after the spatial analysis and cross covers which depends on determined criteria, replicating the supports for good quantitative [6], qualitative, and geostatistical interpretations for resource treated water.
During scanning in Arc Info, tables were created automatically; and others have also generated manually.
2.6. DEM and These Derivatives
For hydrologic modeling and hydrology interpretation of Zeuss-Koutine, a Digital Elevation Model was created in ArcGIS using a 3D model and analyst in Surfer 8.0. In reality, DEM is a mathematical representation of altimetry terrain [7]. Elevations at all points are calculated using an interpolation algorithm [8]. It allows creating thematic maps iso-value cards, three-dimensional views, calculation of volumes and surfaces [9].
DEM data and DEM derivatives are used to define basin boundaries, flow characteristics and subtract topographic parameters (slope, exposition...).
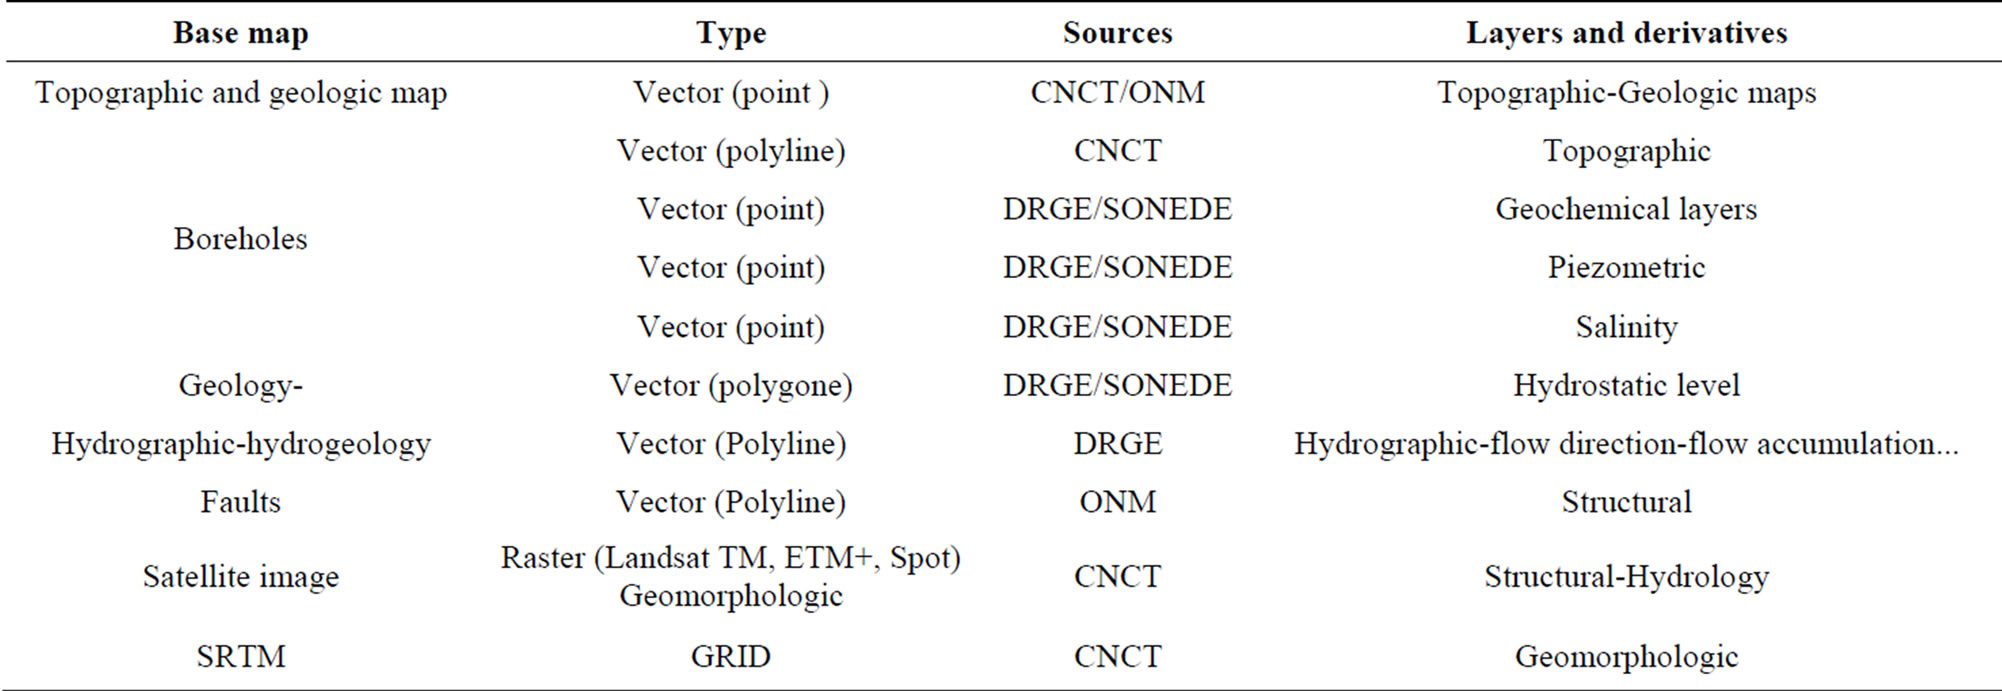
Table 1. Attributes data collections.
3. Results and Interpretation
3.1. Study Area
The groundwater of Zeuss-Koutine is located in the SouthEast of Tunisia; it is included in the coastal plain of Jeffara in the southern of Gabes. It is located between latitudes of 37˚10' and 37˚50', and longitudes of 8˚50' and 9˚20'. This sector extends in a surface from 920 km2. The Northern boundary is formed by a line joining sebkhet Oum Ezassar and the Henchir Fredj area. The NorthWestern, and South-Eastern limits are represented by reliefs of northern Dahar. The Southern limit is characterized by the reliefs of Tebaga of Medenine until Tadjeras. The South limit of Zeuss-Koutine consists of the fault of Medenine (Figure 2).
The double maritime and continental influence on our area generates a great space-time variability of the temperatures and precipitations. The annual average temperature in this area is of 20˚C, whereas annual average pluviometer is below 200 mm/an.
The annual evapotranspiration in stations of Gabes and Medenine exceeds 1300 mm [9].
The aquifer reserve of the Zeuss-Koutine area belongs to the large grid of aquifer of Jeffara [10].
It is a complex multi-layer composed of four aquifer levels which are ordered from the oldest to the most recent as following [11]:
• Limestones and dolomites of the upper Jurassic
• Limestones and dolomites of Albo-Aptian
• Dolomites and dolomitic limestones of Turonian
• Two units of lower Senonian: the calcareous unit and the marno-gypseous unit.
These various groundwater aquifers (Figure 3) form hydrogeologic multi-layer entity where the relays are ensured by faults and vertical drainage [12]. Ben Baccar in 1982 has estimated the flow of the water pumped to 212 l/s and the minimum average flow sources to 5 l/s when the fictitious continued flow is 350 l/s.
3.2. Modeling of the Semantic Data
The organization of available and attributable diverse database has led us to a preparatory phase of conception [13], which is elaborated by Power AMC application and for the purpose to eliminate errors and redundancies with respect of a defined model, MERISE relational model in our case.
MERISE is a method for structuring data in the form of sets of records or tuples so that relations between different entities and attributes can be used for data access and transformation.
This preliminary phase in this study will be followed by a second phase of database management organized in a database management system under access application.
• 3.2.1. Conceptual Communication Model
• Database dictionary (Figure 4). The unity of the gathered database is regrouped in tables comprised [14] their detailed description (formats, size, and characteristics).
• Definition of the organization; It defines the system and both external and internal elements with what the information flow exchanges in a flow conceptual diagram. As shown in Figure 5, the elaboration princeples of table organization, besides internal and external actors like the necessary information flow used in our case.
• Context diagram: The context diagram is used to represent the information flow between the organization and external actors according to a standard representation in which every item has its own noun.
• Conceptual flow diagram; this diagram allows the breakdown of the organization in a series of internal actors.
3.2.2. Conceptual Database Model: CDM
The elaboration of CDM of relational type requires the definition of the following parameters:
• Definition of tables (entities) and associations: during this work, we have formed 16 tables (localization, stratum, watersheds, piezometers, etc.) where 4 items represent the graphics coverings (topographical, geological, hydro geological, and tectonic) and 18 relations (associations).
• Primary key and unfamiliar key: we note here that every table must have a key field or identifying (ID) called “primary key”, which is necessary to define the relations and carry out links between varied tables.
• The cardinality: it defines the minimum and maximum number of occurrences of the relation that could exist for every couple “entity (table)—association” (Figure 6).
Once all tables and associations are elaborated, we will have our Conceptual Database Model (CDM) (Figure 7).
3.2.3. Physical Database Model: PDM
After having conceived our Conceptual Database Model (CDM), it is now timely(proper, appropriate) to transpose it into a Relational Logic Database Model (LDM) by the application of definite rules, such as Functional Integrity Constraints (FIC) and the one of identifiers’ migration from one item to another. This is for the purpose to define the tables of optimum manner in order to limit (reduce) redundancy and avoid stocking anomalies starting from update. This step leads to a Database Physic Model PDM, which is consisted of 24 tables.
3.2.4. RMDBS
The validity of this model is verified by SQL Modeler Software, which will be introduced in succession (later) within a Relational Management Data Base System RMDBS under Access [15]. The implementation of PDM
under access is followed by the creation of requests and forms that meet the needs of users and investors for the management of water resources.
3.3. Geological Information
Georeferencing and digitization of geological and topographic base maps 1/50,000 of Medenine Ajim, Matmata and Mareth in GIS software, have allowed us to get geological, geomorphological, structural and hydrological idea for the study area (Figure 8).
3.3.1. Stratigraphic
From the geological and lithological maps of the basin of Zeuss-Koutine, obtained by digitalization and the fusion of several geological sheets, we can describe the leveling facies of the study area [16].
The Paleozoic is marked by the outcrop of the upper Permian which appears only on the Jebel Tebaga of Medenine. This level is marine, argillaceous at the base, carbonated at the top. It constitutes the substratum of the aquifer formations located at the west of the fault of
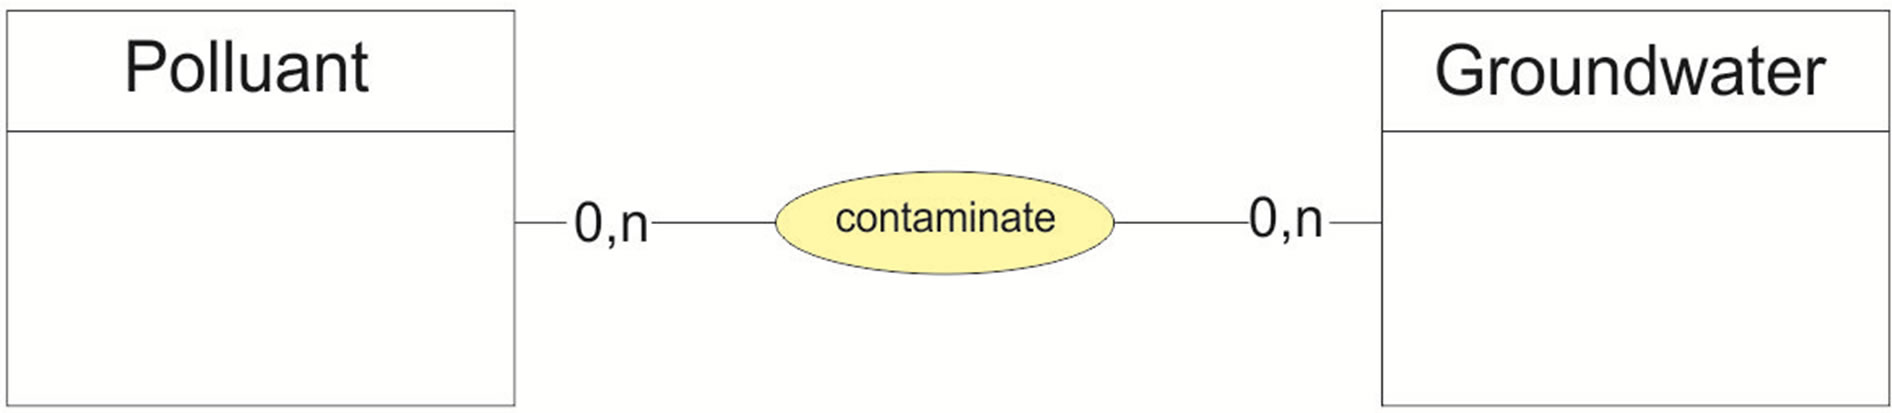
Figure 6. Link between table and association.
Mednine [17].
Triassic levels outcrop are in jebel Rehach in the SouthEast of Jeffara (Figure 8).
The Jurassic in the region of Tadjera at many outcrops around the Jebel Tebaga Mednine, is represented by Liassic grading to Oxfordian terms. It is mainly limestone and dolomite with marly sequence.
Lower Cretaceous formations disappeared completely to the Tebaga Mednine region. The upper Cretaceous is represented by a marine sedimentation which is characterized by the alternation of the dolomite formations and limestone with argilo-marly deposits containing sometimes gypsum [17].
The Mio-Pliocene deposits are absent in the chain of Dahar, cover all the plain of Jeffara, they are discontinuous at the bottom of upper cretaceous (Figure 8).
They are continental deposits, whose characteristic facies is reddish gypsum clays (Zarzis formation) [18].
The ancient quaternary Villafranchian-Pleistocene is constituted of a limestone or gypsum crust with pink calcareous concretions [18]. Its thickness varies from 2 to 10 m. while the late Quaternary terrace deposits, alluvial silts and rivers.
3.3.2. Tectonics
1) Faults Three types of faults are scrutinized in the South-east of Tunisia and mentioned by Mamou, A., in 1990.
﹣ Faults of collapse; age post Oligo-Miocene, NW-SE direction for the collapse of Eastern reliefs of Dhar, the most important is the fault of collapse Medenine characterized by its rejection of 1000 m (Figure 8).
﹣ Faults of compression with orthogonal direction to the preceding ones and are responsible for the faults of collapse for the creation of the Horst and Graben structures of Djeffara (Fault of Zerkine, fault of the Graben of Mareth…).
﹣ Post Quaternary faults of readjustment [19]; with small rejections and whose presence is materialized by emergences (faults of the river of Zigzaou, Gabès, Kettana…). They are responsible for the fracturing of the aquifer limestone formations.
2) Discordances The principal discordances are the Sidi Stout discordance where the upper Triassic is discontinuous on the grounds of Lower Triassic and the discordance of Barremo-Aptian and the Albian over the Jurassic one.
3.3.3. Geomorphology
The DEM which was carried out under surfer shows the
morphology and the principal structures which appear in the study area as following:
The monoclinal of Jebel Tebaga of Medenine is characterized by the outcrops of the upper Permian, with EastWest direction and a plunging 60 to the South [20].
The Dahar presents increasingly young series of Jurassic then lower Cretaceous.
The coastal plain of Jeffara which constitutes the result
of the collapse of the east monocline part of Dahar.
This collapse is caused by a grid of normal faults of NW-SE direction; the most significant one is the fault of Medenine (Figure 8).
This structure is the (Tadjera) tad era anticline collapsed in the middle and having a NW-SE direction. Jurassic series is discordant to the Lower to Middle Triassic [21].
3.4. Surface and Subsurface Water Management
3.4.1. Hydrographical Study
Hydrographic network map (Figure 9) showed that the area of Zeuss Koutine is crossed by three principal rivers which go down from Dahar to the coast the Zigzaou river drain at sea (gulf of Gabès), while the rivers of Zeuss and Koutine-Oum Ezzassar drain in sebkhet Oum Ezzassar [22].
Mapping of network density shows a localized concentration of these networks at the south-eastern part, which can be retained as the best source of charging groundwater (Figure 9).
3.4.2. Hydrogeology
1) System Aquifer geometry The observation of the drillings cuts capturing ZeussKoutine water table confirms the aquifer’s organization into two different hydrogeological compartments divided by the fault of Medenine; in the upstream of this fault, the water table lodges in the Jurassic and locally in the Albo-Aptian.
On the other hand, at the downstream it lodges in the Turonian and the Senonian [23]. At the Northern limit of the watersheds, it is the fault of Mareth that cuts the Senonian of Zeuss-Koutine water table that belongs to the water table of South Gabes. At the South of the watersheds, the fault of Tadjera secures the shift between the Jurassic water table and that of the Triassic. As a result, the two drillings; Koutine 5 (N˚IRH 8736/5) and Koutine 6 (N˚IRH 8737/5) encompassing the Triassic (Figure 9).
2) Water analysis A cover, which locates the points of drillings of the groundwater, was created by the ArcGIS software, and was named “Drillings”, and (delete) then we have applied density application to the hydrographic network which is the object to locate the important zone of recharge. It was noted that Hamra and Berino anticline’s are the best area for the groundwater recharge of ZeussKoutine (Figure 9).
This cover is a type “point” from which we can tackle various information concerning each drilling such as the piezometric level, the static level of the groundwater, the salinity, the dry residue, the temperature, the hydrochimic parameters (Ca2+, Mg2+, Na+, K+,  , Cl−, and
 ) [24,25]. All this information concerning the drillings is introduced in the attribute tables on Excel and on ArcGIS (Table 2).
This last cover can be regarded as basic course from which new covers can be generated using algorithms resulting from the ArcGIS software among these covers [26]; we quote the chart of transmisivity, the charts of the piezometric levels and salinity for each year or for a defined period.
Indeed, during the three years this aquifer posts is considered the lowest piezometric levels. This aquifer is being investigated in the North of the study area which is characterized by a low power, in spite of the supply and by an overexploitation.
3) Piezometric Study (Figure 10)
As above, we suggest making the study of piezometry for each aquifer during the years from 2000 to 2011. These Jurassic aquifer and Albian-Aptian piezometric data have been interpolated and mapped using “ArcGIS”.
4) Transmisivity (T)
The results obtained by interpolation of the transmisivity show a particular spatial distribution marked by a rise in the transmisivity in the central part corresponding to the plain of Jeffara where the mean and low values are around the plain. This Transmisivity varies from 0.2 × 10⁻³ m2/s to 300 × 10−3 m2/s.
Even if this exploitation was reduced during 2008, drillings collecting this aquifer always have high flows of exploitation 72 and 54 l/s respectively for Zeuss 1 (7241/5) and Zeuss1a (7306/5).
Based on the results obtained by correlation between 1982 and 2008 the piezometric evolution and operation on the one hand and the correlation between exploitation and the salinity on the other hand illustrate increasing intensive exploitation of one year to another which results in a proportional increase of dry residue (Figure 10) and (Figure 11).
The study of piezometric in aquifer level revealed a general flow direction with NS trends SSE-NNW and NNE-SSW. It also demonstrated that the Senonian aquifer has the lowest piezometric level because of the overexploitation.
Indeed, it is the Jurassic aquifer which illustrated the most significant piezometric level due to a direct significant feeding from the Triassic aquifer in the South.
5) Water Salinity The values, measured during the geochemical analyses for the study of salinity, related to the dry residue. The study of salinity was done by aquifer for both wet and dry seasons during the two years 2000 and 2011. As shown in Figure 11.
According to the results obtained, we see that the difference between dry season and wet season is not very clear in 2011.
There are the same results deduced for the previous years 2000 and 2003. For some drillings, the dry residue increases from the winter to the summer, in other conditions or cases the opposite takes place.
A perfect agreement is established between the directions of the groundwater flow and the variation of dry residue. The study of salinity by aquifer level showed a total increase up to 2011. It indicates increasing from the South to the North of the groundwater according to the direction of flow.
The salinity of the Jurassic aquifer is the lowest because of its direct feeding in the zones which are close to the surface utilizing from its good karstification, or by waters of the Triassic sandstone less salty. The water of the Senonian aquifer is saltier due to the effect of overexploitation.
3.5. Linkage and Notion of Geo-Coding
The alpha digital data base constituted under Access permit to gather treats, manages, and assures the timelessness of database collected from Zeuss-Koutine water table.
However, this database does not permit from its own to totally respond to preoccupation of decision-makers and local actors of water domain. In this case [27], setting up Geographical Information System (GIS) realized under software GIS for the management of subterranean waters aim at mutualizes and diffuses the information on the subterranean waters, has permitted studying and modeling Zeuss-Koutine watersheds and groundwater table.
A Geographical Information System (GIS) is not operational until the connection between the alpha digital and graphical database is functioning and well established.
It is very interesting to specify the relationship nature that may be carried out between Access and software GIS.
In order to carry out the relation between spatial and tabular database, we have chosen personal Geo Database method, which consists of spatialize data based presented under access: first of all, we export the Corresponding Access chart in software GIS thanks to a relationship of Select Query Language (SQL) type [27], then we join this chart with the software GIS theme in this software. In this type of relationship, if a field or a registration is updating in Access, the update will be reverberated on the joint chart in software GIS and vice versa. The presence of common charts between these two database type is important.
We have chosen in the following to present the example of the relationship between the cover of hydrographic network (under software GIS) and the chart of SURFACE_DISCHARGE (under Access) towards a new attributable chart created under a software GIS and which we have called ID_DISCHARGE, which is the designation of primary key in SURFACE_DISCHARGE chart.
The procedures are successively:
• Establish a connection between all the charts presented under Access and software GIS; assure the geo-coding between the different chart SURFACE_DISCHARGE and the hydrographic network corresponding here by the link with attributed charts and hydro geologic cover. Finally, verify the melting of this column in one by the module under software GIS, which allowed us to make a link between GIS
and the database realized under Access.
• Our data base model is concluded, and we have done the same work for other covers (geologic, topographic, and tectonic) and in addition to fill this model under software GIS by the hydro geologic and geologic database already collected.
• Finally, a user interface under Visual Basic and Map object environment has been created after the realization of specialized requests answering the expected questions and specific forms that will facilitate subsequently the consultation and manipulation of graphic and alpha digital database of our work.
In order to facilitate the display we have create a new buttons with the AVENUE programming, the script is as follows:
• Le script est le suivant:
• 'Script Name hyperlinkscript.ave
• '***************
• theDSN = "bd1" 'an ODBC System Data Source
• theDatabase = "bd1.mdb" 'the Database to connect to
• theUser = ""
• thePassword = ""
• theTbl = "forages" 'the Access Table that you are Querying
• theIDColunm = "forages-ID" 'the Unique ID Column of the Access Table
• theCriteriaFld = "nom_forages" 'the name of the Criteria Field of the themes attribute table
• 'theQuery = Change the SQL statement to return the appropriate fields "[]" from your table in "'*****theQuery*****" below
• '***************
• 'Any number field in an RDBMS that has a width of 9 and a precision of 0 will be represented
• 'in Arcview as a Long field type. Often data in these fields will be represented using scientific
• 'notation. You can display the entire field value by setting the number definition format
• 'with the following code:
• Number.SetDefFormat("d")
• 'Get the active theme in the view.
• theView = av.GetActiveDoc
• theTheme = theView.GetActiveThemes.Get(0)
• 'Return point click on by user.
• p = theView.GetDisplay.ReturnUserPoint
• 'Get the feature that intersect the point.
• FeatureList = theTheme.FindByPoint(p)
• if (FeatureList.count <= 0) then
• msgBox.Info("No feature was selected.","No Selection")
• exit
• end
• 'Blink each record that intersect the point.
• for each f in FeatureList
• theTheme.BlinkRecord(f)
• fld=theTheme.GetFTab.FindField(theCriteriaFld)
• str =theTheme.ReturnValueString (fld.asstring, f)
• rsult=MsgBox.YesNo("Query the Documents relating to """+str+""" and create a new DBTable?", "Run Data Query",True)
• if (rsult=False)then
• exit
• end
• end
• '*****theQuery*****
• 'populate theQuery string with the SQL string
• theQuery = "SELECT [HyperLink] FROM "+theTbl+" WHERE [ProjectArea] Like '%"+ str +"%';"
• '*****theQuery*****
• 'make a new ODBC Connection
• theConn = ODBCConnection.Make(theDSN,theDatabase,theUser,thePassword)
• 'make a new query definition object associated with
• 'the new connection
• theQueryDef = QueryDef.Make(theConn)
• 'apply the query string to the query definition
• theQueryDef.setSQL(theQuery)
• 'Set the KeyTable and the KeyColumn. The key column must have a unique value
• 'for each record that is returned by the query. If you do not specify a
• 'KeyTable or a Keycolumn, then a forward only scrolling DBTable is created.
• theQueryDef.SetKeyTable(theTbl)
• theQueryDef.SetKeyColumn(theTbl+"."+theIDColunm)
• 'make the DBTable from the query definition
• theDBTable = DBTable.Make(theQueryDef)
• 'Make the DBTable the active document
• DBWin = theDBTable.GetWin
• DBWin.Activate
• DBWin.SetTitle("Documents Relative to "+str.quote)
• yourFieldName = ("hyperlink") 'Name of the field that has the name of the hyperlink file
• yourOpenWithProgram =("C:\Program Files\Adobe\Acrobat 6.0\Reader\acrord32.exe")
• 'Path Name of the Executable Program file to open. This needs to be the complete path• 'including the file name and extension of the Program file.
• '***************
• theDBTable = av.GetActiveDoc
• theRow = theDBTable.GetUserRow
• theDBTable.Select
• theQuery = theDBTable.GetQueryDef
• theRSet = theQuery.OpenRecordSet
• theField = theRSet.FindField("hyperlink")
• theLink = {}
• while (theRSet.Next)
• linkName = theRSet.GetValue(theField).Clone
• theLink.Add(linkName)
• end
• theRSet.Close
• theOpenWith = yourOpenWithProgram
• theOpenFile = theLink.Get (theRow).asstring
• if (theOpenFile <> "") then
• 'system.execute("C:\Program Files\Adobe\Acrobat 6.0\Reader\acrord32.exe")
• system.execute(theOpenWith+" "+theOpenFile)
• else
• System.Beep
• msgBox.Info("This record has no document to link to.","Document Not Found")
• end This interface facilitates the exploitation of information plans that permits the decision-makers to have a detailed idea about the studied system, which favors directly a good management of water resources.
4. Discussion
In the first step, the use of GIS technique (Georeferencing, Digitalization, Spatial Analysis, Interpolation, DEM and derivatives...) has allowed us to conclude a detailed geomorphology, geology, hydrology and hydrogeology characteristics of our area of study.
The results obtained by analysis of both existing and new extracted data prove the abundance of the anticline structures in the Northern, Western, and Southern part of the sector, which are the areas of Mareth, Matmata and Tebaga of Medenine’s mountain.
The central and Eastern parts are marked by structures of low altitude which are the plain of Jeffara and the coastal plains of the Golf of Gabes.
The morphometric analysis of the subcatchments reveals the general causes behind the high-intensity floods and high sediment yield, which can be summarized as follows [20].
• The sub-catchment Zeuss-koutine having the largest area has the highest potential to contribute in the runoff at the outlet.
• Also, land use/land cover analysis shows that subcatchment Zeuss-koutine has most of the area covered by open shrub land and bare ground and less forest cover, so it is less resistant to runoff and thus causing erosion.
• Land cover change analysis shows that, although there is less anthropogenic disturbance in the catchment [26], some of this disturbance is along the stream network. So this factor is one of the contributors for erosion and sediment yield.
• The contribution of the peak floods by the two biggest subcatchments zeuss and koutine, subcatchments, at the same time due to nearly equal time of concentration, is the main reason behind the high flood intensity.
The superposition of these data with those of density of hydrographic network and direction of flow [28] give us the direction of surface water area. The predominant direction is from NW to SE and S to E. It enables us to locate the principal areas and sources of recharge of underground aquifer levels.
The topographic map made by digitalization shows that the average altitude of the plain is 150 m. More than 80% of the basins have an altitude lower than 250 m with a uniform slope of 1%. This promotes a high runoff geomorphology.
In the second part of this study, the use of the MERISE method modeling have allowed to store all data required in tables wish constitutes the hydrogeological database [29]. Each table concerns only either punctual (Boreholes, cities...) or linear (hydrographic network...) or polygonal forms (watersheds...).
The main table contains general attributes information of Zeuss-Koutine basin (area, geographic position...).
Another table contains more specific information as quantitative data (Piezometric, Volume, flow...), qualitative data (salinity, hydrochemistry...), geological data and technical characteristics.
The relationships (One-to-One or One-to-many) between those tables are made in using a unique number (identifier “ID-number”).
Furthermore, to ease data encoding, storage and queries construction, dictionaries (chemical parameters, topographic maps, consultant offices, laboratories...) were added as reference tables replacing descriptions by IDnumbers.
To improve the use of the database, several pre-defined queries are included in the project, like geocentric query, query based on the owner, on the topographic map, on the investigated aquifer.
A user-friendly interface (forms) is made to help the encoding and the reading in the database [30].
This georeferenced database is linked to an ArcView GIS project, by spatial and a Standard Query Language (SQL) connection (existing GIS function).
The hydrogeological data stored in the database can be easily updated [31-34] and represented on the hydrogeological map. All points of the maps are linked to the hydrogeological database by their unique number. For this project, a new Avenue extension (BDHydro.avx) has been developed for ArcView GIS.
This allows to query directly and easily the data stored in the access database from the Arc View project [35]. All information about wells, piezometers... (all points) can be visualized by a simple click on one of the element of the map. It is thus possible for the user to shows in the GIS project for example a hydraulic head evolution, exploited volumes, a chemical analysis table, a drill technical and geological log diagram [36].
The use of GIS has grown quickly in groundwater management and research. GIS is now widely used to create digital geographic database, to manipulate and prepare data as input for various model parameters, and to display model output [37]. This hydrogeological mapping program will allow in the near future to meet efficiently the needs for a more considered and effective management of Zeuss-Koutine groundwater thanks to coupling of a Geographical Information System with a complex hydrogeological database [38].
5. Conclusions
In this study, several data-processing tools are employed to develop a GIS prototype and geographic RDBM which include geological, hydrological, and hydro geological data which meet the needs of the users and the organizations.
The geolocalisation, the vectorization, the interpolation, the spatial analysis and the superposition of another database give an appropriate numerical support (geological, lithological, structural charts and hydrographic chart of network) and are easily exploitable and interpretable by managers. New plans were generated, such as the Digital Elevation Model and the derivatives (the slopes map, topographic cuts, hydrographic chart of density and chart of the buffer zone for the analyzed water points).
Thus, providing additional information and tools for decision makers in many fields, such as geology and geomorphology, gives an approximate qualitative and quantitative idea about the water of the study area.
This work also locates the principal sectors of refill, the direction of the flow, the overexploited zones and other exploited areas.
The underground water recharge is made by infiltration on the Jurassic outcrops at the South, those of the Cretaceous in the West and the zones of the Matmata reliefs and by the infiltration of surface waters of hydrographic network.
The Triassic sandstone groundwater constitutes the only external contribution to the Zeuss-Koutine aquifer.
The reliefs of Matmata and the beds of the rivers Zeuss, Zigzaou and Oum Ezassar are the zones of preferential feeding, the areas of Ksar Chrarif and Koutine as well. This fact is due to the proximity of the roof of the groundwater to the surface and the significant karstification of these aquifer formations.
The analysis of this information will help to understand the different stages of the design of various management rules of water resources. Hence, it leads to reliable decisions that meet the requirements of management, execution of drilling, and monitoring resources water table of Zeuss-Koutine.
This model is an interactive and an updated one. Furthermore, it is essential when a modification will be produced. Also, it can be ameliorated by the incorporation of other data, such as satellite images and geophysical applications which can be used to provide additional information for water resources management of the web of Zeuss-Koutine.