Inclusive Economic Growth from Institutional Transition of Educational Centralization: Panel Data Evidence in China’s History Since 1978 to 2008 ()
1. Introduction
Once regarded as a highly equal but poor country during the central planning period before 1978, China had increased disparities nationwide quickly along with miraculous growth since then, according to some observers [1] . This dramatic change is typically viewed as a classic case of regional divergence, which is driven by geographic differentials and preferential policies in favor of coastal regions.
In fact, the institution of purchase certificate only for urban residents in the planned economy implied that China may be unfair enough in personal income owing to discrepant political status of residents, and different regional urbanization levels, especially, among the poorest rural areas and the cities of Beijing, Shanghai and Tianjin, etc.
Obviously, supposing that China could be demonstrated as an overall convergence case instead of divergence in actual regional inequality during the discussed period, the development path of Chinese economy should be re-valued, even if the geographical gap among provincial regions still exists, or even becoming bigger.
Reform for education institution since 1977 has been decisive to change China. In fact, in pursuit of much higher income for avoiding big famines or even state collapse, Science and Technology were jointly considered as “the first productivity” (the corresponding Chinese term was created by Deng Xiaoping, the former powerful actual leader of China) in 1977, and this decision provided a golden opportunity for attracting children in all the different regions to attend schools and colleges, equally. Almost since then, there has been more and more temporary migration including rural labor from inland regions to the coastal regions, while foreign investment came and international trade began to increase in coastal line with incentive policies. In theory, both should exert impacts on a tradeoff of the convergence versus divergence in China.
Unfortunately, most results of divergence with growing and dangerous interregional gaps in literature are just resulted from statistic measurement according to the officially directly-published provincial per capita GDP in history. In explanation, pathetically, the impact from the crucial cause of science with technology intangibly embodied by (timely advanced and spatially equalized) human capital since 1978 has been fatally neglected up to now in Chinese case study.
The openly published provincial per capita GDP widely used in the literature is based on officially-registered provincial populations rather than actual populations adjusted by huge non-permanent migration. By controlling for migration carefully along with using human capital index, investment rate, etc., the present paper will provide clear evidence for provincial interregional convergence with explaining factors contributing to regional growth in China, though there are still or even bigger substantial economic and geographic gaps and individual income inequality.
The investigation here relates to a large empirical literature on convergence and growth using data for per capita GDP in various extensions of the economic growth framework. Barro and Sala-i-Martin [2] [3] tested the property of spatial distributions of GDP per capita and found evidence for regional convergence in USA, Japan, and some European nations. Early studies of regional disparities in China such as Yang [4] , Chen and Fleisher [5] , and Wei [6] suggested regional convergence. Later studies found evidence for regional divergence in China (e.g., Lin et al. [7] ; Lau [8] ; Zhang and Zou [9] ). Many studies on this regional disparity in China showed that it first narrowed and then widened drastically (Chen and Fleisher [5] ; Jian et al. [10] ; Cai et al. [11] ), for reasons such as the coastal geographic advantages and preferential government policies. According to Fleisher et al. [12] , China’s regional gap had almost reached one of the highest degrees in the world.
In this paper, we argue that the new conclusion of the convergence will be earthshaking, and by the way, point out that China’s paradigm is largely driven by human capital institution besides institutional transition in economy from centralization to federalism. Investment in physical capital is important, but it may not be fateful for the Chinese economy, or its return should be based on variation of human capital accumulation, but investment plays a key role in development unconditionally in the Solow model (Solow [13] ). The role of migration in development pushed by differential wages across locations has long been studied in the literature as well (e.g. Harris and Todaro [14] ; Bencivenga and Smith [15] ; Zhang [16] ). The consequence of migration on population growth and development varies among different models. Population growth reduces capital intensity, productivity, and the growth rate of per capita output in the Solow model. However, population growth exerts a positive scale effect on productivity and growth in per capita output when private investment generates spillovers on labor skills (Romer [17] ). The role of human capital formation in development has also been analyzed extensively in the literature (e.g., Mincer [18] ; Lucas [19] ; Mankiw et al. [20] ; Tamura [21] ; Tamura [22] ; Tamura [23] ; Chakraborty [24] ). More empirical researches about the effect of human capital, especially those on China’s economy, will be mentioned in Section 3.2.
What we have done first is to set up a comprehensive data set in person. We use a data set re-excavated from various official reports, which has not been used by others on the same theme, partly because accurately calculating the regional human capital index and others is much arduous. In particular, by considering the enormous non-permanent migration of migrant workers away from rural areas who actually lived in different locations especially in cities of the coastal regions all year round, the rank of provincial actual GDP per capita each year and its growth should be different from what was directly reported by the National Statistics Bureau of China, especially since the 1990s. Controlling for education years of populations in each province, we find interregional convergence in China is driven largely by human capital equalization, on condition that human capital is tested fateful for growth. In fact, there are various factors in institutional transition contributing to human capital convergence or equalization in China: the university entrance examination since 1977, the provincial quotas for university enrollment based on provincial populations rather than income levels, the nationwide compulsory schooling requirements since 1986, and the nationwide training and allocation system of teachers for decades.
Concerning growth of GDP per worker across provinces, provincial population growth including migration has a significant positive effect on growth before entering into a conditional threshold.
Such results above are different from the prediction of the Solow model, but partly consistent with those of new growth models that emphasize the roles of human capital, technological progress and investment spillovers on labor skills as in the Romer Model with the scale effect of population on growth of income per capita. Interestingly, decreasing return phenomenon described in the Solow model is also found in this paper if regional population grows unlimitedly, and it seems to coexist with the Romer Model.
The rest of the paper is organized as follows. Section 2 introduces the model. Section 3 describes the data. Section 4 conducts empirical tests about what may affect the growth of GDP per worker across provinces. The last section provides concluding remarks.
2. The Model
The economy has p regions. Each region has two sectors: agricultural and manufacturing. The agricultural sector uses land
(fixed in each region) and labor
to produce a consumption good
with constant returns to scale to land and labor in region i and year t . The technology varies across regions (location effects or externalities from neighboring regions) and over time (via technological progress). The manufacturing sector uses capital
and labor
to produce a consumption-investment good
with constant returns to scale for capital and effective labor.
There are several hypotheses on the labor skill index. From Solow [13] ,
grows at an exogenous rate g and the economy converges. From Romer [17] ,  allows the regional capital to have external effects on labor skill in this sector, which generates a scale effect of population on endogenous growth and causes convergence to the balanced growth path. Following Lucas [19] ,
  goes through human capital, which causes endogenous growth. When human capital accumulation involves external factors to individuals (such as state funding and teacher qualities), the economy grows and converges according to Tamura ( [21] [22] ). Whether these theories are relevant in the development of China’s economy is an empirical matter.
Migration from region  and sector
  to region
  and sector
  in year t is denoted as
  . Migration in China is mainly from the agricultural to manufacturing sector, given the very low land productivity of farming and land tension with surplus rural labor in China. As China has a nationwide birth control policy since beginning of the sample period, let us assume an equal annual rate of labor force growth n in each region. Regional labor force is equal to
  ,
,
where  and
and  .
.
Migration is driven by seeking higher wages that are equal to marginal products of labor in a competitive economy with labor mobility. When migration occurs from the agriculture to manufacturing sector, degree of farmland tension decreases in the agricultural sector in the home region. Migration may have different effects on productivity and growth potential for the adopted regions, depending on which of the above theories is more relevant. Again, the exact effect of migration on growth and migration is an empirical task.
3. The Data
Data for human capital, the ratio of investment to output, the population growth rate, and per capita GDP in seven representative years for each province of China are given in the Appendix. Data for some proxy variables such as the overall growth rates of regional workers and population are reported as well in the appendix.
Here, we define the actual levels of provincial GDP per capita by using actual provincial populations as denominators, and provincial GDP per worker by using urban employees as denominators. Due to the massive migration in China, the actual sizes of provincial populations are increasingly different from those of the official population data in the Household Registration System (HRS) by the Ministry of Public Security in the concerned period (e.g., NSBC [25] ). However, the directly reported official data of GDP per capita in each province were based on population data from the HRS for many years. This adjustment of actual provincial populations for the calculation of provincial GDP per capita here has important implications for regional convergence as to be shown later.
In addition, the growth of GDP per worker is still without attention, but it needs to be tested for researching the source of efficiency, and for increasing or decreasing returns, and even beta convergence or divergence. This will be discussed in Section 4.
3.1. Source of s-Convergence: Coastal Comparative Advantage and Migrating Workers
Considering the export-oriented growth model in coastal regions of China via foreign direct investment for labor-intensive industries that draw huge migration of cheaper labor from inland regions, Figure 1 depicts an approximately decreasing trend of interregional difference in actual provincial GDP per capita through the coefficient of variation of logarithmic per capita GDP.
Clearly, the coefficient of variation of logarithmic actual provincial GDP per capita decreases from 0.1 to 0.05 in Figure 1, where the series of original provincial GDP per capita are re-calculated by using actual provincial populations that
![]()
Figure 1. Trend of the coefficient of variation of logarithmic GDP per capita.
differ from the directly reported official data1. Since the preferential treatments for coastal regions in China to attract foreign direct investment would seem to produce a powerful divergent force, the declining coefficient of variation of logarithmic provincial GDP per capita appears puzzling.
Interestingly, even if foreign investment with new technology is benefit to regional growth, the convergence may still occur, though it does not always so. In fact, both Guangdong and Fujian in the coastal line in 1978 were poorer than the national average level as they were more exposed to tensions across the Taiwan Strait from the 1950s to the 1970s. The opening up of China to the rest of the world started mainly in the coastal regions including these two provinces, which helps to explain convergence in the 1980s (Yang [4] ). In 1992, the former leader Deng Xiaoping made a famous speech in Guangdong that generated more and more incentive policies for foreign direct investment in the coastal regions. Such investment incentives for coastal regions continued the momentum to attract massive investment and labor for labor-intensive industries in coastal regions to become the world factory. This process created regional divergence in the early 1990s in Figure 1 (e.g. Jian et al. [5] ), no matter what measure of population is used for the calculation of GDP per capita in each province. However, the divergence period is very short as shown in Figure 1.
What causes the actual regional s-convergence in China during the sample period of 1978-2008? There are at least two general factors accounting for convergence in output per capita. One factor is the in- and out-migration of labor. Since the average size of land for peasants is typically very small for low farming productivity in most parts of China, the poor inland provinces may have rising per capita GDP when their rural populations are shrinking via out-migration. As labor-intensive industries may only offer rather limited potentials for further labor productivity growth while the model transition is not easy (except the real estate bubble), per capita GDP in coastal regions may not increase as much as indicated from officially-former published population scale according to the registered data, although that total GDP in coastal regions has been swiftly increasing relative to total GDP in inland regions along with dramatic in-migra- tion. Sooner or later, the actual levels of provincial GDP per capita would probably become convergent, particularly when the nation started to rejuvenate inland development since 2000. There are also diffusing effects such as skill spillovers and remittance from migrants located in coastal regions to inland homes for local investment and consumption that are conducive for the convergence of actual income per capita or GDP per worker in the process of going there and back(e.g., “the Spring Rush”). However, the key factor for interregional convergence in output per capita or GDP per worker may be human capital institution innovation from the central government oppressed by the people. Logically, for poor locations with out-migration, the central government should directly subsidize the local schools, otherwise, the local governments would not like to spend on education to help developed locations with in-migration-They would like to spend more on building roads and help producing more observable products.
3.2. Human Capital and Interregional Convergence
The role of human capital for convergence is widely recognized in the literature from early studies in Barro and Sala-i-Martin [2] , and Mankiw et al. [20] . The cross-country evidence shows that low-income countries can have higher returns on human capital investment than countries with higher incomes, and that human capital investment either resists income divergence across nations or supports convergence (e.g., Qadri and Waheed [27] ). Using long-term data in the U.S., Tamura [22] provides a link between average teacher quality and human capital externalities that are conducive to growth and convergence. A case study in Australia shows that education attainment has a significant permanent, though moderate, effect on the growth rate of per worker output (Paradiso et al. [28] ). It happens that there is a similar case, a case study in China based on the VAR model shows that the IT-derived human capital plays a more important role than labor in economic development from 1995 to 2010(e.g., Li et al. [29] ). Perkins and Rawski points out that the average human capital of China was only at primary school level in 1965, but it had increased to be nearly equivalent to junior high school by 2005 (Perkins and Trawski [30] ), though its growth rate was different among provincial regions.
Provincial human capital is also treated as an explanatory factor for the actual convergence across provinces in China here. The original provincial data of human capital indicated by average education years for each representative year are from the census by the National Statistics Bureau of China since 1978, etc. (NSBC, [31] [32] ), but recalculated by the author(Appendixes). The computed spatial coefficient of variation of provincial average education years as a proxy for human capital here is declining over time as shown in Figure 2(a).
Using Moran’s I index as an alternative measure, Figure 2(b) also indicates that the spatial human capital had been equalized from 1978 to 2008, except occasional retrogression in the process of education equalization. For example, the spatial interaction of provincial human capital, indexed by Moran’s I of provincial average education years, happened to increase in the early 1990s. This may help to explain the short-term divergence of actual GDP per capita during that same period.
Several factors undetected in this field helped to increase human capital and equalize its distribution in China as follows. First, the College Entrance Examination System (Gao-Kao, in Chinese) resumed in 1977, which has still been the
![]() (a)
(a)![]() (b)
(b)
Figure 2. (a) Trend of the coefficient of variation of average educated years; (b) Trend of Moran’s I of human capital of average educated years.
most equal policy in current China, helps many poor students from poor provinces go to colleges without fees in the early stage and with relatively low tuition thereafter. Second, the central government allocates quotas of college entrance qualification to provinces according to the sizes of provincial populations instead of economic levels or other indicators such as absolute total scores since 19772. The scale-expanding policy for enrollment by adding new or private schools since 1999 strengthened the process of equalizing education among provinces3. The compulsory education institution was formally launched nationwide since 1986, which further helps the equalization process of education. In addition, China has established a nationwide teacher training and allocation system, and provides similar incomes for teachers across provinces for decades. Moreover, poor regions also benefit from the Hope Projects for founding new rural elementary schools donated by wealthy people over time4. Such institutional factors for equal formation of human capital in provinces of China strengthen human capital as an explanatory variable in the estimation of the growth of GDP per capita or per worker.
4. Estimation for b -Convergence with Controlling Variables
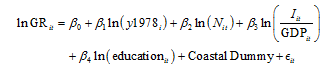 (1)
(1)
Equation (1) is the basic model, and the denotations of the variables are stated in 4.1. Equation (2) is another form of Equation (1), where the time-fixed effects are to be tested for the panel data, and T1,...,T7 for the representative years denote variable time-fixed intercepts.
 (2)
(2)
4.1. Notes to the Estimation
For the Equation (1), GRit denotes the growth rate of GDP per worker or GDP per capita in the reported models in Table 1 or Table 2, and y1978i ,denotes the corresponding initial GDP/worker or GDP per capita. Because we focus to find the source of efficiency improvement, we select the regional original GDP/ worker and GDP per capita in 1978 respectively as initial value at the first step. However, the GDP per capita will be finally selected as a more adequate initial
![]()
Table 1. Results for two different explained variables.
Note: 1. the sample number is 203. 2. Panel data for Ln(education), Ln(Investment rate) and Ln(N) are from provincial data for seven representative years since 1978 in this table. 3. ***, **, and * denotes 1%, 5% and 10% of confidence level respectively for null hypothesis, the same below.
variable (Table 2 and Table 3).
Nit is used as an index of population growth rate for the seven representative years(N = n + 0.06, which is just enough to let the regional lowest negative growth rate become greater than 0, to avoid vast data loss for taking the logarithm of regional population growth rate of n), but sometimes it is replaced by alternative indexes, such as the overall growth rate of regional population (1982-2008) as proxy, where the actual population instead of traditional registered population is used; or growth of regional urban workers (1978-2008) as proxy, where the number of urban employees in each provincial region is used to present the quantity of workers.
The investment rate, ![]() , human capital level, educationit, in seven
, human capital level, educationit, in seven
![]()
Table 2. Results from selected alternative explanatory variables.
Note: 1. The sample number is 203; 2. In FGLS, the intercept term is not backed to its original form; 3. the proxy of population growth for the representative years is the overall growth rates of regional population since 1982 to2008, and the data for the overall growth rates of workers is calculated from original data of urban workers in 1978 and 2008, also see the Appendix. All the data is from the National Bureau of Statistics.
representative years, and the coastal dummy (1, otherwise, 0) are as other main explaining or controlling variables. The method of Least Square Dummy Variable (LSDV) for time-fixed effects is used for the panel data set, but others such as pooled OLS, Feasible Generalized Least Square (FGLS) such as in Table 2 and Table 3, and even Hausman Test are used for comparing, when they are much necessary as reference objects.
As the first step, for simplicity, only the result of LSDV model is reported, and
![]()
Table 3. Models after the square term of overall growth of workers or population is added explained variable: the growth of GDP/worker.
Note: (1) The sample number is 203. (2) Corresponding p-values are shown in brackets.
the initial GDP/worker in 1978 is employed to correspond to its overall growth rate since 1978 to 2008 in Model 1, and the initial GDP per capita in 1978 is employed to the growth rate of GDP per capita in Model 2 (see Table 1).
4.2. Discussion for the Preliminary Results from Table 1
1) It is clear that the economy has an obvious β-convergence, while the coefficient of the initial GDP per capital or GDP/worker in 1978 is always significantly negative to their growth rate respectively in all the selected models.
2) Human capital and the coastal dummy always exert the regional growth rate and, human capital must be helpful for the actual provincial convergence on the condition that there is a spatial equalization process in enhancing human capital level (Figure 2(a) and Figure 2(b)). The growth of coastal regions may seemingly lead to a divergence result, but it miraculously accelerates a convergence result. There are at least three reasons: the first one should be the human capital, because the growing human capital has been found equalized, and it is tentatively approved as the most general factor to impact on the growth rate of GDP/worker or GDP per capita. The power for convergence is so strong that it cuts a potential divergent trend down; the second one is that some of coastal regions were obviously poorer than the average level in the initial year of 1978, such as “now-much-developed” Guangdong province; the third one should be domestic in-and out-migration, even if growth of the local GDP in underdeveloped regions is not fast enough, its growth speed of actual GDP per capita or per worker will be much bigger if a lot of labor forces periodically migrate out to other regions to make money, and remit money to their home regions for investment and consumption.
3) One result is uncertain. The investment rate is negative to the growth of GDP per worker, but obscure for growth of GDP per capita in the alternative model 2.
Unfortunately, though the initial GDP/worker in 1978 is crucial for assessment on efficiency of workers directly, it is biased in some extent while the farmers in a large ratio to population who also contributed to GDP are excluded from the statistic which is only for urban workers. For example, a few regions with much low urbanization rate in 1978 eccentrically have a relatively higher original GDP/worker, so the initial disparity of GDP/worker among regions may be underestimated. For improvement, the original GDP per capita in 1978 will be “borrowed” as a proxy variable in and after Model 3, which is more closed to the theory above (Table 2 and Table 3).
Typically, there are three methods for dealing with the panel data, pooled OLS, LSDV, and FGLS. However, pooled OLS is biased in some extent, so we focus on LSDV model (Least Squares Dummy Variable -a fixed effect model) and FGLS model (Feasible Generalized Least Squares-a random effect model) for the Model 3, etc. Because the selected time points only have seven, and the cross sectional samples as long as 29, we cannot calculate regional fixed effects in LSDV framework, otherwise, there will be a phenomenon of degradation to singular matrix. However, the time-fixed effects are calculated in detail. Which is the best between the two cases of LSDV for fixed effects and FGLS for random effects? Hausman Test gives a reference answer.
4.3. The Updated Results from Table 2
The updated results are from Model 3, 4 and 5 in Table 2 via mainly using the growth of GDP per worker as explained variable, but some related results from Model 1 and 2 in Table 1 are referred when much necessary.
1) Beta convergence is confirmed all the way, while the coefficient of initial GDP per worker or GDP per capita is still negative to the growth rate of GDP per worker.
2) The human capital index for education degree is always significant and positive in any case with high coefficients.
3) The investment rate is negative in the cases of pooled OLS and FGLS in Model 3 (Table 2), even in Model 1 (Table 1). However, the coefficient of investment rate now becomes significantly positive in the credible LSDV cases of Model 3, 4 and 5 in Table 2.
Since the provincial number of the provincial regions is approaching the total, actually not a randomly selected sample from an unlimited population, the presupposed FGLS models for random effects may be suspicious in advance. The results from Hausman-test also distinguish the two kinds of assumptions clearly, which reports the Wald-statistic is high, far greater than the related critical value, not refuse the assumption of fixed effects in LSDV framework. Now the more acceptable results of LSDV models excluding Model 1 show the investment rate is significantly positive for growth of GDP/worker, but its coefficient is not high enough. As mentioned above, the negative result from Model 1 may be a little bit dubious, though it is a fixed model as well.
4) The regional population growth index is significantly positive to growth of GDP/workers in two cases, the time fixed effect model and the pooled OLS model, but not in the FGLS case in Model 3. As discussed above, the fixed effect framework is more appropriate. Population growth in representative years is significantly positive to the GDP per capita in 1% or 10% confidence level in Model 2.
To ensure the results from another point of view, the overall growth rate of regional population since 1982 to 2008 is used as a proxy variable (Appendix 2), and it is significantly positive with a much bigger coefficient (see Model 5 in Table 2). So we tend to conclude that regional population growth is positive for economic growth of China, provisionally.
5). The coastal dummy is always significantly positive. Most coastal regions may just be the main engines for growth of China in an open and international view.
6). Unexpectedly, the appropriate Model4 in Table 2 indicates that the variable of overall growth of workers since 1978 to 2008 (as a proxy, Appendix 2) is significantly negative to growth of GDP/worker.
Though Model 1 in Table 1 manifests that the overall growth of workers since 1978 to 2008 is significantly positive to the growth of GDP/worker when the coastal dummy is not introduced, its coefficient is low, provisionally, we could not conclude that growth of workers must neither be helpful for growth of GDP/worker because Model 1 is biased in some extent5, nor absolutely harmful for it because several symbolic provincial regions such as Guangong, Fujian and Shandong with quick GDP/worker growth correspond to almost the highest growth of urban workers. An updated and more general result will be given in 4.4.
7). The alternative models show growth of the population is significantly positive to that of GDP/worker, but the overall growth of urban workers in model 4 is significantly negative. The results are both reported, but it seems there is a paradox. All the seemingly contradictory results will be updated in 4.4 (Table 3).
8). The positive coefficients of the selected seven time dummies in the time-fixed model decline monotonously from T1 to T7, which inversely shows the explanatory power of the explaining variables comprehensively introduced with related time-fixed effects increases along with time.
4.4. Some Additional Results Focusing Respectively on Growths of Workers and Population
![]() (3)
(3)
![]() (4)
(4)
The Equation (3)/(4) is extended from Equation (1)/(2), where the square term of ln(Nit) indicating overall growth of workers or population is added, and GRit is confined as overall growth of GDP/workers, and y1978i as initial GDP per capita. The updated results (Table 3) different from Table 1 and Table 2 are summarized below.
First, unfortunately, the Coastal Dummy is no more significant when the overall growth of population and its square term are synchronously introduced. This indicates the coastal location may not be absolutely a decisive factor for growth of GDP/worker while the factor of population scale is much emphasized. In spite of this, we still do not contempt the status of coastal location while the p-value of its coefficient is still less than 15%.
Second, the impact of growth of workers on GDP/worker growth is altered. Now it is from decreasing to increasing along with time, or “U” curve. The growth of urban workers is significantly negative, but its square item is significantly positive to GDP per worker growth, respectively. This in-depth result suggests an ordinary increase in the number of workers is harmful for growth of output efficiency, however, after crossing a threshold it can lead to a jump in efficiency. How to explain the phenomenon? A reasonable conjecture is the urban scale effect needs a threshold for industrial production in the transitional process of urbanization. Agglomerations in Guangdong, Fujian and Shandong are examples of having crossed the threshold. Theoretically, perhaps there is a tradeoff between a positive effect from Romer Model and a negative effect from Solow Model about the role of labor growth, or scale effect may be source of sustaining Romer Model. Figure 3(a) is a schematic diagram abstracted and simulated from the fixed model of Model 6 while all other variables are omitted except for the logarithmic growth of workers and its square term.
Third, the effect of population growth on GDP/worker growth is also altered. Now it is from increasing to decreasing, or inverse “U” curve. Contrast to coefficients for the growth of workers, the growth of population is positive, but its square term is negative with the growth of GDP/worker, respectively. The result shows that population growth helps produce efficiency, but, after crossing a threshold, instead to cause a decline in enhancing the efficiency. How to explain the phenomenon? The domestic land is fixed, productivity improvements may be finally bounded in populous provincial regions with an aged tendency of population. Moderate population growth is more likely to satisfy the population’s willing to migrate to areas with emerging economy, but too fast population expansion restricts its efficiency from environmental capacity. Figure 3(b) is a schematic diagram abstracted and simulated from the fixed model of Model 7 while all other variables are omitted except the logarithmic population growth and its square term.
The opposite effects between growths of workers and population may reflect some new unknown contradiction (Figure 3(a) and Figure 3(b)) in theory. In spite of this, it may have some special policies implication for China, since there is low correlation between the two the overall growth rates of provincial urban workers and population during the sample period, and perhaps its potential domestic policy implication may be abundant, e.g., birth control should be or not be maintained, and whether path choice for urbanization may be more careful for passing through its so called middle income trap.
5. Concluding Remarks
Inclusive growth is possible in developing countries, even under a special condition only for obtaining some shining points of regional economic growth in an overall poorness situation, through creating Matthew effect (or accumulated advantage) where “the rich get richer and the poor get poorer” originally from the Bible.
This paper argues for an actual regional convergence as one result of marketization in China, while the central government pays more attention on subsidization to guarantee the basic rights of education in poorer regions especially for adolescents in a centralizing way, and the domestic citizens could re-obtain the basic rights of free migration in institution with cross-boundary transportation improvement. An unbalanced regional strategy is a good selection for development, or even the best one, if its ultimate goal is right set for pursuing common prosperity.
This paper concludes convergence of China is confirmed, and it is quite biased that a conclusion of divergence from/without considering the actual regional populations as denominators due to huge interregional migration in provincial level, and from underestimating human capital effects with centralization
![]() (a)
(a)![]() (b)
(b)
Figure 3. (a) Effect for efficiency of growth of the urban workers; Notes: X denotes logarithmic growth of overall urban workers (b) Effect for efficiency of growth of population. Notes: Y denotes logarithmic growth of population.
because of not full data set. Not only divergence is easy to mislead people’s thought, but also it may be a serious problem of not-reflecting the reality of the important emerging economy of China. Unfortunately, it is still widely believed, that China’s reform and opening up since 1978 liberated the productive force, and then led to a rapid economic growth miracle, but it seriously made regional disparities expand, so it is not laudable and its regional average personal income must be typically divergent.
In this paper we have found:
First, unbalanced spatial economic strategy is not harmful, while the strategy with abandoning static spatial fairness for preferring its coastal line which has better historical openness basis. Open to the international market and the inland market simultaneously has led to a clear actual converging trend instead of the old conclusion of divergence during the sample period of China.
In the second place, institutional innovation can determine rise or fall of a nation. since 1978 to 2008, the phenomenon of convergence (provincial GDP/ worker) is concomitantly relied on enhancing human capital accumulation with its spatial equalization process from educational institution innovation, and the national economic growth may have better been partly viewed as a by-product of centralization of human capital institution with more powerful support for poor regions.
Third, segregation is much harmful for inclusive growth. At least, for China as a vast and populous nation, the swift change of domestic population mobility degree is much helpful for reforming a new fair market environment, from extremely-strict-limitation for population in human history to almost completely- migrating-freedom among all provincial regions (except for Hong Kong, Macao and Taiwan, China, up to the present).
Fourth, the new result does not contradict with the other long-tested results without considering actual provincial population or urban labor as denominators, partly because China’s special household registration system for protecting formally registered urban residents ever concealed a lot of realities. In addition, actual provincial income distribution is also different from geographical distribution of total income while migration is becoming much easy, and the still large or even larger geographical disparities is not only from the unbalanced strategy directly, but from better historical culture base in coastal line such as quantity of overseas Chinese. The migrant workers from inland rural areas can share wage income from the coastal cities, so provincial beta convergence is certainly possible before 2008, the time node for the capricious aggressive 4 trillion yuan (US$586 billion) fiscal stimulus plan. Provincial income distribution is also different from personal income distribution nationwide, the latter may be divergent, but the former may be convergent only if the identity tags of migrant workers are re-reckoned in actual working places instead of native places, and most of their incomes are sent back and used in native places.
Concretely, this paper points out that the most important hidden factor for regional growth rate of GDP/worker in China is human capital accumulation during the discussed period5. The timely-centralized and spatially-equalized human capital gradually leads to an unexpected actual provincial convergence of economy or even the quick economic growth itself in the process of tremendous reforms, even though the coastal section opened to the world first with much lower tax rate for attracting foreign investment. The impact on efficiency from physical investment rate should not be overvalued relative to institutions including the transitional institution of human capital accumulation. The consequence of coastal section first opening to the world for international markets and, concurrently, to inner China for durably cheaper labors with permitting migrating step by step, is interesting and instructive.
In brief, the still-big or even bigger geographical disparity in China does not contradict with the new conclusion of the unexpected actual provincial income convergence. The importance of inclusive human capital institution is not less than that of physical capital incentive in micro or regional level, and a centralized human capital institution, one part of authoritative political institution for ensuring rights of all basic educations of people, is crucial for reforming an ideal inclusive economic growth model.
Acknowledgements
This work is supported by the National Planning Office of Philosophy and Social Science of China [11BJL028], whose original project title is “Development Path Choice of Transitional China under Inclusive Growth Ideal for Balancing Urban and Rural Sectors”; and by the Natural Science Foundation of China [No.70741008]. The first author would like to thank for Sandy Dall’erba, and Yehua Dennis Wei, etc. for help!
Funding
This work is supported by the National Planning Office of Philosophy and Social Science of China [11BJL028], whose original project title is “Development Path Choice of Transitional China under Inclusive Growth Ideal for Balancing Urban and Rural Sectors”; and by the Natural Science Foundation of China [No. 70741008].
NOTES
1It is pointed out in Hoshino [26] that the 1990’s disparity of China was over estimated and that it decreased after 2005 as in Figure 1 here. It is rational that local officials prefer higher (lower) GDP per capita in more developed (backward) regions: Higher per capita GDP data according to registered populations may help to earn promotion in coastal regions, whereas lower per capita GDP data help to maintain financial subsidies in western regions from the central government.
2Although the examination paper was differentiated among provinces afterwards, this change does not impact on the provincial quota.
3In China, all the universities and colleges almost have no independent recruitment rights.
4Perhaps other policies such as the birth control (family planning) since the end of the 1970s are also important for the education equalization, because they provided opportunities for population quality promotion. The national strategy of Great Western Development established since the 1998 Asian Financial Crisis also helped the process of actual convergence of GDP per capita to some extent in the latter decade.
5Model 1 is dubious in some extent, because GDP is not separable, and the ratio of GDP to (urban) worker may provide misguided information from the initial-year-data, e.g., GDP/worker of underdeveloped Tibet in 1978 is oddly approaching to data of Beijing, the Capital of China; and another poor region, Gansu province, even higher than Beijing, only because of originally very small scale of workers in the two provincial regions.
5This result is suitable for the per capita GDP at least not more than $4000 economy, because China’s per capita GDP in 2008 was up to $3600, according to its purchase power at that time. For today’s development path choice of low-income countries and regions, it may have a realistic guiding significance.