Development and Validation of Stability Indicating Rapid RP-LC Method for Determination of Process and Degradation Related Impurities of Apremilast, an Anti-Inflammatory Drug ()
1. Introduction
Apremilast is a novel, oral small-molecule inhibitor of phosphodiesterase 4 (PDE4) that works intracellularly to modulate a network of pro- and anti-in- flammatory mediators. Phosphodiesterase 4 is a cyclic adenosine monophosphate (cAMP)-specific PDE and is the dominant PDE in inflammatory cells. Inhibition of PDE4 elevates intracellular cAMP levels, which in turn down regulates the inflammatory response by modulating the expression of tumor necrosis factor alpha (TNF-α), interleukin (IL)-23, IL-17, and other proinflammatory cytokines. Elevation of cAMP also increases anti-inflammatory cytokines. These pro- and anti-inflammatory mediators have been implicated in psoriasis and psoriatic arthritis (PsA). The proinflammatory mediators that are up regulated in PsA include the cytokines TNF-α, IL-1, IL-6, and IL-8, and the chemokines monocyte chemotactic protein-1 (MCP-1) and macrophage inflammatory protein-1 beta (MIP-1β) (CC-10004-PSA-002-PD). Based on these effects, Apremilast is being developed for use in the treatment of various immune-mediated inflammatory conditions such as psoriasis, PsA, rheumatoid arthritis (RA), Behçet disease (BD), and ankylosing spondylitis (AS). OTEZLA tablets are supplied in 10-mg, 20-mg, and 30-mg strengths for oral administration. Each tablet contains Apremilast as the active ingredient and the following inactive ingredients: lactose monohydrate, microcrystalline cellulose, croscarmellose sodium, magnesium stearate, polyvinyl alcohol, titanium dioxide, polyethylene glycol, talc, iron oxide red, iron oxide yellow (20 and 30 mg only) and iron oxide black (30 mg only) [1] - [9] .
The development of capable analytical method of drug substance to establish impurity profile study is a critical and essential activity during the process development of product in generic companies as process is either improved continuously with the use of new reagents; intermediates, etc., or change in the route of synthesis of product. Moreover there are lots of regulatory challenges to address the regulatory queries on impurity profile hence proper study of impurity profile by suitably developed analytical method is very essential. During the study of synthetic process in our laboratory, we discovered eight process related impurities viz., Imp-1, Imp-2, Imp-3, Imp-4, Imp-6, Imp-7 and Imp-8 as shown in Figure 1.
There are few reports which provide bio analytical HPLC methods for the determination of Apremilast and its metabolite in blood plasma. These methods are limited to quantitative determination of Apremilast in biological and formulation samples [10] [11] [12] . Further, these reports have not provided the details on analysis of process-related and degradation impurities of Apremilast formed under the stress conditions employed. As per the requirements of various regulatory authorities, the impurity profile study of drug substances and drug products has to be carried out using a suitable and validated analytical method in the final drug substance and in the drug product. Further, Apremilast is not yet official in any of the pharmacopoeia. Two of the articles have reported method for determination of Apremilast and its impurities, one article provides the method for determination of Apremilast by UV [13] , and another article provides the method for determination of Apremilast and its impurities by HPLC [14] . The
![]()
Figure 1. Synthetic scheme of Apremilast: the details of process related impurities.
reported HPLC method has longer run time and lack of forced degradation study.
As per our knowledge there is no method reported for the determination of process related and degradation related impurities of Apremilast in drug substance and drug product by using HPLC for regular analysis and stability study analysis in QC laboratory. The core-objective of this research work was to develop a specific and robust stability-indicating RP-LC method for the determination of process and degradation related impurities of Apremilast and its analytical validation. The identified impurities required for method development and method validation were received from Megafine Pharma R & D centre, process laboratory and were characterized by IR, Mass, and NMR. The developed method was found to be specific, selective, and stability indicating for the determination of process and degradation related impurities of Apremilast. The developed method was successfully validated according to the USP <1225> Validation of Compendial Procedures and ICH Q2 (R1) guidelines [15] [16] .
2. Experimental
2.1. Materials and Reagents
The common reagents like ammonium dihydrogen orthophosphate, hydrochloric acid, sodium hydroxide, and hydrogen peroxide were all of AR grade, procured from Merck (India). The gradient grade acetonitrile was procured from Merck, Mumbai, India. HPLC grade water obtained from Millipore system (Millipore Inc., USA) was used throughout the analysis. The potential process related impurities viz., Imp-1, Imp-2, Imp-3, Imp-4, Imp-5, Imp-6, Imp-7 and Imp-8 and test sample of Apremilast were received from synthetic laboratory of Megafine Pharma (P) Ltd., Nashik, India.
2.2. Instrumentation and Chromatographic Conditions
HPLC (Agilent 1200, Agilent Technologies, Germany) equipped with photodiode array detector was used for method development, forced degradation studies and method validation. The photodiode array detector was used to determine the peak purity of stressed samples. Synergi Max-RP 80 A (150 × 4.6 mm ID), 4 µ HPLC column thermostated at 40˚C was used for the separation. Mobile phase A was prepared by dissolving 5.75 ± 0.10 g ammonium dihydrogen orthophosphate and 1 ml triethylamine in 1000 mL of Water, filtered through 0.45 µm membrane filter (0.45 µ, Millipore) and degassed in ultrasonic bath prior to use. Acetonitrile was used as mobile phase B. The flow rate and injection volumes were 1.0 mL∙min−1 and 10 µl respectively and auto sampler temperature was kept at 5˚C. The analysis was carried out under gradient conditions such as: time (min)/A (v/v): B (v/v); T0.01/70:30, T3.0/70:30, T18.0/45:55, T24.0/45:55, T26.0/70:30 and T30.0/70:30. The data was acquired at 230 nm for 30 min and processed by using EZ Chrom Elite software Ver. 3.2.1.
2.3. Preparation of Analytical Solutions
The mixture of 50% acetonitrile and 50% water was used as diluent for preparation of analytical solutions. The test sample solution having concentration of 500 µg∙mL−1 was prepared for the determination of process and degradation related impurities of Apremilast. Individual stock solutions of each impurity at concentration about 75 µg∙mL−1 (Imp-1, Imp-2, Imp-3, Imp-4, Imp-5, Imp-6, Imp-7, and Imp-8) was prepared in diluent which was further diluted adequately to study the validation attributes. The stock solution of Apremilast reference standard of a concentration 50 µg∙mL−1 was prepared and further diluted with impurity stock solution to get the 0.75 µg∙mL−1 and 0.50 µg∙mL−1 concentrations of impurities and Apremilast respectively as a standard solution preparation as shown in Figure 2(b). The specification limits used for validation studies for known impurities was 0.15% w/w for the related substances viz., Imp-1, Imp-2, Imp-3, Imp-4, Imp-5, Imp-6, Imp-7 and Imp-8. Apremilast reference standard solution (500 µg∙mL−1) spiked with all impurities at a specification level (0.15% w/w) was used as system suitability solution (SST) as shown in Figure 2(c).
2.4. Chromatographic Procedure
The blank (diluent), SST, six replicate injections of standard solution and test sample solution were separately injected and chromatographed. The relative standard deviation (RSD) of NMT 5.0% for Apremilast, Imp-1, Imp-2, Imp-3, Imp-4, Imp-5, Imp-6, Imp-7, and Imp-8 peak areas obtained from six replicate injections of standard solution was used to verify the system precision of method. The resolution NLT 1.5 between Apremilast and Imp-5 was set as system suitability criteria in SST. The all known related substances in test sample solution were determined against the mean area of respective impurities obtained from replicate injections of standard solution.
![]()
Figure 2. Typical chromatograms of RP-LC method development; (a) Blank solution preparation (b) Standard solution preparation (c) System suitability test solution (SST).
2.5. Procedure for Forced Degradation Study
Forced degradation studies were also performed on Apremilast drug substance to provide an indication of the stability-indicating property and specificity of the proposed method. The stress conditions employed for the degradation study included light (1.2 million lux hours), heat (105˚C), acid hydrolysis (0.1 M HCl), base hydrolysis (0.1 M NaOH) and oxidation (15% v/v H2O2). For heat sample was exposed for 5 days, for acid, base and oxidation samples were treated for 15 min at RT. The degradation was observed in acid and alkali solution as shown in Figure 3. The mass balance was calculated for all the stressed samples. The mass balance is a process of adding together the assay value and the levels of degradation products to see how closely these add up to 100% of initial value with due consideration of the margin of analytical error [17] [18] [19] . A photodiode array detector was employed to check and ensure the homogeneity and purity of Apremilast peak in all the stressed sample solutions.
2.6. Identification of Impurities
Few crude samples of Apremilast were analyzed for identification of process related unknown impurities by LCMS. Based on the observed m/z, starting material and reactants used in the synthetic scheme (Figure 1) the possible structures of process related impurities were assigned. The impurities (Imp-1, Imp-2, Imp-3, Imp-4, Imp-5, Imp-6, Imp-7and Imp-8) were synthesized and co-in- jected with the Apremilast to confirm the retention times.
2.7. Characterization of Impurities
2.7.1. 1H NMR Spectroscopy
The 1H NMR spectra were recorded on Bruker AV400 (400 MHz) spectrometer using suitable solvent and tetramethylsilane (TMS) as internal standard.
![]()
Figure 3. Typical RP-LC chromatograms of forced degradation study; (a) Acid treated test sample (b) Base treated test sample (c) Peroxide treated test sample.
2.7.2. Mass Spectrometry (MS)
Mass spectra were recorded by using ESI source mass spectrometer equipped with a single quadrupole mass analyzer (Shimadzu LCMS-2020 coupled with a Shimadzu UFLC Nexera, Japan). Ions were detected in electron spray ionization with positive/or negative ion mode (Event). Spectra were acquired from m/z 80 to 800 in scan mode.
2.7.3. Fourier Transform Infrared Spectroscopy (FT-IR)
FT-IR spectra were recorded for all the eight process-related and degradation impurities on Perkin Elmer model-spectrum-100 (California, USA) instrument using KBr pellet method.
All impurities (Imp-1 to Imp-8) were characterized using MS, FT-IR, and NMR spectroscopic techniques. The mass, FT-IR spectral data and 1H NMR chemical shift values of these impurities are presented in Table 1.
3. Results and Discussion
3.1. Development of Analytical Method
The quality of product can be determined by good analytical method therefore
![]()
Table 1. Mass, FTIR spectral data and 1H NMR chemical shift values.
s, singlet; m, multiplet; t, triplet; d, doublet.
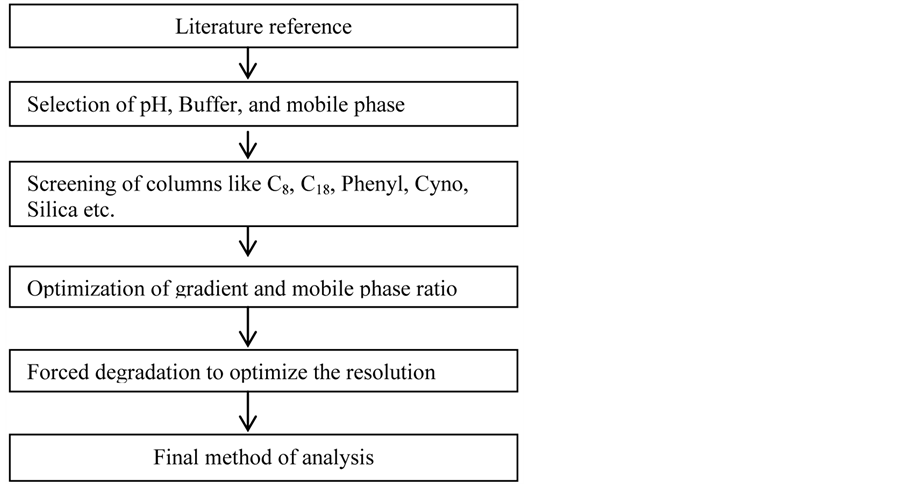
objective of method development was to separate Apremilast and its process and degradation related impurities (Imp-1 to Imp-8) in a short run time with good resolution and good peak shape. The resolution between Imp-5 and Apremilast was critical during the method development. Hence selection of proper stationary phase was a major role during method development to achieve the good resolution and peak shape. Initial method development trials were conducted on different stationary phases like C8, C18, Phenyl, Bi-Phenyl and Phenyl hexyl along with the optimization of other chromatographic conditions like detection of wavelength, the type and quantity of organic/inorganic buffer, pH of mobile phase, thermostat and column oven temperature. The analytical method development flow diagram has been depicted below.
Few trials were carried on gradient mode by using reversed phase C18 column and a mixture of acetonitrile-buffer (0.05 M NH4H2PO4) in the different ratio. The system was found not suitable to separate the Apremilast and its Imp-3 and Imp-5, where the peak of Apremilast was co eluted with Imp-3 and closely separated by Imp-5. To increase the resolution between Apremilast and its Imp-3 and Imp-5, the percentage of acetonitrile in the mobile phase was decreased along with the screening of different columns. To overcome the lower resolution of Apremilast and its impurities (Imp-5) stationary phase was changed from C18 to Synergi Max-RP 80A with gradient mode.
Every time system suitability criteria was evaluated during the different trial runs of method development to ensure the strength of developed method. Gradient mode was preferred than the isocratic mode to achieve the good resolution and elution of late-eluting (non-polar) impurities. Finally satisfactory resolution and good peak shape of analyte was observed on Synergi Max-RP 80A, (150 x 4.6 mm ID), 4 µ column at flow rate 1.0 mL∙min−1 , λ 230 nm, column oven temperature 40˚C and injection thermostat 5˚C and mobile phase was consisting phosphate buffer, and acetonitrile. It was observed that Apremilast, Imp-1, Imp-2, Imp-3, Imp-4, Imp-5, Imp-6, Imp-7 and Imp-8 were well separated under the optimized conditions with a resolution greater than 1.5 and indicated the specificity of the developed HPLC [20] . The representative chromatograms of spiked and unspiked test preparations are shown in Figure 4.
The optimized method was validated as per ICH guidelines. The developed method was complying system suitability criteria during the analytical method validation and batch analysis which itself indicate the good strength of developed analytical method. The results of system suitability criterion are depicted in Table 2.
3.2. Validation
3.2.1. Specificity (Selectivity)
Specificity is the ability of method to measure the analyte response in presence of its potential impurities. The stress testing of the drug substance can help to identify likely degradation products, which can, in turn, help to establish the degradation pathways and intrinsic stability of the molecule and validate the stabil-ity-indicating power of the analytical procedures used. The specificity of developed RP-HPLC method for Apremilast was determined in presence of its impurities (Imp-1 to Imp-8) and degradation products. The peak purity data of Apremilast indicated that it is spectrally pure. Mass balance is a process of add ing together the assay value and the levels of degradation products to see how
![]()
Figure 4. Typical RP-LC chromatograms of; a) Apremilast unspiked test preparation, b) Apremilast spiked test preparation with known impurities (Imp-1, Imp-2, Imp-3, Imp-4, a Imp-5, Imp-6, Imp-7 and Imp-8).
![]()
Table 2. System suitability test results.
RRT (Relative retention time).
closely these add up to 100% of initial value with due consideration of the margin of analytical error. Forced degradation study results are given in Table 3.
3.2.2. Precision
System precision for related substances determination was verified by standard solution, which was analyzed for six times. RSD of Apremilast and all impurities peak areas was evaluated. Precision of the method was studied for method precision and intermediate precision. The related substances method precision was demonstrated by analyzing six separate Apremilast sample solutions that were prepared by spiking the related substances viz., Imp-1, Imp-2, Imp-3, Imp-4, Imp-5, Imp-6, Imp-7, and Imp-8 at specification level. The RSD (n = 6) for each related substance was evaluated and found to be 0.57% - 1.22%. In the intermediate precision study, the similar procedure of method precision was carried out by a different analyst, using different instrument on a different day with different lot of same brand column. The percentage relative standard deviation of the results for related substances method was evaluated and found to be 0.59-1.39%. The results of method precision and intermediate precision are compared with each other. The overall RSD (n = 12) for percentage of impurities (i.e. Imp-1 to Imp-8) were found to be in the range of 0.59% - 2.49%. The results are reported in Table 4.
3.2.3. Linearity
The linearity of peak areas versus different concentrations was evaluated for Apremilast and all the related substances using six levels ranging from LOQ to 250% (LOQ, 50, 100, 150, 200 and 250%) with respect to the specification level of impurities. The linear regression data for all the components tested were presented in Table 5. The RF of each impurity was estimated from the slope of the calibration curve for each impurity by using formula; RF of impurity = Slope of the Apremilast/Slope of respective impurity.
![]()
Table 3. Forced degradation results (By area %).
Mass balance = % assay + % sum of all impurities + % sum of all degredants.
![]()
Table 4. Results of the method precision and intermediate precision study.
![]()
Table 5. Linearity, limit of detection (LOD) and limit of quantitation (LOQ) data for Apremilast and related substances.
cLOD LOQ values are in % with respect to test concentration of 500 µg/ml.
3.2.4. Limits of Detection and Quantitation (LOD and LOQ)
As per ICH Q2R1 guideline the standard deviation of the peak areas and slope of linearity data limit of detection (LOD) and limit of quantitation (LOQ) of Apremilast and related substances were calculated. The LOD and LOQ of Apremilast was 0.053 µg∙mL−1 and 0.160 µg∙mL−1 respectively, whereas the LOD and LOQ for the related substances were in the range of 0.025 - 0.068 µg∙mL−1 and 0.077 - 0.206 µg∙mL−1 respectively. The calculated LOQ concentrations of all the components were further verified for precision by injecting six individual preparations of Imp-1, Imp-2, Imp-3, Imp-4, Imp-5, Imp-6, Imp-7, Imp-8, and Apremilast. The RSD of LOQ precision was in the range of 3.35% - 8.96%. These limits of quantification levels of the impurities were helpful for the process research work to control the impurities at the accepted level during the optimization of the process. The results are depicted in Table 5.
3.2.5. Accuracy (Recovery)
Accuracy of the method for all the related substances was determined by analyzing Apremilast sample solutions spiked with all the related substances at four different concentration levels viz., LOQ, 50, 100 and 150% of specification level. Each level has been analyzed in triplicate. Table 6 provides validation data results of related substances of Apremilast. The recovery of all these related substances was found to be in-between the predefined acceptance criteria of 80.0% - 120.0%.
3.2.6. Stability of Analytical Solution
Sample solutions of Apremilast spiked with related substances at specified level were prepared and analyzed immediately at different time intervals up to 2-days to determine the stability of sample solution. The sample cooler temperature was
![]()
Table 6. Accuracy study data of related substances.
a% Recovery average of three determinations. b0.15% of all related substance.
maintained at about 5˚C. The results from these studies indicated, that the sample solution was unstable at room temperature and stable for 2-days at 5˚C temperature.
3.2.7. Mobile Phase Stability
Apremilast test sample spiked with related substances at specification level was used to evaluate the mobile phase stability of the method. The Apremilast test sample was analyzed after 24 hrs and after 48 hrs by using same mobile phase. The content of each impurity was evaluated and compared to the mean results of method precision. The difference between the mean values (after 48 hrs.) from the method precision mean results is found to be below 10.0%. The studies indicated that there was no effect on the determination of related substances and the selectivity after 48 hrs. Therefore the mobile phase is stable for 48 hrs.
3.2.8. Robustness
To evaluate the robustness of the developed method, the chromatographic conditions were deliberately altered and the resolution between closely eluting peak pair i.e. Imp-5 and Apremilast was evaluated. The flow rate of the mobile phase was 1.0 mL∙min−1. To study the effect of flow rate on the resolution, the same was altered by 0.1 units i.e. from 0.9 to 1.1 mL∙min−1. The effect of column temperature on resolution was studied at 37˚C and 43˚C instead of 40˚C. All the other mobile phase components were held constant as described above. In all the deliberate varied chromatographic conditions (flow rate, column temperature), the tailing factor of Apremilast was less than 1.5 and the resolution between any two peak was greater than 1.5. There was a very minor variation in the resolution and tailing factor results observed in all the robustness conditions illustrating the robustness of the method.
3.3. Application of the Method
The analysis of bulk drug sample indicated that the method is specific, selective, and rapid for determination of related substances of Apremilast (Table 7).
![]()
Table 7. Results of bulk drug batches sample analysis.
ND, Not detected.
4. Conclusion
This paper presents a rapid, specific, precise, accurate and stability indicating gradient RP-LC method that separates the related substances and degradation products of Apremilast with good resolution. The process and degradation related impurities present in Apremilast sample were identified by LC-MS and characterized by using MS, FT-IR and 1HNMR spectral data. The developed method was validated to ensure the compliance in accordance with ICH guidelines. Hence this method can be used for routine testing and stability analysis of Apremilast drug substance, wherein all the statistical results (percentage, R.S.D., percentage difference and recovery %) are within the acceptable criteria. The method would be useful for routine evaluation of the quality of Apremilast in bulk drug manufacturing unit for detection of process and degradation related impurities.
Acknowledgements
The authors wish to thank the management of Megafine group for supporting this work. We would also like to thank colleagues in the division of Research and Development of Megafine Pharma (P) Ltd. for their cooperation in carrying out this work.