Abundance and Diversity of the Phototrophic Microbial Mat Communities of Sulphur Mountain Banff Springs and Their Significance to the Endangered Snail, Physella johnsoni ()
1. Introduction
Banff National Park, Alberta lies in the southern Canadian Rocky Mountains. The area includes Sulphur Mountain, which contains thermal springs discovered in 1883. These serve as the landmark catalyzing the development of Canada’s National Park System. There are three groups of sulfur springs along the Mountain thrust at progressively lower elevations towards the Bow Valley River: the highest includes the Upper Hot Spring (1584m); next, the Middle Springs (1500 m); and the lowest at the Cave and Basin (C & B) (1400 m) within the National Historic Site [1] (Figure 1). The springs are hosted by carbonate rock, and therefore have a CaHCO3SO4 chemistry [2] with high Ca (240 to 414 mg/l), low O2 (0.0 to 1.6 mg/l), and high H2S (14.7 to 45.7 mg/l) levels and minimal variation in total dissolved solids (1070 to 2030 mg/l) [1] . Surface water temperature averages 33˚C ± 3˚C in all seasons, despite Banff’s cool annual average of –4˚C [3] and pH remains near-neutral, ranging from 6.8 to 7.3 [3] .
Biological components include thick bacterial mats (periphyton) on rocks, branches and sediment within the outflow stream; and, the endemic snail Physella johnsoni [4] which was designated threatened by the Committee on the Status of Endangered Wildlife in Canada in April 1997 and later uplisted to endangered in May 2000 [5] . Presently, P. johnsoni is found at the Kidney Springs, the Upper and Lower of the Middle Springs group and at the C & B Historic Tourist Site, predominantly atop cyanobacterial mats. Snail population has been studied for over a decade showing trends in seasonal fluctuation, often >10 in magnitude, with the highest numbers typically observed January to February and lows May to July. Lepitzki (2007) [3] enumerated snail numbers as high as 14,000 and dropping as low as 3000 at the Upper Middle Springs (UMS) over a period of less than three months. Influences include a combination of human interference, water chemistry, possible predation and the, as

Figure 1. Map of the Banff Sulphur Mountain thermal springs area (A) including the Cave and Basin Historic Tourist Site (B) and the Upper Middle springs restricted area (C). Sampling sites are indicated by numbers 1 - 13. Black dots in (A) indicate individual springs; lined area is Town of Banff, UCB, Upper Cave and Basin spring; LCB, Lower Cave and Basin spring.
yet uninvestigated, nutritive and microbiological aspects of the niche.
The importance of phototrophic microbes as primary producers of fixed carbon in aquatic environments has been demonstrated [6] [7] , as dense metabolically diverse mats can attain production rates comparable to those of tropical rain forests [8] . Excreted photosynthates, extracellular polymeric substances and cell lysates [9] -[11] are then available to support anabolism of heterotrophs. Oxygenic photosynthetic cyanobacteria predominate in illuminated aquatic environments [12] , producing a variety of organic compounds such as glycolate, acetate and lactate, capsular and extracellular polymers, proteins and nucleic acids [13] -[16] . These give integrity to the biofilm structure and serve to sequester and retain dissolved organic carbon, minerals and ions [17] [18] . As such, mats act as an essential trophic link to higher levels within the ecosystem. Anoxygenic phototrophic prokaryotes, including purple and green sulfur (PSB), purple and green nonsulfur bacteria (PNSB) and aerobic anoxygenic phototrophs (AAP) are well-established as co-dominant cyanobacterial mat inhabitants [19] [20] , contributing in biomass, biofilm polymer production and an abundance of nutritive carotenoids.
While it has been reported that filamentous Thiothrix-like sulfur bacteria are among the dominant chemotrophic members of the mat, no work has been done on the resident phototrophs. This study, complimentary to Parks Canada’s Recovery Initiative for P. johnsoni, focuses on elucidating the composition and dynamics of the above mentioned groups of anoxygenic phototrophs and cyanobacteria within the spring mat community in search of correlation with the drastic changes in snail population.
2. Materials and Methods
2.1. Collection of Samples
Samples were first collected in August 2003 from 13 sites including both the UMS (N51˚09'50", W115˚34'53") and the C & B Historic Site (N51˚10'05", W115˚35'24"), which are separated by a 2.7 km drive along Sulphur Mountain (~1 km straight-line). Representative 1 cm2 mat specimens were cut from each site, measured for thickness, placed into 1.5 ml Eppendorf tubes containing 1 ml of spring water and put on ice to be used for enumeration. A second set of samples was stored on ice in 50 ml plastic tubes (Falcon) for community spectrophotometry and microscopy. All sites, except Site 2 (a submerged mat not colonized by P. johnsoni), were sampled in subsequent fieldtrips during May 2004; February, May and October 2005; March 2006; and May, August and November 2007. Sampling also occurred in December 2005 for community spectral analysis only.
2.2. Isolation, Enumeration and Bacterial Enrichments
Isolation and enumeration procedures were done on media designed for PSB, PNSB and AAP. Samples were suspended and decimally diluted to 10−8. Aliquots of 0.1 ml were dispensed into anaerobic agar (0.6%) deeps containing purple and green non-sulfur bacterial medium (PNS) or purple and green sulfur bacterial medium (PS) and also spread onto plates of rich organic (RO) medium. Each medium was adjusted to pH 6.8 - 7.0. PNS contained (g/l): MgCl2, 0.5; KH2PO4, 0.3; NH4Cl, 0.3; CaCl2∙2H2O, 0.1; Na-acetate∙3H2O, 1.0; malate, 0.3; yeast extract, 0.2 and (ml/l): trace elements, 2.0 [21] ; vitamin solution, 2.0 [22] ; L-cysteine (0.3 mM), 5.0; L-methionine (0.3 mM), 5.0 and spring water, 50. PS contained (g/l): MgCl2, 0.5; KH2PO4, 0.3; NH4Cl, 0.3; CaCl2∙2H2O, 0.1; Na-acetate, 0.1; yeast extract, 0.05 and (ml/l): trace elements, 2.0 and vitamins, 2.0; NaHCO3 (10%), 20; Na2S∙9H2O (10%), 3.5; and spring water, 50. RO agar (2%) plates contained (g/l): MgSO4∙7H2O, 1.0; KH2PO4, 0.3; NH4Cl, 0.3; CaCl2∙2H2O, 0.1; Na-acetate, 1.0; yeast extract, 1.0; Bactopeptone, 0.5 and casamino acids, 0.5; and (ml/l) each of trace elements and vitamin solutions, 2.0.
Agar deeps were incubated in the light at 27˚C for 14 days before enumeration. RO plates were grown in the dark at 28˚C for 10 days before first and 14 days for second counts. Colonies were categorized by morphotype by microscopy using a Axioscop 2 Light Microscope (Zeiss) at 1000x magnification; and color; and were screened for bacteriochlorophyll (Bchl) with a U2010 spectrophotometer (Hitachi, Tokyo, Japan) with absorbance spectra recorded between 350 and 1100 nm . Estimation of chlorophylls a, b and c was calculated as reported [23] .
For culturing of cyanobacteria and oligotrophic aerobic phototrophs, 0.1 ml aliquots of sample dilutions were spread-plated onto a variation of BG11 agar (1.5%) plates [24] containing (g/l): MgSO4∙7H2O, 0.075; CaCl2∙2H2O, 0.036; NaNO3, 0.15; KH2PO4, 0.03; Na2CO3, 0.02; Na2-EDTA∙2H2O, 0.001; ferric ammonium citrate, 0.006; citrate, 0.006; and (ml/l): trace elements and vitamin solution, 1.0 each and spring water, 35 and adjusted to pH 6.8 - 7.0.
Liquid and agar (2%) pyruvate mineral salts (PMS) medium was used for anaerobic enrichment. PMS was adjusted to pH 6.8 - 7.0 and contained (g/l): Na2-EDTA∙2H2O, 0.01; MgSO4∙7H2O, 0.2; CaCl2∙2H2O, 0.075; NH4Cl, 1.0; K2HPO4, 0.9; KH2PO4, 0.6; Na-pyruvate, 2.2; yeast extract, 0.1 and (ml/l): trace elements and vitamin solutions, 2.0 (as above); L-cysteine (0.1 M), 5.0; L-methionine (0.1 M), 5.0 and spring water, 50. Inoculated Balch tubes were incubated at 25˚C under incandescent light. Plates were grown in anaerobic jars in a 27˚C illuminated incubator.
Aerobic plating was done with a modified PE medium [25] containing (g/l): Na-glutamate, 0.5; Na-succinate, 0.5; yeast extract, 0.5; Casamino acids, 0.5; Na2S2O3, 0.5; KH2PO4, 0.38; K2HPO4, 0.39 and (ml/l): vitamin solution, 1.0 and the above referenced Hanada et al. [25] basal salt solution without NaCl, 5.0.
2.3. Photosynthetic Activity and Carbonates Measurement
Community photosynthetic and chemosynthetic carbon fixation was measured by 24 h on-site incubation of 1 cm2 mat samples with C14-labelled Na-bicarbonate [26] in May and October 2005, March 2006 and May and November 2007. Carbonate and bicarbonate levels were determined by titration [27] in May and October 2005, March 2006 and August 2007.
2.4. Physiology and Phylogeny
Physiological and biochemical tests were done as by Rathgeber et al. [28] . Extraction of genomic DNA, PCRmediated amplification of the 16S rRNA gene sequences and direct sequencing of the purified PCR products were carried out as proposed by Rainey et al. [29] .
3. Results and Discussion
3.1. Study Site Description
Sites (Figure 1) were chosen for proximity to snail aggregations (Sites 3, 5, 6 and 10 - 12), microbiological interest (Sites 1, 2, 4, 7, 8 and 9) or as a snail-free control (Site 13). Site 1, within the cave of the C & B, contains an 8 - 10 m wide and 0.5 - 1.5 m deep pool with a 0.5 m wide outflow stream. A flocculent cream-white bacterial mat grew attached to the surface of the underlying rocks within the turbulent outflow. Dim illumination came from sunlight through a 1 m grating 6 m above the pool surface and from an incandescent lamp approximately 4 m from the mat. Site 2 was an approximately 1 m deep mat lining the floor of the Basin pool and was discontinued after August 2003 due to difficulties in winter sampling and lack of snails at such depths. Site 3 was the deep green microbial mat on the surface of the Basin spring outflow pool. The expanse of the growth was determined largely by the supporting floating detritus. Site 4, samples were taken from the dominant orange formation just subsurface of an open 10 - 12 m diameter, 0.1 - 0.5 m deep pool (known as Billy’s Pool), dense with aquatic plants and the small “mosquito fish” Gambusia affinis [30] . Site 5 was within the stream of the Lower Spring of the C & B that feeds Billy’s Pool and typically had a lush, white midstream microbial development attached to rocks and branches source-side of a boardwalk crossing over the stream. The deep green component of the microbial mat, adjacent to the white layer of Site 5, was distinguished as Site 6. At the Upper C & B spring, Site 7 was sampled from the thin pink-purple mat (Figure 2(A)) and Site 8 was the green subsurface portion of the mat next to Site 7.
The remaining sites were located at the UMS. Site 9, the thin dark olive green mat within the cave was approximately 20 cm underwater near the spring source. Sunlight was limited due to cave structure (midday intensity recorded at ~1.3·mE·m−2·s−1). Average water temperature was highest of all sampling locations at 35.2˚C. Site 10 was approximately 5 m from the opening of the source cave and sampling was from the white flocculent growth on the surface of rocks within the spring stream. Site 11, located near Site 10, was the deep green portion of the microbial mat (Figure 2(B)). Site 12 developed approximately 10 m from Site 11 on the downstream side of a wooden weir. Samples were taken from the white and pale green mat present within the turbulent outflow caused by the weir. Site 13, located 10 m laterally from the UMS stream, grew at the mouth of the West Cave (WC) [5] , was chosen as a control for comparison of bacterial populations. The samples were collected from a thin purple and green mat 1 - 4 cm subsurface along the edge of the cooler rainwater-fed pool (average temperature 25.2˚C).
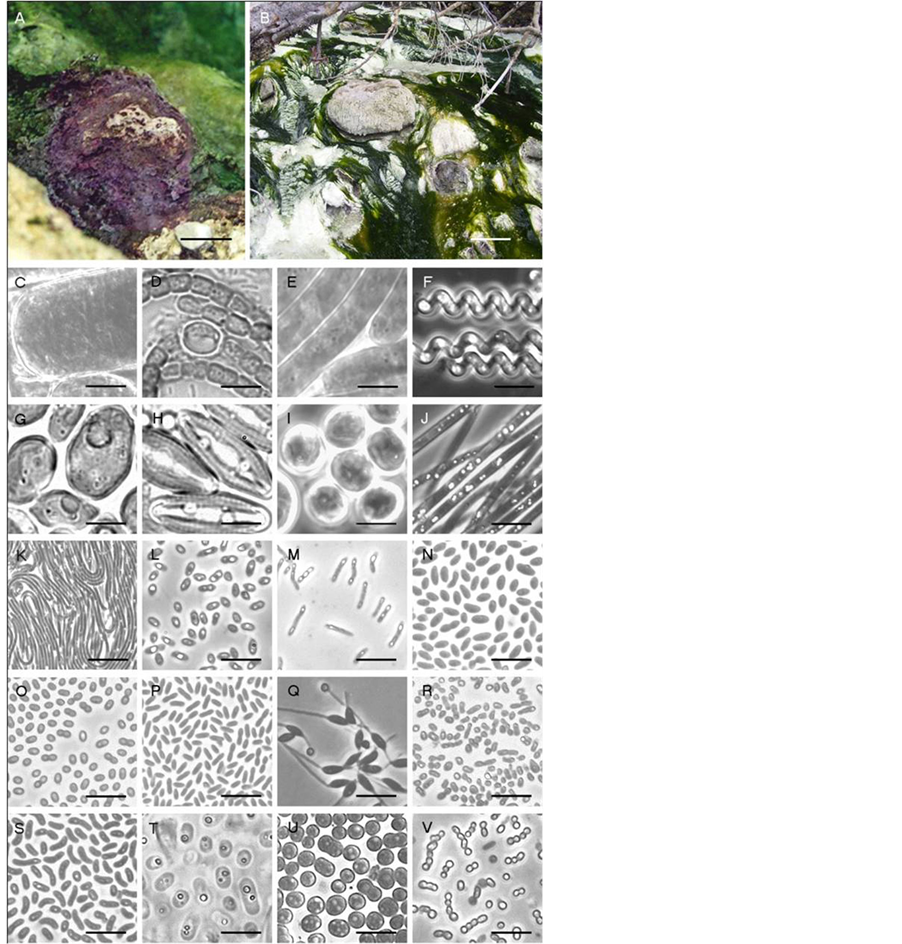
Figure 2. Site photos and phase-contrast micrographs of morphological diversity observed at the Banff springs. Listed genera are morphologically similar or were determined by 16S rRNA sequencing, with percent relatedness indicated in brackets. (A) purple mat at Site 8, UCB; (B) Thiothrixand Spirulina-dominated development within the UMS stream, (C) small portion of unknown Oscillatoria-like filaments, (D) Anabaena-like chains, (E) Oscillatoria-like filaments, (F) Spirulina-like filaments, (G) Chlorococcum-like oxygenic phototroph, (H) Amphora-like diatoms, (I) Dermocarpa-like oxygenic phototroph, (J) Thiothrix-like filaments, (K) Chloroflexus-like filaments, (L) Rhodobacter capsulatus (98.0%), (M) Rhodopseudomonas palustris (99.0%), (N) R. capsulatus (formerly Rhodopseudomonas capsulata) (98.0%), (O) Roseomonas lactus (99.9%) (P) Porphyrobacter tepidarius (99.0%), Q) Rhodomicrobium vannielii (99.6%), R) pink AAP strain BF60, (S) Paracraurococcus ruber (93.7%), (T) Chromatium-like cells, (U) Thiocapsa-like cells, (V) Chlorobium-like cocci. Bar A, 5 cm; Bar B, 20 cm; Bars C-V, 10 μm.
3.2. Macroand Microscopic Analysis of Natural Samples
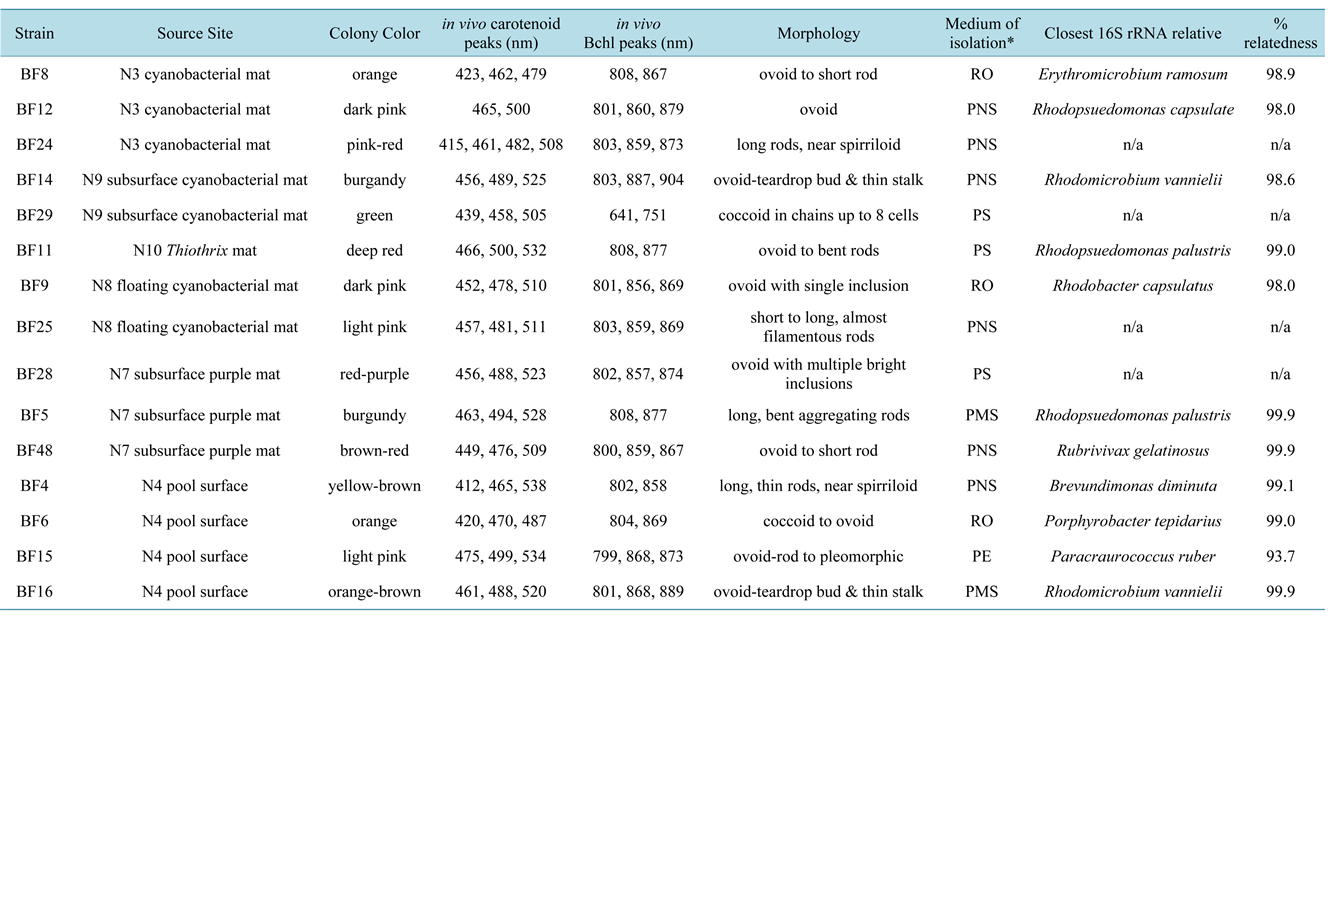
Table 1 summarizes the data of several seasonal observations. Micrographs revealed Thiothrix-like filaments to be the dominant component at Site 1. Large, amorphous refractile intracellular particles were common, indicating sulfide oxidation and accumulation of elemental sulfur typical of Thiothrix (Figure 2(J)). Ovoid cells were visible in significant proportions only in May and August 2007, corresponding to the thickest mat development of 7 mm, from 4 mm observed October 2005. The mat with the greatest and most variable thickness was Site 3 (4 mm in March 2006 and over 20 mm in August 2007) (Table 1). Giant, straight, un-branched green filaments, hundreds of micrometers in length were noted only at this site, predominant in May and August 2007. 20 - 26 µm in diameter (Figure 2(C)), they were sheathed with near-rectangular cells separated by deep constrictions, distinguishing them from most species of Oscillatoria and Lyngbya in size and frequency of cell division [31] . In colder sampling months (February, March, October and November), the population majority fluctuated between Phormidium, Microcoleus, Spirulina (Figure 2(F)) and Oscillatoria-like (Figure 2(E)) species. Site 4 was available for analysis only five of nine samplings. Aerobic growth of a Chloroflexus-like organism observed in August 2003 contributed to the orange color (Figure 2(K)) which, in future samplings, was apparent due to coccoid AAP related to Erythromicrobium and Porphyrobacter (Figure 2(P)). Strains of these two genera were subsequently cultured in large proportion at multiple sites (see Enumeration of Phototrophs). Unicellular Aphanotheceand Dermocarpa-like (Figure 2(I)) and pennate diatoms similar to Amphora (Figure 2(H)) were observed in spring and summer. The Site 4 mat was thickest in May 2005 (4 mm), but was virtually undetectable in all subsequent seasons except August 2007 (<1 mm). During its maximal development (1 cm), Site 5 May and August 2007 samples contained single-celled oxygenic phototrophs of Synechocystis morphology and motile ovoid cells as minor members. Minimal thickness was measured in February and May 2005 before the mat disappeared in October 2005 until summer 2006. Site 6 of the Lower C & B spring (3 - 4 mm thickness) had a significant presence of Phormidium-/Microcoleus-like species, Spirulina and Dermocarpa-like cells with consistent dominance by Oscillatoria-like filaments in all seasons. This mat was also lost in 2005 after a summer and autumn of unusually high precipitation.
Site 7 was composed predominantly of large ovoid cells resembling PSB Chromatium (Figure 2(T)) and rounded Thiocapsa (Figure 2(U)), each containing multiple, highly-refractive sulfur inclusions. Filaments of Phormidium were consistently also part of the cellular matrix. Site 8, dominated alternately by filamentous species of Spirulina and Phormidium, attained maximum thickness in autumn and winter (October and February) (Table 1).
Phormidium sp. filaments consistently populated Site 9 with a co-dominant green coccoid chain-forming bacterium similar to Chlorobium limicola observed throughout the year (Figure 2(V)). Oscillatoria and Spirulina were visible in February, March, May and October. Small white tufts atop the mat were Beggiatoa-like filaments with multiple refractive inclusions. The Thiothrix-like mat at Site 10 showed no co-dominant organisms and little fluctuation in thickness (3 - 6 mm). In summer and autumn 2007, a layer of Phormidium and Microcoleus developed beneath top layers of Thiothrix, creating an interesting structural arrangement. Site 11 was dominated by Spirulina in all seasons with Phormidium sp. filaments in February, March, May and October. Site 12 had the most turbulent water flow and supported a Thiothrix-dominated mat that varied in thickness from 3 - 4 mm in 2005 to over 1 cm in August 2007. During warmer months the mat was interwoven with light green filaments of Oscillatoria (Figure 2(E)), while Phormidium, Microcoleus, Spirulina (Figure 2(F)), Anabaena (Figure 2(D)) and single cells resembling Aphanothece occurred in cold months. Site 13 lacked Thiothrix, though morphotypes from all other sites were observed: Beggiatoa as a minor component in all seasons along with cyanobacterial representatives Phormidium (major morphotype in all seasons), Anabaena (minor in November), Oscillatoria (significant in all seasons), Spirulina (minor in all seasons) and sheathed Lyngbya (major in February) (Table 1).
3.3. Seasonal Community Spectrum Analysis
Pigment abundance was ascertained spectrophotometrically to reflect phototrophic organism dominance and availability for P. johnsoni grazing. Chl a was the main photosynthetic pigment (absorption peak maxima at 661 - 664 nm) throughout all seasons for Sites 3, 6, 8, 11, 12 and 13. Concentrations of Chl a, b and c were calculated in October and December 2005, March 2006, May, August and November 2007 for wet sample mass (Table 2). Samples 3 and 11, from the thickest and greenest photosynthetic mats, had the highest Chl a concentra

Table 1. Summary of seasonal site observations including mat development (expressed as a percentage of the maximum development observed in August 2003), thickness of the mat sample, maximum peaks from whole-community spectral analysis, organisms/morphotypes that were dominant in each sample as viewed under a light microscope and select spring water physicochemical parameters.
Continued
Continued
Continued
1Temperature taken with an alcohol thermometer to the nearest half degree, 2Relative percent development: the seasonally observed expanse of the bacterial mat expressed as a percentage of the maximum development at that site as witnessed in August 2003. 3Maximum absorption peaks of sonicated whole-community samples expressed in nm. Wavelengths in bold indicate highest non-cytochrome peaks and those in brackets reflect weak, less discernible absorption values.
tions (max of 3043 and 3785 µg Chl a/g wet mass respectively, in October), though Site 13 was also consistently Chl-rich (212 to 2231 µg Chl a/g wet mass). Thiothrix-dominant samples contained the least; typically <50 µg Chl a/g wet mass at Sites 1 and 5 and <130 µg Chl a/g wet mass at Site 10 in all experiments. Low Chl a values at these sites reinforced stratification, separating oxygenic phototrophs from Thiothrix-dominant portions of the mat expanse. As revealed by enumeration of pigmented strains (following section), cohabitation with Thiothrix was generally reserved for PNSB.
Generally, higher Chl a concentrations were obtained in cooler months (October, November and December). This was consistent with the indirect relationship between light intensity/availability and production of photosynthetic pigments, to allow for greater light harvesting [32] [33] . However, disparate patterns of fluctuation between Bchl and Chl concentrations emerge at different sites. Figure 3(A) and Figure 3(B) display somewhat opposing trends in the seasonal measures of Chl and Bchl at sites 3 and 12, respectively, while in contrast Sites 8, 10, 11, and 13 (Figures 3(C)-(F)) exhibited a more correlated change. For spectral analysis, samples 10 and 11 were taken from an area that P. johnsoni did not access and thus, like Sites 8 and 13, could experience no grazer impact, while Sites 3 and 12 were the most populated with the snail. Granted limited sampling trials, the possibility exists that a dense population of P. johnsoni could influence the fluctuations of pigments by impacting the changes in bacterial populations. Intense grazing could cause physical damage to oxygenic phototrophs, thus affecting mat Chl content. Snails may also serve as an input of organics through fecal matter and slime trail excreta and, in concert with grazing upon cyanobacteria, may offer increased nutrients and illumination to spur proliferation of PNSB deeper in the mat. Low detection of Bchl at the height of mat thickness and development (May or August) also suggests an increased reliance on purely heterotrophic metabolism when covered by a thicker layer of oxygenic phototrophs, especially for PNSB at light-limited depths of greater than 9 mm [34] .
Table 2. Chl a, b and c values in µg Chl/g microbial mat for Banff Springs sampling sites in select seasons. Proportions were calculated from wet samples and are therefore an underestimate of actual Chl contained per mass of mat.
ns—not sampled.
However, no definitive conclusion can be made without more trials.
In vivo Bchl a peaks were obtained from Site 3 in each May sampling, with the greatest amount in 2007 (0.061 µg Bchl a/g wet mass) and in August 2007; Site 4 in August 2003 (concordant with the presence of Chloroflexus); and Site 6 in August and November 2007. Estimation of Bchl a content per mass of mat are presented in Table 3. Bchl a peaks were observed most consistently from Site 7, reaching maximal µg Bchl a/g wet weight in October (0.192 µg Bchl a/g wet mass) and December (0.217 µg Bchl a/g wet mass) 2005. In all seasons, Light Harvesting (LH) Complex I peaks were visible in the range of 797 - 803 nm with shoulders at 881 - 883 nm and LHII peaks at 851 - 857 nm due to abundant Rhodomicrobium-like species (see Diversity section). Site 9 in vivo spectral samples consistently exhibited a peak at 749 - 757 nm indicative of Bchl c, typical of green sulfur bacteria, and an expected Chl a peak near 680 nm from cyanobacteria. There was also a strong presence of Bchl a in winter months (0.103 µg Bchl a/g wet mass in October and 0.159 µg Bchl a/g wet mass in December) (Table 3).
3.4. Enumeration of Anoxygenic Phototrophs
Table 4 describes the numbers and proportions of Bchl a-containing organisms compared to total bacterial enumeration. The highest counts of AAP were obtained August 2003 at Site 3 (2.3 × 10⁵ CFU/cm2 of mat, or 4% of pigmented bacteria or 2.3% of total heterotrophs) and was over 200 times greater than August 2007 values (1.1% of pigmented isolates and 0.4% of total heterotrophs), over 17 times more CFU/cm2 than obtained in May 2005 (23% of pigmented colonies, 1% of total heterotrophs) and over 23 times more numerous than in November 2007 (4.4% of pigmented isolates, 3.1% of all heterotrophs). Increase in mat thickness might suggest increase in habitat for AAP from season to season (Table 1), though a typical cyanobacterial mat will become anoxic below depths of around 3 mm at night [35] inhibiting obligate aerobes. While the May 2005 (1.32 × 10⁴ CFU/cm2) and November (1.00 × 10⁴ CFU/cm2) figures (Table 5) are only ~9 times that of August 2007 (1.43 × 10³ CFU/cm2), the 20 times larger Aug. 2003 value of 2.33 × 10⁵ CFU/cm2 might be explained by P. johnsoni populations. At 2104 snails, the August 2003 count was more than double that of August 2007 (Lepitzki unpublished), therefore, as described above for PNSB, the potential for simultaneous input of organics (e.g. fecal matter) and the removal of surface cyanobacteria by grazing P. johnsoni could spur heterotrophic growth of AAP.
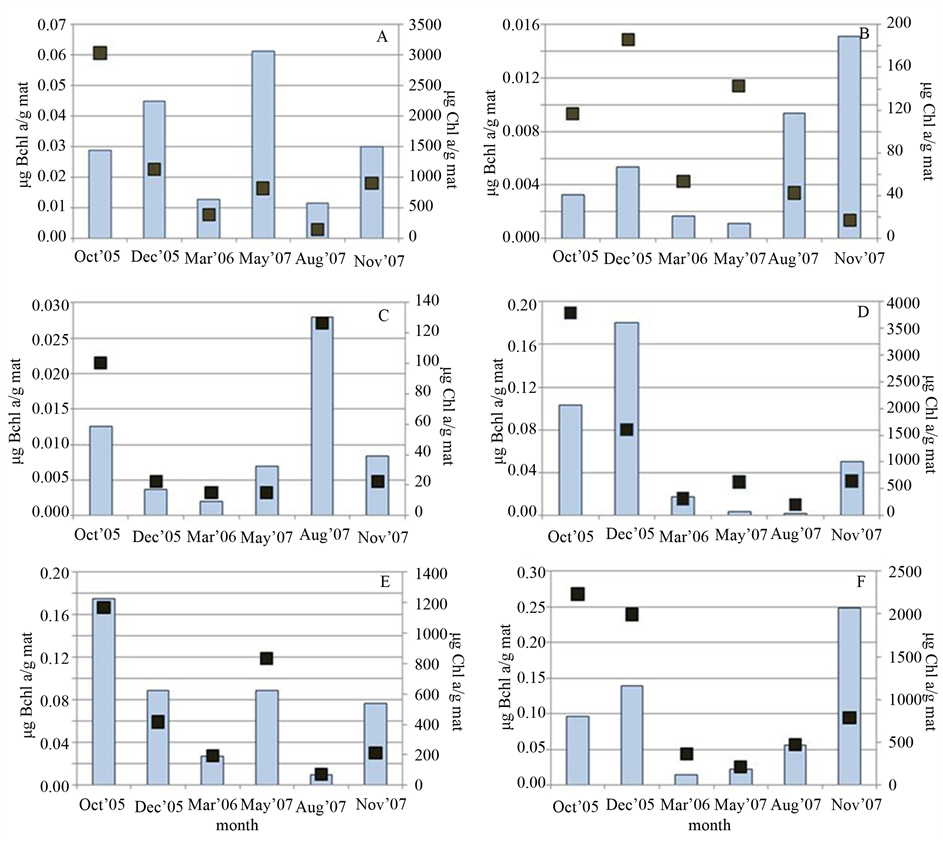
Figure 3. Comparison of mat Chl a (dark squares) and Bchl a (bars) content (in µg of pigment per gram wet mass of mat) obtained in each sampling season at (A) Site 3, (B) Site 12, (C) Site 10, (D) Site 11, (E) Site 8 and (F) Site 13.
AAP also declined to anywhere from 100 CFU/cm2 in March 2006 to non-detection (<1 CFU/cm2) in February and October 2005 and May 2007.
The second highest AAP enumeration occurred at Site 4, likely reflecting the higher oxygenation of this shallow, plant-laden pool. August 2007 sampling yielded 3.0 × 10⁴ CFU of orange ovoid AAP per cm2 of mat, equal to 35.4% of all AAP isolates, and 9.6 × 10⁵ CFU/cm2 (18.9% of total heterotrophs) in May 2005. Third was Site 8, also in May 2005 at 9.3 × 10⁴ CFU/cm2 or 9.5% of all heterotrophic isolates, followed by 1.9 × 10⁴ CFU/cm2 enumerated in May 2007.
The Site 1 Cave yielded AAP only in October 2005 (2.2 × 10³ CFU/cm2) and May 2007 (2.4 × 10² CFU/cm2). It is possible that excessive runoff, due to abnormally high precipitation in 2005, combined with any sloughing of Lower C & B mats, led to bacterial transfer higher than typically observed spring streams. The water may have transfered phototrophic bacteria from higher elevated sampling locations to Site 1 through the Cave’s overhead opening. A low maximum of 8.2 × 10² CFU/cm2 was observed at Site 10 in May 2005 and the seasonal mean for AAP at the three Thiothrix mat sites (1, 5 and 10) was a mere 90 CFU/cm2.
PNSB were abundant at Site 3 in August 2003 at 4.8 × 10⁵ CFU/cm2 with variance from as low as 90 CFU/ cm2 (February 2005) to 6.6 × 10³ and 8.1 × 10³ CFU/cm2 (May and August 2007, respectively). Unexpectedly, the next highest density was discovered within the turbulent Site 12 UMS stream at 3.15 × 10⁵ CFU/cm2 in
Table 3. Bchl a values expressed as µg Bchl/g microbial mat for Banff Springs sampling sites in select seasons. As for Chl, data were obtained from wet samples and are an underestimate of actual Bchl contained per mass of mat.
ns—not sampled.
February followed by 2.0 × 10⁵ CFU/cm2 in October 2005. Site 11 showed low PNSB counts (<200 CFU/cm2) in all seasons except autumn samplings: 1.7 × 10³ and 8.0 × 10⁴ CFU/cm2 in October 2005 and November 2007, respectively. Lowest average PNSB counts arose from the dimly lit Site 1 at an average <1 × 10² CFU/cm2, with the exception of 1.1 × 10⁴ CFU/cm2 detected in August 2007.
Rhodomicrobium-like isolates, exhibiting characteristic ovoid to elongate cells and production of exospores were one of the most frequently enumerated PNSB from all Sites excluding 1, 5 and 10. Site 7 consistently yielded highest counts from 1.3 × 10³ to over 1.0 × 10⁴ CFU/cm2 (February and October, respectively). Sites 12 and 13 proved the next most abundant in fall to early spring from 1.2 × 10² to 1.0 × 10³ CFU/cm2 (Site 12 for October and February, respectively) and 7.0 × 10² to 1.0 × 10⁴ CFU/cm2 (Site 13 in October and May 2007, respectively).
Numerous single-celled, chlorophyll a-containing algae were isolated in PNS and PS anaerobic deeps from all sites, reaching 1.8 × 10⁴ CFU/cm2 at Site 8 (October). One species of pennate diatom (30 CFU/cm2 in February) was isolated at the outflow basin.
Overall, the majority of strains cultured from PS deeps were found to be PNSB able to tolerate the chosen H2S concentration of 0.35 g/l. Aside from two isolates enriched from Sites 7 and 9 (Thiocapsaand Chlorobiumlike organisms; see following section), no other true purple or green sulfur bacteria were obtained.
3.5. Diversity of Isolated Strains
Morphologically, AAP isolated on RO included coccoid to ovoid (strains BF3, BF6, BF8), short straight rods (BF7), curved or bent rods (BF10, BF15, BF60) and long, filament-like rods (BF61, BF62). Colony color was most frequently medium to dark orange, accounting for most Bchl a-containing isolates found at every sampling site, excluding Site 9, and accounted for 2.6% to 52.4% (February 2005 and March 2006, respectively) of total Bchl-containing colonies. Low numbers of pale pink strains were BF60 (Figure 2(R)) at 10 CFU/cm2 from the basin floating mat (February 2005) and BF15 (Figure 2(S)) at 100 CFU/cm2 from Site 4 (February 2005).
Isolated AAP were divided into three groups based on absorption spectrum features. The first major group was represented by strains BF6 and BF8, closely related to Porphyrobacter tepidarius (97% 16S rRNA sequence similarity) and Erythromicrobium ramosum (98% 16S rRNA sequence similarity), respectively. In vivo spectra indicated LH1 Bchl a absorption peaks at 802 - 806 and 868 - 871 nm [36] (Figure 4(E)). No LHII was observed in either strain, though it has been found in Porphyrobacter neustonensis [37] and in E. ramosum, and is a genus-defining trait in the latter [38] . Bchl to carotenoid ratios ranged from 2.9 to 3.5 with major carotenoid

peaks at 462 and 483 - 90 nm, as seen in Por. tepidarius (Figure 4(E)). The second cluster included pink strains BF15 and BF60, related to Paracraurococcus ruber (93.7% 16S rRNA sequence similarity). The LHI complex absorbed in vivo at 868 nm with the RC near 801 nm, and spheroidene predominant near 482, 511 and 540 nm (Figure 4(F)). Carotenoic acids and spirilloxanthin are found in BF15’s closest relative, Pcr. ruber [39] . The third grouping was represented by strain BF4 in which LHI absorbs at 802 and 858-9 nm (not shown). Carotenoid peaks were observed at roughly 30 times the absorption values of Bchl a peaks, with maxima at 412, 478, 538, 584 and 635 nm. Interestingly, BF4’s closest phylogenetic relative is the non-phototrophic, non carotenoid-producing Brevundimonas diminuta [40] . Also, spectrophotometrically, an orange ovoid strain, BF62, exhibits incredibly low amounts of Bchl (LHI at 870 nm), typical of most AAP (Figure 4(G)). A second interesting feature is the sharp peak at 421 nm. While certain carotenoids can absorb near 420 nm e.g. ζ-carotene at 422 nm or neurosporene at 414 nm [41] , it is also possible the peak is the Bchl precursor Mg-protoporphyrin (normally absorbing near 416 nm). This may lend insight to the small amount of Bchl a produced [42] . Further study will be required to indentify the compound and learn what conditions either consistently induce carotenoid synthesis or interrupt Bchl synthesis in such a manner.

Figure 4. Spectral diversity from Banff spring isolates including oxygenic strains (A) LCB5, Chlorococcum and (B) Site 11 Spirulina; PNSB (C) BF49, Rubrivivax and (D) BF12, Rhodopseudomonas capsulata; AAP (E) BF6, Porphyrobacter tepidarius; (F) BF15, Paracraurococcus ruber and (G) BF62, unknown AAP; purple sulfur (H) BF28, Thiocapsa; green sulfur (I) BF27, Chlorobium and PNSB (J) BF20, Rhodopseudomonas palustris and (K) BF14, Rhodomicrobium vannielii.
PNSB were the dominant phototrophic isolates at up to 100% of pigmented Bchl a-containing cells, nearly all of which were red, purple, pink or olive green in appearance. Morphologies observed included ovoid (strain BF49; 99.9% 16S rRNA sequence similarity to Rubrivivax gelatinosus); short, curved to long rods (BF9, BF37, BF38); teardrop-shaped (BF44); and pleomorphic rods, often with tapered ends (BF23, BF33). The most abundant and widespread isolates (BF9, BF12, BF39) were morphologically and spectrally akin to Rhodobacter with absorption peaks at 871, 855 and 800 nm and carotenoids absorbing near 590, 509 and 477 nm, indicating spheroidene. Within agar deeps, colonies grew purple-pink in the upper, oxygenated zone and olive-brown in the lower anoxic area as is typical of Rba. sphaeroides in which spheroidene and hydroxyspheroidene are converted to their corresponding ketocarotenoids under oxic conditions changing from brown to red [43] . Subsequent 16S rRNA sequencing indicated the presence of Rhodopseudomonas species (BF5, BF30 and BF34, each of 99.6% 16S rRNA similarity to Rps. palustris) (Figure 2(M)). Along with other pink-red community members of similar morphology (BF39, BF51), these organisms were ubiquitous at sampling sites (from 10 to 3.1 × 10³ CFU/ml over the year) with greatest proportions observed at Site 13 (3.9 × 10⁴ CFU/ml in February) and Site 7 (from 3.0 × 10³ to 1.0 × 10⁴ CFU/ml in winter). Unique strains BF1, BF13, BF14 and BF16, phylogenetically related to Rhodomicrobium vannielii (99.6%, 98.0%, 98.6% and 99.6% 16S rRNA sequence similarity, respectively), were isolated from Sites 4, 6, 7, 8, 9, 10 and 13. As seen in BF1 (Figure 2(Q)) the strains exhibited typical ovoid to elongate-ovoid cell morphology and produced exospores, though budding cell length was often up to 0.3 μm longer than the characteristic 2.0 - 2.8 mm range. BF14 was spectrally unique, exhibiting a LHI (or possible novel pigment-protein environment) absorption maxima at 802 and 885 nm (Figure 4(K)), distinguishing it from the LHI in Rmi. vannielii which absorbs at 800 - 807 and 869 - 872 nm [44] .
One of the most dominant morphotypes and representative of a second PNSB group were the short rod to spirilloid strains (BF18, 99% 16S sequence similarity to Rps. palustris; Figure 2(M)) isolated from both PS agar deeps and PMS-containing Balch tubes. On PMS plates, these strains anaerobically produce large amounts of Bchl relative to carotenoids (ratio 1:1.7) where, as previously observed by Evans et al. [45] , the photosynthetic RC was the dominant complex with Bchl a peak maxima near 808 nm at absorbance values over four times those of the LHI peak at 878 nm (Figure 4(J)). The LHII peak appeared as a subtle shoulder to the left of LHI near 860 nm.
Another prevalent morphotype was that of strain BF9, an ovoid to short curved rod (Figure 2(L)) that grows colorless in the presence of oxygen, purple-pink microaerophilically and olive-brown in anoxically. Spectroscopy showed the LHII absorbing at 860 nm, RC at 802 nm and LHI at 874 nm. Spheroidene series carotenoids were predominant and, unlike the previous group, were produced only in a 1:2 ratio to Bchl a. 16S rRNA sequencing confirmed 98.0% relatedness to Rhodobacter capsulatus. This morphotype was found at nearly all C & B and UMS sites in every season.
Green and purple sulfur bacterial isolates included only Chlorobium-like (BF27; Figure 2(V) and Figure 4(I)) and Thiocapsa-like (BF28; Figure 2(U), Figure 4(H)) strains from Sites 9 and 7, respectively. BF27 was a deep grass green, strictly anaerobic, chain-forming coccoid to ovoid organism in liquid medium. Bchl c and the major carotenoid, chlorobactene (750 and 457 nm, respectively) were produced in a nearly 1:1 ratio (Figure 4(I)) and are both typical of the green sulfur bacterium Chlorobium limicola [46] . Cell size ranged from 0.4 - 0.8 mm in diameter and up to 1.3 mm in length, also similar to Chl. limicola. Phototaxis was exhibited with visibly denser growth along the illuminated side of the Balch tube in conjunction with buoyancy regulation, growing throughout the medium column. Only two of eight known Chlorobium species contain gas vesicles, Chl. clathratiforme and Chl. luteolum [47] . Also typical of the family was its ability to grow at low sunlight intensities (average of less than 1.3 mE·m−2·s−1 at Site 9). BF28 represented a fifth spectral group. In vivo carotenoid peaks were at 460, 487 and 516 nm, similar to Thiocapsa imhoffii [48] , suggesting spirilloxanthin as the major pigment (Figure 4(H)). RC and LHII peaks were akin to those of Thc. roseopersicina at 800 and 854 nm with a LHI shoulder at 880 nm, blue-shifted compared to that of Thc. litoralis [49] . Morphologically, BF28 most resembles Thc. imhoffii, though it did not form the characteristic tetrads (Figure 2(U)).
Cyanobacterial strains of Phormidium, Oscillatoria and Anabaena were obtained on BG11 plates. Dark green, single-celled, oxygenic phototrophs were isolated from both the aerobic and anaerobic zones of agar deeps from Site 3, 4, 6, 8 and 12 samples. These dominant organisms were morphologically similar to Aphanothece, Synechocystis, Chlorococcum (Figure 2(G)) and Dermocarpa (Figure 2(I)). The dominant cyanobacteria resembling Spirulina (Figure 3(F)) proved to be atypical regarding culturing. Contrary to approaches and media published for Spirulina and Arthrospira cultivation [50] -[52] , the species at Banff springs preferred neutral over basic pH and perished immediately in widely used Zarrouk-based medium.
Spectral analysis of oxygenic phototrophs yielded three basic absorption profiles, each of which displayed characteristic peaks of Chl a near 420 and 440 nm and in the 670 - 683 nm range [53] . The first group, obtained from single-celled isolates (Figure 4(A)), included in vivo cytochrome peaks at 414 - 416 nm, fucoxanthin within 470 - 482 nm, phycobilin at 581 - 597 nm, phycocyanin near 624 nm, Chl b or allophycocyanin at 650 - 653 nm and a disproportionately large Chl a peak at 682 - 683 nm [54] . The second group (Figure 4(B)) was obtained for Spirulina-like strains and included large, near-equal peaks of Chl a at 680 and of phycocyanin at 624 nm [55] . Third, Anabaena-like morphotypes included first group characteristics with an additional strong absorption near 569 nm in the phycobilin range [53] . The single diatom strain exhibited peaks at 491 and 581 nm, indicative of fucoxanthin; near 636 nm, suggesting phycocyanin or Chl c and a large Chl a peak at 682 nm.
3.6. Microbial Carbon Fixation Rates
Fixation of Ci was measured during five sampling trips to estimate the microbial community organic input. Five components to the quantitative measure of autotrophy were assessed in the mat: fixation by chemolithoautotrophs measured in a dark vial, fixation by all community members excluding photosystem II-containing oxygenic phototrophic organisms (via a light-exposed vial containing the photosystem II inhibitor diuron), organic production by Bchl-containing phototrophs (diuron vial minus dark vial values), production solely by photosystem II-containing oxygenic phototrophic organisms (light vial less the sum of dark and diuron vial fixation) and total community fixation (light-exposed vial) [26] (Table 6).
At each sampling trip, total community fixation was measured to be consistently greatest at Site 3 (Figure 5) with highest productivity occurring in May 2007 (177 mg C/cm2/day). The May 2007 experiment yielded highest rates at all sites except for the May 2005 samplings at combined Site “5/6” (27.47mg C/cm2/day) and Site “10/11” (41.71 mg C/cm2/day), with production values dominated by oxygenic phototrophs. Primary production was driven by Chl-containing organisms at most sites, accounting for 20% - 92% of total production except for Site 12 in November 2007 with over 40% of measured productivity by non-light-driven fixation (8.72 of 19.75 mg C/cm2/day). A possible outlier at Site 12 was the anoxygenic fixation value obtained in October of 18.9 mg C/cm2/day, accounting for 97% of the total. Site 9 showed insignificant contributions (0.12 to 2.14 mg C/cm2/day) by oxygenic phototrophic community members in all seasons except May 2007, comprising roughly 15% of a low total fixation. Productivity in the dark accounted for 40% to over 98% of the total activity at this dimly lit site, though anoxygenic phototrophic fraction values did not fluctuate in any correlative manner. This suggests that chemoautotrophy was the dominant metabolic scheme of the Phormidiumand Chlorobiaceae-like organisms at this site. Overall, the values obtained (Table 3) generally reflected the relationship of higher average temperatures and greater light availability to productivity. The seasonal pattern for all sites was similar with higher values in each May, facilitated by the increase in daylight and temperature. Change in dark fixation was insignificant at all sites except 7/8 in May and October 2005 and March.
Also evident were signs of microbial succession at Site 5/6 which vanished during the late summer of 2005. The predominance of dark fixation in the following months, accounting for ~63% of total fixation in May, could have reflected re-establishment of the mat by Thiothrix and other chemoautotrophs, as oxygenic fixation was not measured at significant rates. Colonization was followed by an increasing oxygenic phototrophic presence accounting for almost 11 mg C/cm2/day of the total 23.7 mg C/cm2/day measured, compared to 8.3 mg C/cm2/day obtained by dark fixation.
Compared to other studies of spring mat systems, the results obtained for the Banff communities indicated exceptional productivity. A study of the Microcoleus and Lyngbya-dominated marine mats of Shark Bay, Western Australia measured fixation rates as high as 1.47 mg C/cm2/day [56] , while results here comparatively range 3.7 to 120 times larger. Namsaraev et al. studied the Phormidium-, algaeand Chloroflexus-dominated mats of the alkaline Bol’sherechenskii hot (>60˚C) springs and found a maximum total community production of 1.3 g C/m2/day and a highest dark fixation rate of 0.806 g C/m2/day [57] . Converting units of area, even the lowest total community results at Banff springs exceeded the Bol’sherechenskii maximum by 9 times while the Site 3, May 2007 result of 177 mg C/cm2/day was over 1300 times greater. Maximum dark fixation at Banff occurred in May 2007 at 13.8 mg C/cm2/day, or 17 times greater. Compared to pelagic microbial dark production in an estuary of Ebro River [58] , our results ranged from 217 to over 3200 times the marine values. Oxygenic phototroph production rates from the Urinskii alkaline hot springs were found to be an average of 2.1 g C/m2/day
Table 6. Productivity of different fractions of the microbial mat community and total carbon fixation for sampling locations at the Sulphur Mountain springs in late spring, autumn and winter.
(0.21 mg C/cm2/day) at the 45˚C - 50˚C zone where Oscillatoria limosa and diatoms were predominant [59] . A maximum anoxygenic phototroph fixation value of 0.42 g C/m2/day was in the 35˚C - 40˚C zones where Chloroflexus was dominant, though this value is roughly 70 times less than that observed at the PNSand PSBdominated Banff Site 7.
3.7. Microbial Dynamics and Physella johnsoni Trends
Our working hypotheses included that 1) there would exist a correlation between cyanobacterial mat develop-
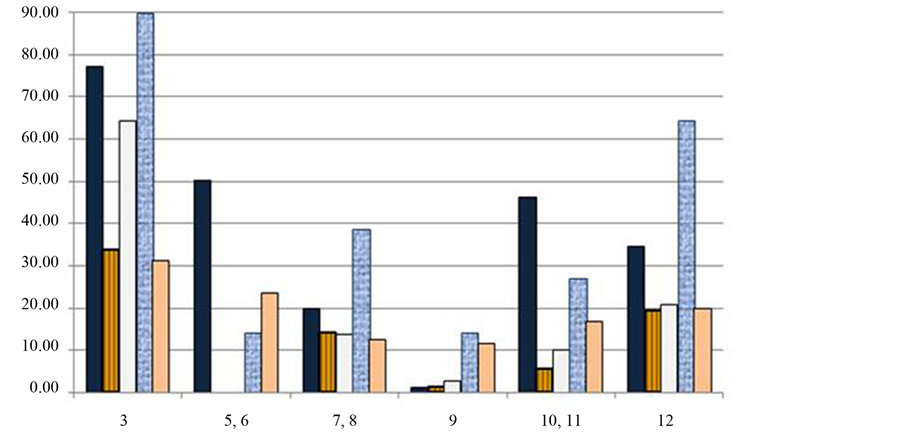
Figure 5. Seasonal comparison of total community productivity values (mg C fixed per cm2 per 24 hr) for all sampling sites. Black column, May 2005; lined, October 2005; white, March 2006; textured, May 2007 and grey, November 2007. The Site 3 May 2007 value of 176.9 mg C/cm2/24h is truncated for graph clarity. No sampling done at Sites 5 or 6 in October or March.
ment and P. johnsoni population. As primary producers of organic C, microbial photoautotrophs should form the base trophic layer in the springs. Number of anoxygenic phototrophic bacteria per cm2 of mat was only tentatively expected to be correlated to snail fluctuations as it was uncertain whether they would be directly proportional to expanse of the mat. A phototroph-snail relationship would have potentially manifested as either simultaneous high counts in each or a high development of phototrophs preceding an increase in P. johnsoni. 2) There may not be a correlation between P. johnsoni and colorless bacteria unless one is determined to exist between heterotrophs, sulfate reducing bacteria, etc. and Chland Bchl a-containing strains. It has been shown that proliferation of heterotrophic bacteria often depends upon excretion of exoplymeric substances by algae for use as carbon sources [60] and heterotrophs may also benefit from the phosphatase activity of neighboring photosynthetic organisms to uptake phosphorous [61] . If such is the case, a similar fluctuation between populations of strict organotrophs and phototrophic bacteria should occur. Conversely, opposite population trends may be expected if grazer consumption of Chland Bchl-containing organisms improved the competitive capabilities of other bacteria. Grazer impact on periphyton biomass and composition has been well-documented [6] [62] [63] . If such an impact occurred at Banff, it may be due to increased access to detrital or water column-based nutrients and snail mucous trails as carbon sources and fecal matter as phosphorous reservoirs [64] , benefitting anoxygenic phototrophs, which are primarily heterotrophic. Selection of pigmented over colorless bacteria is impossible at the scale of snail radulas, therefore it is assumed that carbon inputs from grazers that would benefit colorless organotrophs could also support photoheterotrophs. 3) Photosynthetic activity, a direct quantification of the organics available to higher trophic levels, should correlate to the fluctuation in P. johnsoni numbers [63] . Note, that while grazers tend to have impacts on periphyton biomass and taxonomic structure (over 75% of the time), they do not significantly affect overall productivity of the mat (less than 30% of the 89 experiments as reviewed by Feminella (1995) [65] ). That said, while general and significant trends appear throughout the literature, many questions remain. Studies of interactions between prokaryotes and eukaryotic microbes have often proved to be unique to the niche and species under observation.
The limited direct observations suggested a 30% - 60% difference in area covered by the mat at each of the C & B and UMS spring systems from winter to late spring. Mat thickness was variable throughout all seasons and rose dramatically in August at select sites, tripling in some areas of Site 3 between May and August 2007. The microbial mat, along with rocks, twigs and other detrital matter provides structural support for P. johnsoni. Figure 6(A) shows typical P. johnsoni orientation on the green portions of the mat; snails clinging to the epilithon to avoid being swept away by the outflow stream. An increase in mat expanse should provide increased habitat, though there was a clear lag effect as mat development and snail counts follow inverse trends. Monthly P. johnsoni counts compared to development of Sites 10 - 12 (Figure 6(C)) and 3, 5 and 6 (Figure 6(D)) expressed as a relative percentage of the maximum expanse observed in August 2003 displayed this incongruence. Highest snail counts were generally obtained February/March at Sites 10 - 12 and November/December for 3, 5 and 6, and were compared to observations of mat development. Sampling months are shown color-coded in Figure 6(E) and Figure 6(F) and correspond to the color indicating the same month of P. johnsoni enumeration in Figure 6(C) and Figure 6(D). Larger mat expanses in the summer often coincided with the trough of snail fluctuations, while larger snail populations and smaller mat area co-occurred in the winter. Common in ecology, the temporal mismatch between predator/grazer population responses to their variable resources has been referred to as “tracking inertia” [66] . From mid-October, when mat productivity and area decreased, snail population continued to increase at a similar rate, resulting in overconsumption of resources causing the beginnings of the sharp decline witnessed around February or March. Recovery of the mat in spring and typical maximum development in summer would facilitate the response in P. johnsoni by providing increased organics in the form of exopolymers and bacterial cells. Large mat areas also provide greater space for reproduction and avoidance of energy expenditures on interference behaviors, e.g. shaking shells after contact with another individual, as found in Physella virgata [63] . It has also been observed in P. virgata and others, that high snail density depresses grazing rates and, in turn, growth rates [63] [65] . A dense population can result in a crash, as many specimens would not attain sufficient growth/maturity to reproduce. Those snails that succeed at reproduction would also decline as P. johnsoni are semelparous, rearing offspring only once before dying. The hatching of young molluscs then coincides with a seasonal decline/sloughing phase of the mat, thus creating the temporal mismatch suggested by Figure 6.
The near complete loss of several microbial sampling sites at the LCB in mid 2005 to early 2006 corresponded to record breaking rainfall in August 2004 and June and September 2005. An effect was also witnessed on the LCB snail population: from 2852 snails counted in February 2005, numbers plummeted to only 40 specimens in 5 months and took 8 months to recover to 1592 [3] . Mat expanse and snail numbers at the UMS Sites 10, 11 and 12 decreased drastically, suggesting a connection to the excessive rainfall, the decrease in mat area or, likely, both.
Areas for the snail censuses that were comparable in size and held consistent qualitative bacterial dominance included Site 5/6 (Oscillatoria-dominated), 10/11 (Spirulina-dominated) and 12 (Oscillatoria, Phormidium and Thiothrix co-dominant). Highest values in 2007 at these three sites were 2401, 1149 and 7264 snails, respectively [3] . For comparison, populations in 2006 reached 1592 at Site 5/6 in April, 1569 at Site 10/11 in January and only 1260 at Site 12. The Site 12 “peak” was in August 2007, but occurred in the midst of an 11-month decline that began the previous November from a population of 3054 snails. Previous to 2005, the maxima were 2852 snails at Site 5/6, 2151 at Site 10/11 and 5052 at Site 12. As the same morphotypes were dominant at these sites at each peak of the snail population cycle, the lack of significant difference between Site 5/6 and 10/11 values suggests there was no advantage for P. johnsoni survival grazing on Oscillatoria or Spirulina—dominated mats.
Calculating the average number of months between maximum and minimum snail census values at the LCB and UMS sites (from 2001 to 2007) showed approximately nine month cycles at Site 5/6, just over seven months at Site 10/11, and about six and a half months at Site 12. June most frequently had lowest snail enumeration values. The longer average rise at 5/6 was influenced more by the extended recovery period necessary after the 2005 microbial mat habitat loss than by the difference in dominant species at each site, but Site 12 Thiothrix could be suggested as influential in the quicker recovery of P. johnsoni. This was also suggested in 2007 by Lepitzki [3] when an offshoot of the UCB stream was observed to harbor thick Thiothrix mats that were quickly colonized by migrant snails, suggesting a less selective and more opportunistic approach to their food choices. Unfortunately, the mat was not observed at its infancy to identify the founding component of the microbial community. At the UMS system it was often seen that below the layers of Thiothrix there was a hidden layer of Phormidium, suggesting that oxygenic phototrophs are the pioneers, providing a scaffold that Thiothrix can overtake.
Figure 7 compares chemolithotrophic and oxygenic photosynthesis-driven carbon fixation at Sites 3, 10/11 and 12 to select months of P. johnsoni enumeration. As observed for area of mat, maximal total community fixation at Sites 3 (Figure 7(A)) and 10/11 (Figure 7(B)) appeared to occur during the periods of lowest snail pop-
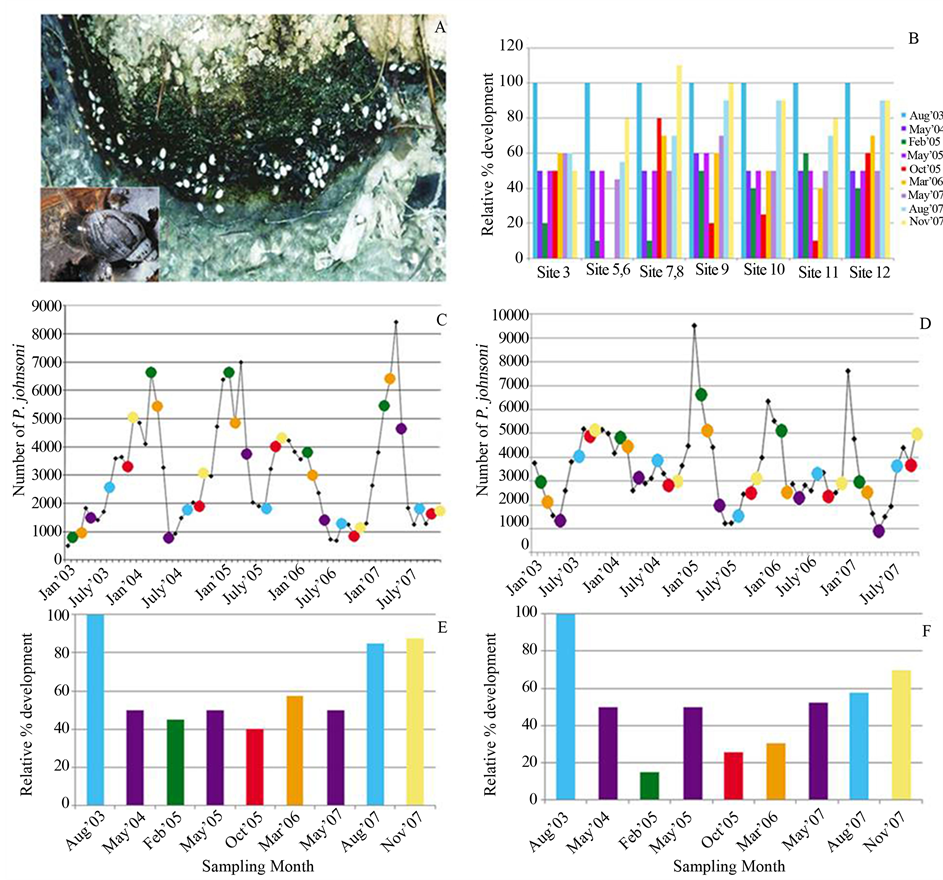
Figure 6. Physella johnsoni and changes in mat area. (A) Photograph of P. johnsoni atop cyanobacterial growth at the UMS. Inset: Close-up of the snail. (B) Relative percent development of select sites compared to the maximum expanse (i.e. 100%) observed in August 2003. (C) Sampling months color-coded atop a graph of monthly snail counts at Sites 10-12. Colors correspond to sampling months on the X-axis of Panel E. (D) Sampling months color-coded atop on a graph of monthly snail counts at Sites 3, 5 and 6 combined. Colors correspond to sampling months on the X-axis of Panel F. (E) Bar chart of the averaged relative percent development for Sites 10-12. (F) Bar chart of the averaged relative percent development for Sites 3, 5 and 6 (due to loss of locations 5 and 6, October and March values are Site 3 only).
ulations. Site 3 May 2005 and 2007 values were a clear example, in that over twice the productivity (77 to 177 mg C/cm2/24h) occurred at times when 1/3 less snails (721 down to 526) were present. That large May 2007 value occurred just as the slow increase in P. johnsoni numbers began until the last C-fixation measurement in November 2007 revealed incredibly low photosynthetic activity. While intense grazing pressures could have physically damaged cyanobacteria and the autotrophic capabilities of other mat surface members, C-fixation rates fluctuate in the same way as mat expanse and snail numbers. The temporal lag of a population catching up to available resources, the aforementioned tracking inertia, may be inferred by the rudimentary patterns obtained at Sites 3 and 10/11.
Visually, Site 12 (Figure 7(C)) does not suggest the mismatch between P. johnsoni numbers and production of organics as well as the other two locations. This might have been a result of the mat composition as Site 12 is
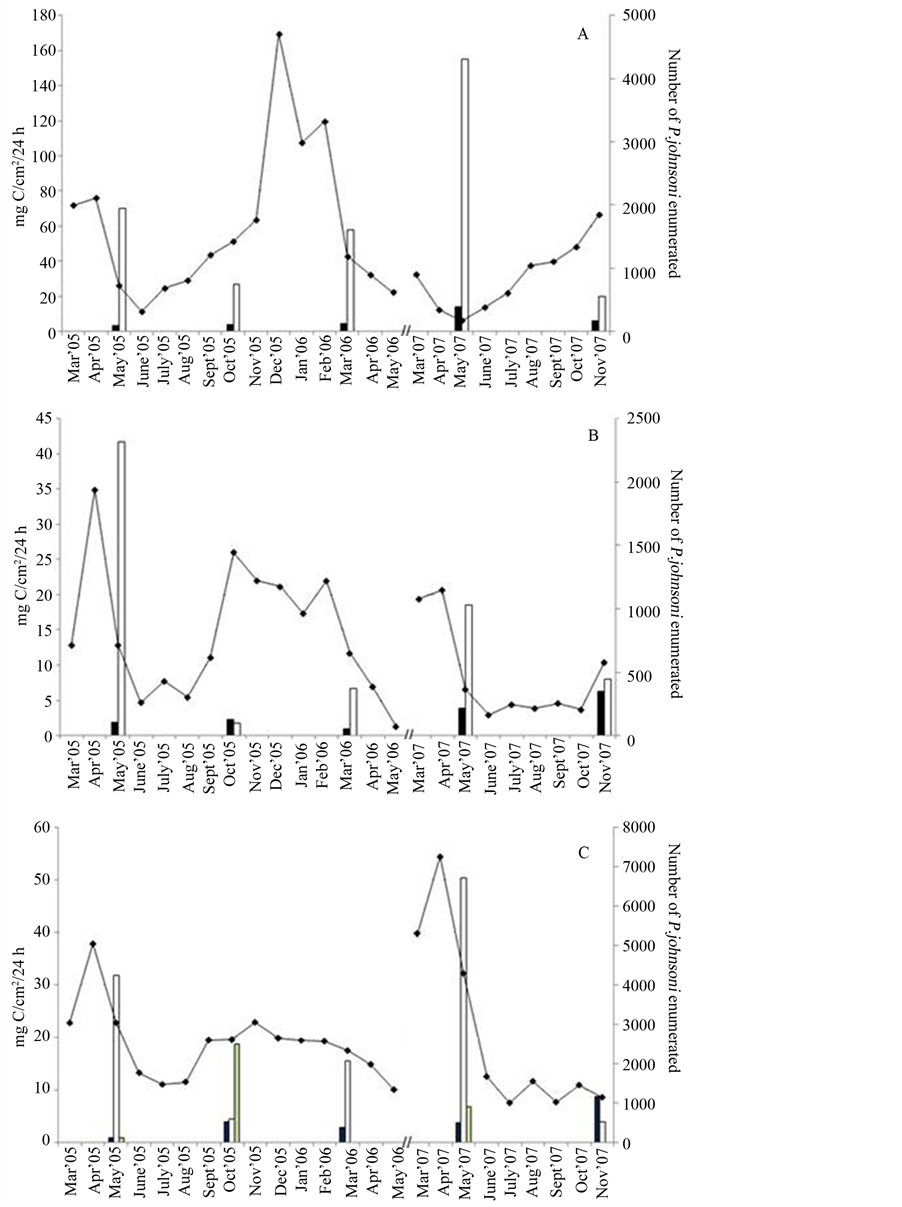
Figure 7. Photosynthetic activity reflected in mg of carbon fixed per cm2 of mat over 24 h (primary axis) compared to monthly P. johnsoni counts (secondary axis) for (A) Site 3, (B) Site 10, 11 and (C) Site 12. Black bars, protein production in the dark; white bars, fixation by oxygenic phototrophs; grey bars (in C only), anoxygenic phototrophic fixation; line, P. johnsoni enumeration.
nearly equally dominated by Thiothrix and oxygenic phototrophs. While Thiothrix does have chemoautotrophic capabilities (which may explain the large November 2007 dark-fixation result), the fixation at this site was driven by oxygenic and anoxygenic phototrophs. If large numbers of snails were present and consuming Thiothrix more often, whether by accident or not, the result could then be to exert less grazing pressure/damage on phototrophic and photosynthetic bacteria.
A comparison of Chl a content extracted from Sites 3, 10/11 and 12 to enumeration of P. johnsoni is shown in Figures 8(A)-(C), respectively. While lacking many replicates, the graphs may indicate a rough correlation. Density of nutritive photopigments in prokaryotes is typically highest when day length is shortest and light intensity is lowest (late fall and winter), and snail population fluctuated in a similar manner with higher numbers at low-light periods of the year. An increase in the concentration or density of nutrients could result in a decrease in the grazing distance and energy expenditures necessary for snails to feed to attain reproductive capabilities. A larger sample set would be required to clearly identify mat Chl concentration as a predictor of snail numbers changes.
In summary, observations of the Sulphur Mountain thermal spring microbial mats showed a diverse matrix of prokaryotic and eukaryotic phototrophs that did not significantly vary in membership over the year, while mat area fluctuated greatly by season. Consistent major mat-forming oxygenic phototrophs included Phormidium-, Spirulina-, and Oscillatoria-like cyanobacteria and single-celled algal species resembling genera Chlorocococcum, Dermocarpa and Aphanothece. PNSB Rhodobacter, Rhodopseudomonas, Rhodomicrobium and Rubrivivax were the most commonly isolated photoheterotrophs, followed by AAP Erythromicrobium and Porphyrobacter species.
This investigation of Sulphur Mountain springs focused on six microbiological components compared to the fluctuation of P. johnsoni: observed microbial mat expanse, dominant morphotypes in various seasons, chlorophyll content, photosynthetic activity and enumeration of Bchl a-containing strains and colorless, heterotrophic bacteria. Regarding our first working hypothesis, positive correlations between density of Bchl-containing strains and P. johnsoni were found at three of five sampling locations, while no relationship was found in the vicinity of the UCB purple mat and a weak negative slope resulted at Site 5/6, likely influenced by dramatic precipitation and sloughing events. The most consistent indicator of snail numbers at the time of sampling appeared to be Chl content per unit mass of the mat. This is logical as photosynthetic activity was at its greatest in warmer months when snails were at their lowest numbers resulting in abundance of exopolymeric substance production (thus decreasing pigment proportion per unit weight) and a decrease in cellular Chl compared to the levels required to harvest fall and winter season luminosity.
Qualitative assessments of microbial proliferation were made visually by examining the area spanned by the microbial mat at each site relative to the maximum expanse observed in August of 2003. Juxtaposed to P. johnsoni population counts from Lepitzki (2002) [5] , the trend was that lowest mat development correlated with highest snail counts. This was followed by a severe snail population decrease during mat rebuilding to maximum expanse then an approximate 7-month decline in development while snail numbers grew to their peak. Snail fecundity therefore appeared to be dependent on mat components, allowing continued reproduction of P. johnsoni during its decline. An important note to make regarding the analysis is that what was significant from a statistical perspective may not reflect biological significance. An approximate 20% difference in grazing area may beg the question of significance, but much of the mat expanse was already unavailable to P. johnsoni due to turbulent water, rocks or branches and other obstacles. Any further limit in territory may have contributed to the influences of increased mollusc density that can include physical interference between specimens.
Another physid, P. virgata tended to reproduce only after attaining a certain shell diameter and that threshold size increased in the presence of an environmental stress such as a predator [67] . This trait, possibly shared by P. johnsoni, extends the risk of fatality by other means before rearing offspring, thus emphasizing the importance of suitable grazing area.
Cyanobacteria serve as primary producers of organics such as glycolate during photorespiration, or fermentation products of acetate, ethanol, lactate and other simple compounds which facilitate growth of heterotrophic and other bacteria that may be nutritionally significant to P. johnsoni. Studies have provided examples of filamentous cyanobacteria being integral to mollusc diets in some cases, while a preference towards phototrophic eukaryotes, heterotrophic bacteria and detritus occur in others [68] . The case for P. johnsoni is uncertain. If detritus was a major source of carbon for P. johnsoni as in many Physa species [62] , it still follows that a larger mat area traps more material thus increasing accessibility [10] . As mats at Sites 3, 5/6 and 8 were built upon
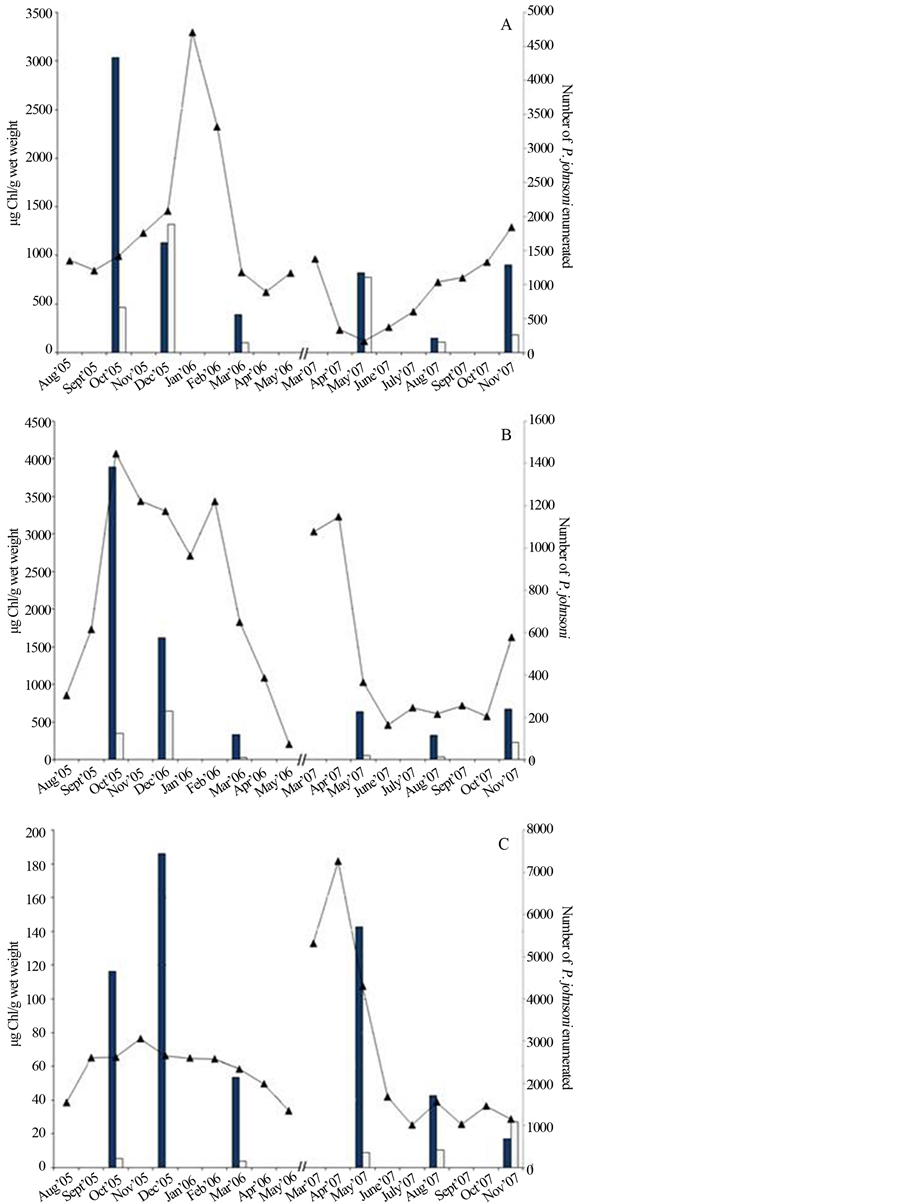
Figure 8. Chlorophyll a and b extracted from mat samples in select months compared to monthly enumeration of P. johnsoni. (A) Data from Site 3, C & B floating mat; (B) combined data from Sites 10 and 11 at the UMS and (C) Site 12. Black bars, Chl a; white bars, Chl b; line, P. johnsoni enumeration.
forest debris, it is likely some detritus consumption occurred, however, snails tended to be positioned directly upon bacterial formations rather than forest litter. Animal byproducts were not likely available in any significant amounts as few terrestrial species have been observed at the springs [5] . Due to strict controls on the availability of test specimens of P. johnsoni, an aspect lacking in the study was direct experimentation with the snail in controlled grazing environments as other studies have performed [69] [70] or gut content analysis. These analyses may provide definite conclusions as to which of the myriad of available organics are foundational in P. johnsoni nutrition.
Acknowledgements
This research was funded by grants from Parks Canada Species at Risk Recovery Action and Education Fund, a program supported by the National Strategy for the Protection of Species at Risk, to C. P. and V. Y. and from the NSERC of Canada to V. Y.
NOTES
*Corresponding author.