Paper Menu >>
Journal Menu >>
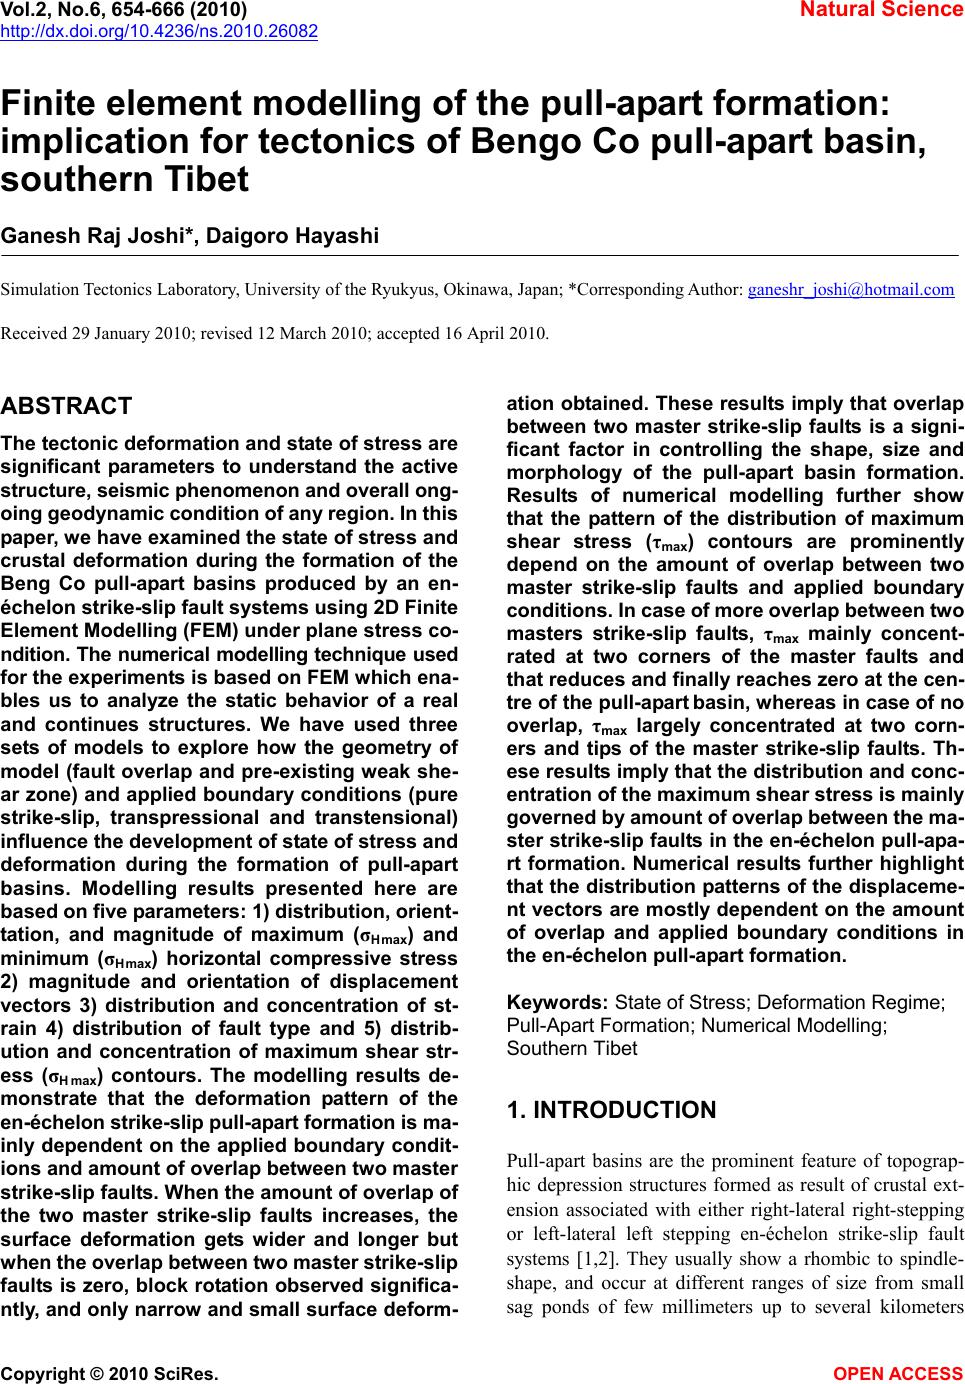 Vol.2, No.6, 654-666 (2010) Natural Science http://dx.doi.org/10.4236/ns.2010.26082 Copyright © 2010 SciRes. OPEN ACCESS Finite element modelling of the pull-apart formation: implication for tectonics of Bengo Co pull-apart basin, southern Tibet Ganesh Raj Joshi*, Daigoro Hayashi Simulation Tectonics Laboratory, University of the Ryukyus, Okinawa, Japan; *Corresponding Author: ganeshr_joshi@hotmail.com Received 29 January 2010; revised 12 March 2010; accepted 16 April 2010. ABSTRACT The tectonic deformation and state of stress are significant parameters to understand the active structure, seismic phenomenon and overall ong- oing geodynamic condition of any region. In this paper, we have examined the state of stress and crustal deformation during the formation of the Beng Co pull-apart basins produced by an en- échelon strike-slip fault systems using 2D Finite Element Modelling (FEM) under plane stress co- ndition. The numerical modelling technique used for the experiments is based on FEM which ena- bles us to analyze the static behavior of a real and continues structures. We have used three sets of models to explore how the geometry of model (fault overlap and pre-existing weak she- ar zone) and applied boundary conditions (pure strike-slip, transpressional and transtensional) influence the development of state of stress and deformation during the formation of pull-apart basins. Modelling results presented here are based on five parameters: 1) distribution, orient- tation, and magnitude of maximum (σH max) and minimum (σH max) horizontal compressive stress 2) magnitude and orientation of displacement vectors 3) distribution and concentration of st- rain 4) distribution of fault type and 5) distrib- ution and concentration of maximum shear str- ess (σH max) contours. The modelling results de- monstrate that the deformation pattern of the en-échelon strike-slip pull-apart formation is ma- inly dependent on the applied boundary condit- ions and amount of overlap between two master strike-slip faults. When the amount of overlap of the two master strike-slip faults increases, the surface deformation gets wider and longer but when the overlap between two master strike-slip faults is zero, block rotation observed significa- ntly, and only narrow and small surface deform- ation obtained. These results imply that overlap between two master strike-slip faults is a signi- ficant factor in controlling the shape, size and morphology of the pull-apart basin formation. Results of numerical modelling further show that the pattern of the distribution of maximum shear stress (τmax) contours are prominently depend on the amount of overlap between two master strike-slip faults and applied boundary conditions. In case of more overlap between two masters strike-slip faults, τmax mainly concent- rated at two corners of the master faults and that reduces and finally reaches zero at the cen- tre of the pull-apart basin, whereas in case of no overlap, τmax largely concentrated at two corn- ers and tips of the master strike-slip faults. Th- ese results imply that the distribution and conc- entration of the maximum shear stress is mainly governed by amount of overlap between the ma- ster strike-slip faults in the en-échelon pull-apa- rt formation. Numerical results further highlight that the distribution patterns of the displaceme- nt vectors are mostly dependent on the amount of overlap and applied boundary conditions in the en-échelon pull-apart formation. Keywords: State of Stress; Deformation Regime; Pull-Apart Formation; Numerical Modelling; Southern Tibet 1. INTRODUCTION Pull-apart basins are the prominent feature of topograp- hic depression structures formed as result of crustal ext- ension associated with either right-lateral right-stepping or left-lateral left stepping en-échelon strike-slip fault systems [1,2]. They usually show a rhombic to spindle- shape, and occur at different ranges of size from small sag ponds of few millimeters up to several kilometers 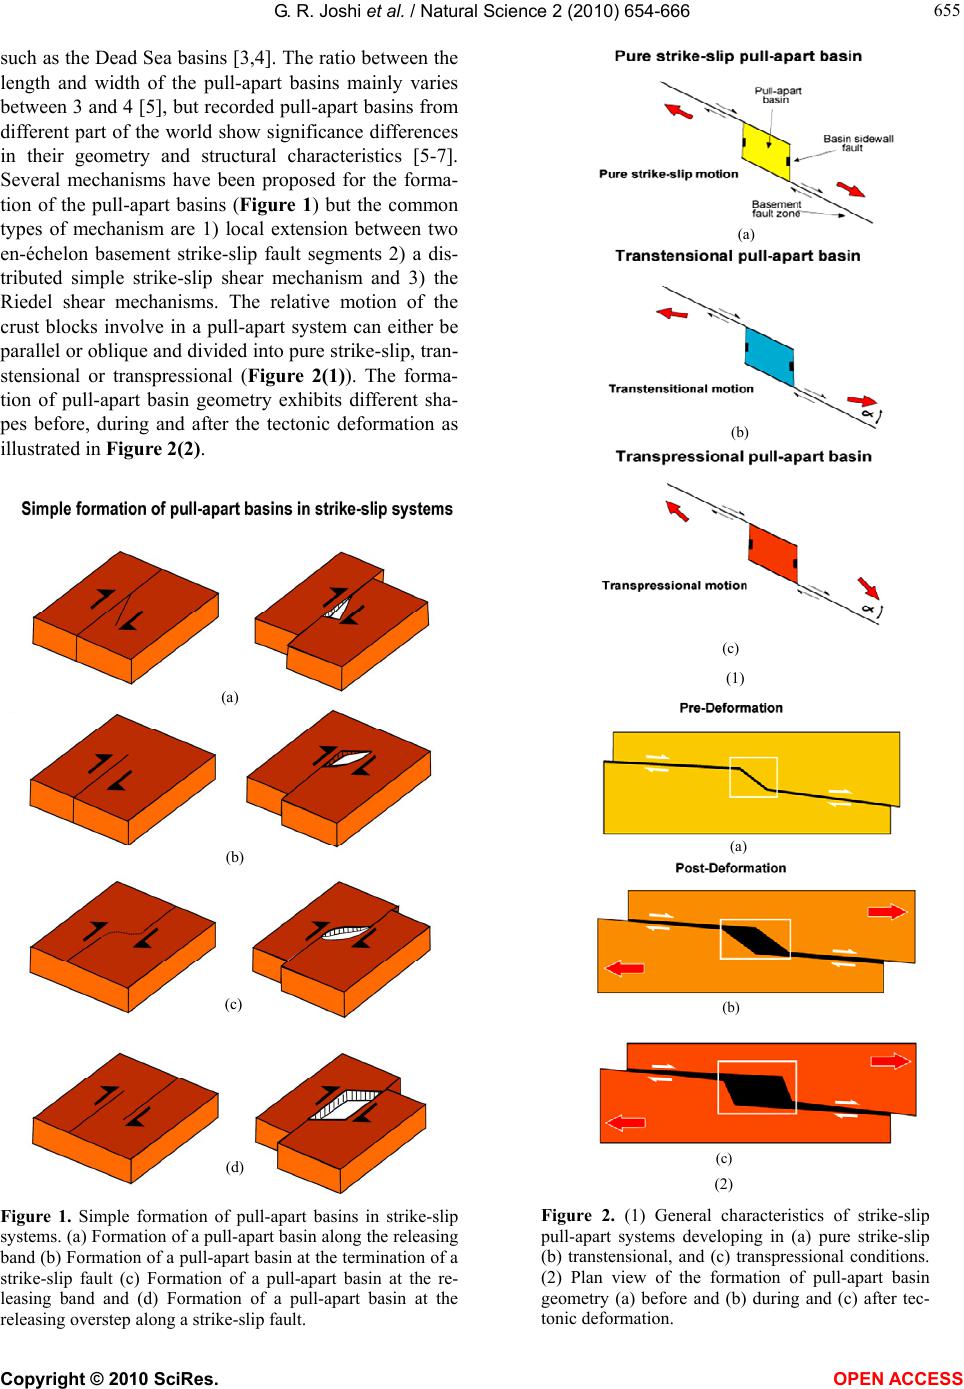 G. R. Joshi et al. / Natural Science 2 (2010) 654-666 Copyright © 2010 SciRes. OPEN ACCESS 655 655 such as the Dead Sea basins [3,4]. The ratio between the length and width of the pull-apart basins mainly varies between 3 and 4 [5], but recorded pull-apart basins from different part of the world show significance differences in their geometry and structural characteristics [5-7]. Several mechanisms have been proposed for the forma- tion of the pull-apart basins (Figure 1) but the common types of mechanism are 1) local extension between two en-échelon basement strike-slip fault segments 2) a dis- tributed simple strike-slip shear mechanism and 3) the Riedel shear mechanisms. The relative motion of the crust blocks involve in a pull-apart system can either be parallel or oblique and divided into pure strike-slip, tran- stensional or transpressional (Figure 2(1)). The forma- tion of pull-apart basin geometry exhibits different sha- pes before, during and after the tectonic deformation as illustrated in Figure 2(2). (a) (b) (c) (d) Figure 1. Simple formation of pull-apart basins in strike-slip systems. (a) Formation of a pull-apart basin along the releasing band (b) Formation of a pull-apart basin at the termination of a strike-slip fault (c) Formation of a pull-apart basin at the re- leasing band and (d) Formation of a pull-apart basin at the releasing overstep along a strike-slip fault. (a) ( b ) (c) (1) (a) ( b ) (c) (2) Figure 2. (1) General characteristics of strike-slip pull-apart systems developing in (a) pure strike-slip (b) transtensional, and (c) transpressional conditions. (2) Plan view of the formation of pull-apart basin geometry (a) before and (b) during and (c) after tec- tonic deformation. 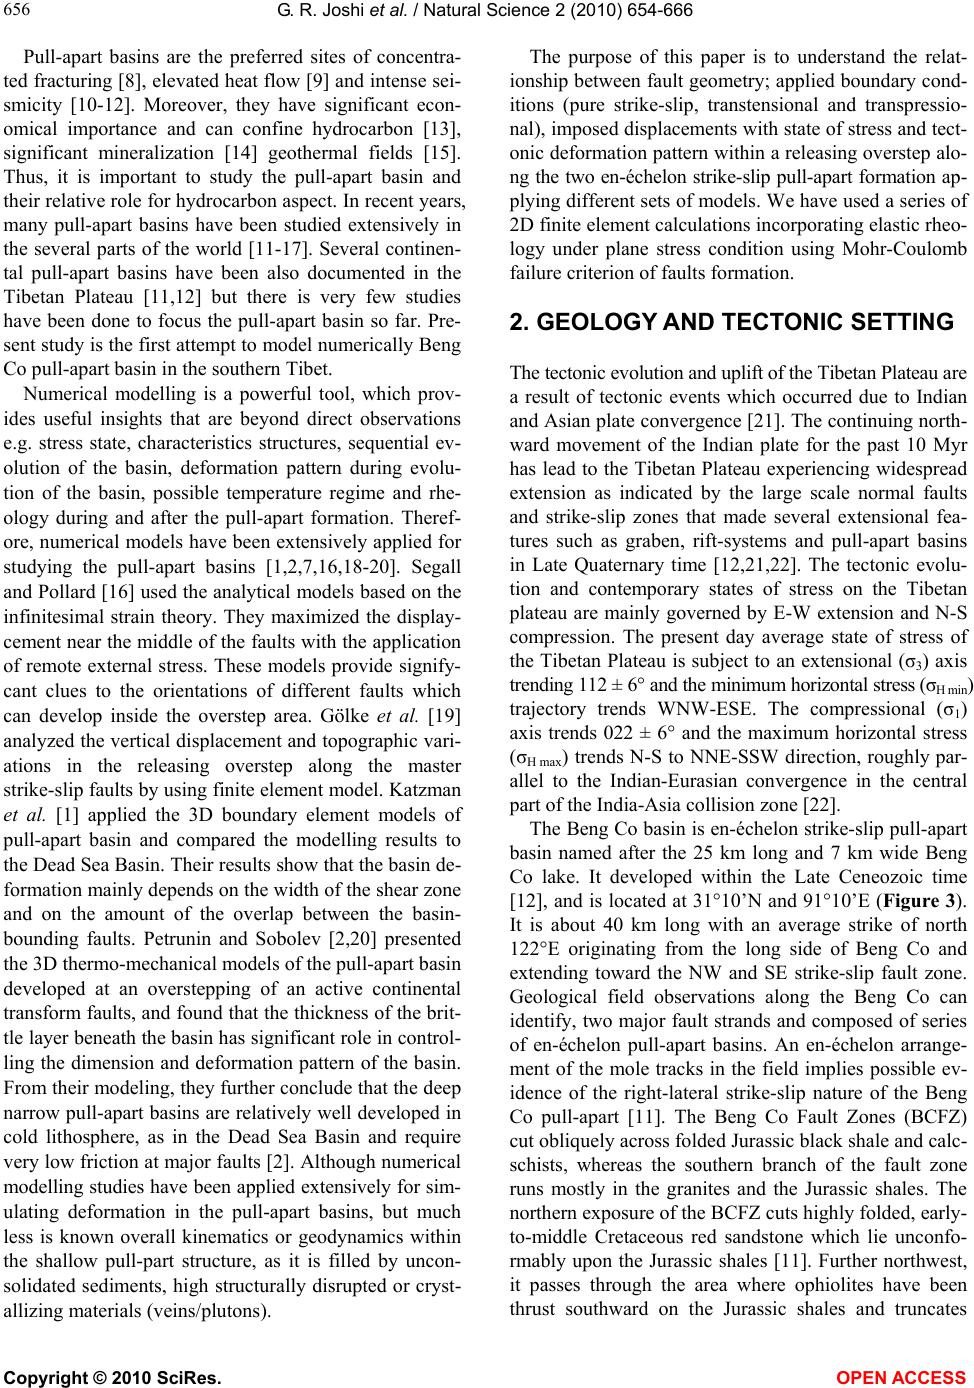 G. R. Joshi et al. / Natural Science 2 (2010) 654-666 Copyright © 2010 SciRes. OPEN ACCESS 656 Pull-apart basins are the preferred sites of concentra- ted fracturing [8], elevated heat flow [9] and intense sei- smicity [10-12]. Moreover, they have significant econ- omical importance and can confine hydrocarbon [13], significant mineralization [14] geothermal fields [15]. Thus, it is important to study the pull-apart basin and their relative role for hydrocarbon aspect. In recent years, many pull-apart basins have been studied extensively in the several parts of the world [11-17]. Several continen- tal pull-apart basins have been also documented in the Tibetan Plateau [11,12] but there is very few studies have been done to focus the pull-apart basin so far. Pre- sent study is the first attempt to model numerically Beng Co pull-apart basin in the southern Tibet. Numerical modelling is a powerful tool, which prov- ides useful insights that are beyond direct observations e.g. stress state, characteristics structures, sequential ev- olution of the basin, deformation pattern during evolu- tion of the basin, possible temperature regime and rhe- ology during and after the pull-apart formation. Theref- ore, numerical models have been extensively applied for studying the pull-apart basins [1,2,7,16,18-20]. Segall and Pollard [16] used the analytical models based on the infinitesimal strain theory. They maximized the display- cement near the middle of the faults with the application of remote external stress. These models provide signify- cant clues to the orientations of different faults which can develop inside the overstep area. Gölke et al. [19] analyzed the vertical displacement and topographic vari- ations in the releasing overstep along the master strike-slip faults by using finite element model. Katzman et al. [1] applied the 3D boundary element models of pull-apart basin and compared the modelling results to the Dead Sea Basin. Their results show that the basin de- formation mainly depends on the width of the shear zone and on the amount of the overlap between the basin- bounding faults. Petrunin and Sobolev [2,20] presented the 3D thermo-mechanical models of the pull-apart basin developed at an overstepping of an active continental transform faults, and found that the thickness of the brit- tle layer beneath the basin has significant role in control- ling the dimension and deformation pattern of the basin. From their modeling, they further conclude that the deep narrow pull-apart basins are relatively well developed in cold lithosphere, as in the Dead Sea Basin and require very low friction at major faults [2]. Although numerical modelling studies have been applied extensively for sim- ulating deformation in the pull-apart basins, but much less is known overall kinematics or geodynamics within the shallow pull-part structure, as it is filled by uncon- solidated sediments, high structurally disrupted or cryst- allizing materials (veins/plutons). The purpose of this paper is to understand the relat- ionship between fault geometry; applied boundary cond- itions (pure strike-slip, transtensional and transpressio- nal), imposed displacements with state of stress and tect- onic deformation pattern within a releasing overstep alo- ng the two en-échelon strike-slip pull-apart formation ap- plying different sets of models. We have used a series of 2D finite element calculations incorporating elastic rheo- logy under plane stress condition using Mohr-Coulomb failure criterion of faults formation. 2. GEOLOGY AND TECTONIC SETTING The tectonic evolution and uplift of the Tibetan Plateau are a result of tectonic events which occurred due to Indian and Asian plate convergence [21]. The continuing north- ward movement of the Indian plate for the past 10 Myr has lead to the Tibetan Plateau experiencing widespread extension as indicated by the large scale normal faults and strike-slip zones that made several extensional fea- tures such as graben, rift-systems and pull-apart basins in Late Quaternary time [12,21,22]. The tectonic evolu- tion and contemporary states of stress on the Tibetan plateau are mainly governed by E-W extension and N-S compression. The present day average state of stress of the Tibetan Plateau is subject to an extensional (σ3) axis trending 112 ± 6° and the minimum horizontal stress (σH min) trajectory trends WNW-ESE. The compressional (σ1) axis trends 022 ± 6° and the maximum horizontal stress (σH max) trends N-S to NNE-SSW direction, roughly par- allel to the Indian-Eurasian convergence in the central part of the India-Asia collision zone [22]. The Beng Co basin is en-échelon strike-slip pull-apart basin named after the 25 km long and 7 km wide Beng Co lake. It developed within the Late Ceneozoic time [12], and is located at 31°10’N and 91°10’E (Figure 3). It is about 40 km long with an average strike of north 122°E originating from the long side of Beng Co and extending toward the NW and SE strike-slip fault zone. Geological field observations along the Beng Co can identify, two major fault strands and composed of series of en-échelon pull-apart basins. An en-échelon arrange- ment of the mole tracks in the field implies possible ev- idence of the right-lateral strike-slip nature of the Beng Co pull-apart [11]. The Beng Co Fault Zones (BCFZ) cut obliquely across folded Jurassic black shale and calc- schists, whereas the southern branch of the fault zone runs mostly in the granites and the Jurassic shales. The northern exposure of the BCFZ cuts highly folded, early- to-middle Cretaceous red sandstone which lie unconfo- rmably upon the Jurassic shales [11]. Further northwest, it passes through the area where ophiolites have been thrust southward on the Jurassic shales and truncates 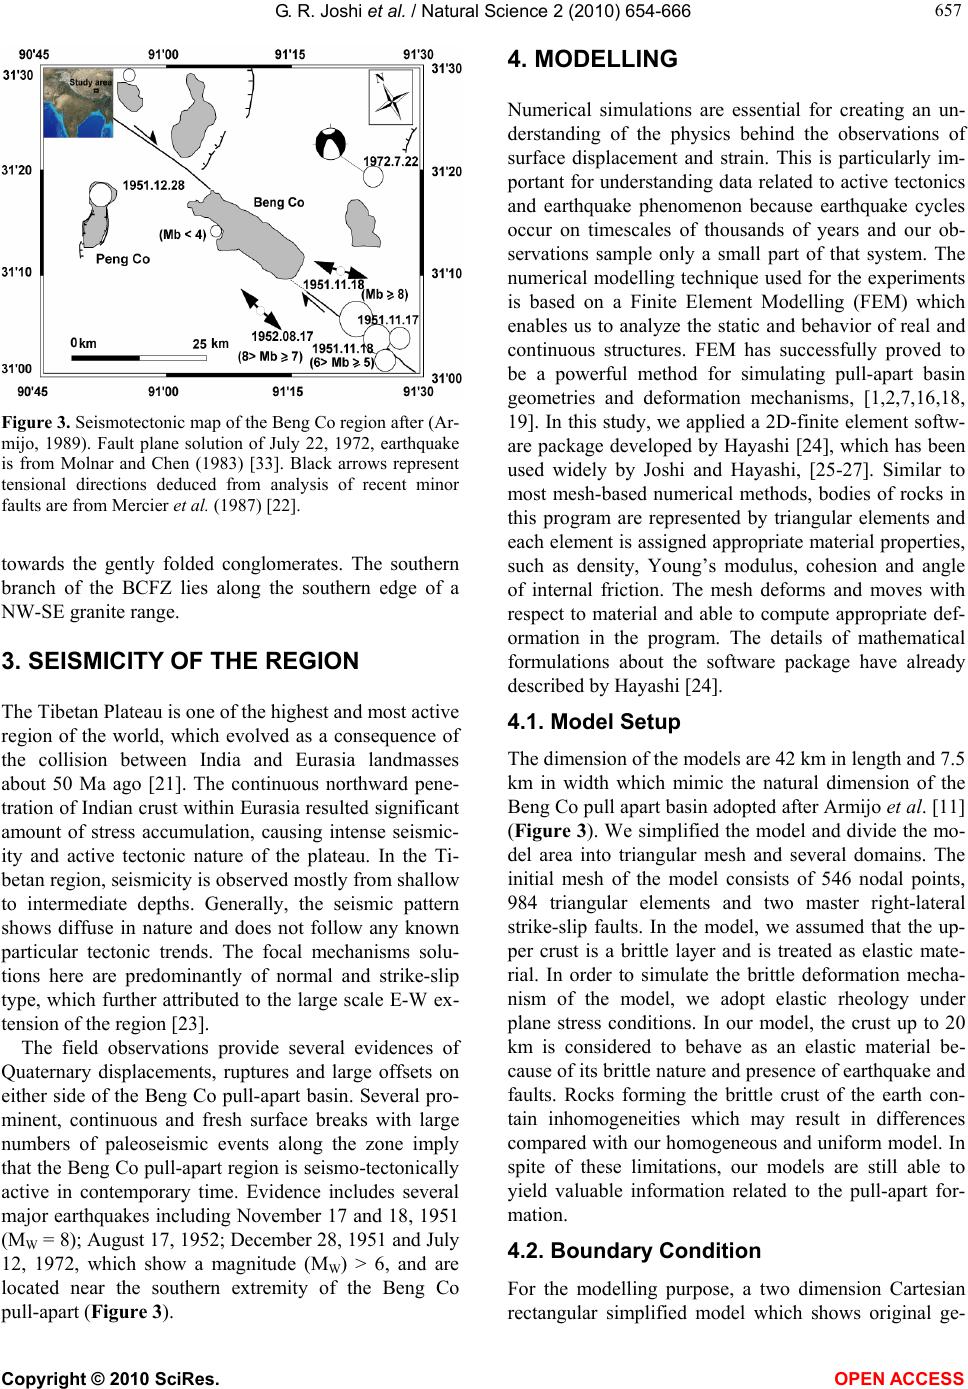 G. R. Joshi et al. / Natural Science 2 (2010) 654-666 Copyright © 2010 SciRes. OPEN ACCESS 657 657 Figure 3. Seismotectonic map of the Beng Co region after (Ar- mijo, 1989). Fault plane solution of July 22, 1972, earthquake is from Molnar and Chen (1983) [33]. Black arrows represent tensional directions deduced from analysis of recent minor faults are from Mercier et al. (1987) [22]. towards the gently folded conglomerates. The southern branch of the BCFZ lies along the southern edge of a NW-SE granite range. 3. SEISMICITY OF THE REGION The Tibetan Plateau is one of the highest and most active region of the world, which evolved as a consequence of the collision between India and Eurasia landmasses about 50 Ma ago [21]. The continuous northward pene- tration of Indian crust within Eurasia resulted significant amount of stress accumulation, causing intense seismic- ity and active tectonic nature of the plateau. In the Ti- betan region, seismicity is observed mostly from shallow to intermediate depths. Generally, the seismic pattern shows diffuse in nature and does not follow any known particular tectonic trends. The focal mechanisms solu- tions here are predominantly of normal and strike-slip type, which further attributed to the large scale E-W ex- tension of the region [23]. The field observations provide several evidences of Quaternary displacements, ruptures and large offsets on either side of the Beng Co pull-apart basin. Several pro- minent, continuous and fresh surface breaks with large numbers of paleoseismic events along the zone imply that the Beng Co pull-apart region is seismo-tectonically active in contemporary time. Evidence includes several major earthquakes including November 17 and 18, 1951 (MW = 8); August 17, 1952; December 28, 1951 and July 12, 1972, which show a magnitude (MW) > 6, and are located near the southern extremity of the Beng Co pull-apart (Figure 3). 4. MODELLING Numerical simulations are essential for creating an un- derstanding of the physics behind the observations of surface displacement and strain. This is particularly im- portant for understanding data related to active tectonics and earthquake phenomenon because earthquake cycles occur on timescales of thousands of years and our ob- servations sample only a small part of that system. The numerical modelling technique used for the experiments is based on a Finite Element Modelling (FEM) which enables us to analyze the static and behavior of real and continuous structures. FEM has successfully proved to be a powerful method for simulating pull-apart basin geometries and deformation mechanisms, [1,2,7,16,18, 19]. In this study, we applied a 2D-finite element softw- are package developed by Hayashi [24], which has been used widely by Joshi and Hayashi, [25-27]. Similar to most mesh-based numerical methods, bodies of rocks in this program are represented by triangular elements and each element is assigned appropriate material properties, such as density, Young’s modulus, cohesion and angle of internal friction. The mesh deforms and moves with respect to material and able to compute appropriate def- ormation in the program. The details of mathematical formulations about the software package have already described by Hayashi [24]. 4.1. Model Setup The dimension of the models are 42 km in length and 7.5 km in width which mimic the natural dimension of the Beng Co pull apart basin adopted after Armijo et al. [11] (Figure 3). We simplified the model and divide the mo- del area into triangular mesh and several domains. The initial mesh of the model consists of 546 nodal points, 984 triangular elements and two master right-lateral strike-slip faults. In the model, we assumed that the up- per crust is a brittle layer and is treated as elastic mate- rial. In order to simulate the brittle deformation mecha- nism of the model, we adopt elastic rheology under plane stress conditions. In our model, the crust up to 20 km is considered to behave as an elastic material be- cause of its brittle nature and presence of earthquake and faults. Rocks forming the brittle crust of the earth con- tain inhomogeneities which may result in differences compared with our homogeneous and uniform model. In spite of these limitations, our models are still able to yield valuable information related to the pull-apart for- mation. 4.2. Boundary Condition For the modelling purpose, a two dimension Cartesian rectangular simplified model which shows original ge-  G. R. Joshi et al. / Natural Science 2 (2010) 654-666 Copyright © 2010 SciRes. OPEN ACCESS 658 ometry of the Beng Co pull-apart basin has been adopted after Armijo et al. [11] (Figure 4). Far-field plate veloc- ity boundary conditions are enforced at the either side of the Beng Co Fault Zones (BCFZ). The brittle crust is divided into three simple domains, which may exhibit dissimilar rock layer properties. Domain 1 and 2 repre- sent the southern and northern flank of the pre-existing BCFZ, and domain 3 represents surrounding regions. We consider typical two types of models 1) a model with a pre-existing pull-apart basin and 2) a model without pre-existing pull-apart basin. The model without a pre-existing pull-apart basin is further tested into differ- ent overlap/separation ratios (Model B and Model C). We imposed three types of reasonable boundary condi- tions to mimic the possible natural strike-slip environm- ent of the pull-apart formation. These displacement bou- ndary conditions are 1) pure strike-slip 2) transtensi- onal and 3) transpressional conditions (Figure 4). The empirical 100 to 500 m displacements were imposed from northern-left and southern-right corners in different boundary environments, and only 10% of imposed dis- placement is considered for transtensional and transpres- sional conditions for modelling (Figure 4). 4.2.1. BC1: Pure Strike-Slip Model The pure en-échelon strike-slip boundary conditions were obtained by moving the upper left-hand and lower- right hand corners using displacement in the left (–X) and right (+X) directions while the lower and upper edges are fixed (Figure 4(a)). This boundary condition explores the effect of pure-strike-slip movements on the overall stress field and faulting regime on the pull-apart formation. 4.2.2. BC2: Transtensional Model The transtensional boundary conditions were simulated by moving the upper left-hand and lower-right hand corners using displacement in the left (–X) and right (+X) directions, and adding an outward displacement in left (–Y) and right (+Y) directions to the lower and upper edges of the model respectively (Figure 4(b)). This bou- ndary condition provides the opportunity to understand the distribution and orientation of the stress field and deformation style of the transtensional environment of the pull-apart formation. 4.2.3. BC3: Transpressional Model In order to investigate the state of stress and overall defor- mation of the strike-slip pull-apart basin we applied tran- spressional boundary condition. The transpressional boun- dary condition were obtained by moving the upper left- hand and lower-right hand corners using displacement in the left (–X) and right (+X) directions with adding an in- ward displacements in left (–Y) and right (+Y) directions to the lower and upper edges, respectively (Figure 4(c)). 4.3. Mechanical Parameters and Rock Domain Property The mechanical properties such as density (ρ), Young’s modulus (E), Poisson’s ratio (υ), angle of internal fric- tion () and cohesive strength (c) are important rock Model A Model BModel C (a) Pure Stnike-Slip condition (b) Trantensional condition (c) Transpressional condition Domain 1 Domain 2Domain 1 Domain 2 Domain 3 Domain 1 Domain 2 Domain 1 Domain 2 Domain 1 Domain 2 Domain 3 Domain 1 Domain 2 Domain 3 Domain 1 Domain 2 Domain 3 Domain 1 Domain 2 Domain 3 Domain 1 Domain 2 Domain 3 Figure 4. Simplified finite element model partition with geometry and boundary conditions for Models A, B and C. The triangular elements show the finite element grid.  G. R. Joshi et al. / Natural Science 2 (2010) 654-666 Copyright © 2010 SciRes. OPEN ACCESS 659 659 parameters in the FEM analysis (Table 1). The density (ρ) was obtained from the interval velocity of the indi- vidual rock domain, using the relation proposed by Bar- ton [28] and compared them with published velocity model [29] from southern Tibet. Seismic P-wave (Vp) and S-wave (Vs) velocities are chosen from the published literature of the study area [30]. We have used two in- dependent elastic constants, Young’s modulus and Pois- son’s ratio to solve the following elastic equations in the brittle part of the lithosphere [24,31]. )1( )21)(1( 2 v vv VE p (1) 2 11 [1 ] 2()1 ps vVV (2) where E-Young’s modulus, υ -Poisson’s ratio, ρ -density of rock, Vp- seismic P-wave velocity and Vs- seismic S-wave velocity. In performing FEM calculation, the whole model is divided into 3 domains and each domain has been allo- cated distinct rock layer properties on the basis of pre- dominant rock types (Table 1). In case of Model A, we assume that BCFZ is pre-existing weak shear zones which allowed us to adopt the value of Young’s modulus less compared to other rock domain. and c were ob- tained from the Handbook of Physical Constants [32]. 5. MODELLING RESULTS To understand the various factors that control the induced state of stress and deformation pattern of the pull-apart basin formation, we have carried out a number of mod- elling experiments for two characteristic models 1) with a pre-existing pull-apart basin in model and 2) without a pre-existing pull-apart basin in model. In case of without pre-existing pull-apart basin, we fur- ther calculated by two separate models, i.e., Model B and Model C. The Model B which represents no overlap or zero overlap between the two master faults and the Mo- del C corresponds to considerable overlap between two master en-échelon basement strike-slip faults. Each of these models was run for the three most common types of boundary conditions of pull-apart formation: 1) BC1: pure strike-slip condition, 2) BC2: transtensional condi- tion, and 3) BC3: transpressional condition. Here, mod- elling results are represented based on 1) the maximum (σH max) and minimum (σH min) horizontal principle stress 2) magnitude and orientation of the displacement vectors 3) distribution and magnitude of the strain 4) distribution of fault type and 5) concentration and distribution of the maximum shear stress (τmax) contours. The direction and magnitude of the maximum compressive stress axis and minimum compressive stress axis are represented by σ1 and σ3, respectively. In addition, we have calculated tectonic deformation and faulting regime on the Beng Co pull-apart basin based on the relation and position of the σ1, σ2 and σ3 applying Mohr-Coulomb failure criterion. 5.1. Model A: Pre-Existing Pull-Apart Basin Figures 5, 6 and 7 illustrate the orientation of the max- imum (σH max) and minimum (σH min), horizontal prin- ciple stress trajectories, strain distribution, displacement vectors, contour lines of maximum shear stress (τmax) and development of a faulting regime for Model A in the pure strike-slip boundary condition. The calculated σH max trajectories show almost N-S directional orientation with uniform distribution in the model with minor varia- tion in the upper left and lower right corners, which cor- responds to the direction of maximum shortening of the Tibetan Plateau (Figures 5(a), 6(a) and 7(a)). Similarly, σH min trajectories show more or less E-W orientation, which is also consistent with the direction of maximum extension in the Tibetan Plateau (Figures 5(b), 6(b) and 7(b)). However, some discrepancy was observed in the corners of the models which might be due to boundary effect. The orientations of the displacement vectors show prominent difference among three boundary conditions. The major discrepancy was obtained at the upper-right corner and lower-left corners of the pull-apart basin (Figures 5(c), 6(c), 7(c)). Figures 5(d), 6(d) and 7(d) illustrate the predicted strain partitioning for Model A, where high extensional strain is mainly concentrated along pre-existing weak shear zone. This is due to weak rheology, and consistent with the applied model geome- try. The predicted faulting pattern shows almost similar predominantly strike-slip type of faults for all boundary conditions (Figures 5(e), 6(e) and 7(e)). Figures 5(f), 6(f) and 7(f) show concentration and distribution pat- terns of modeled τmax contours for all three boundary conditions, where τmax is largely confined at the central part of the pull-apart basin. 5.2. Without Pre-Existing Pull-Apart Basin In this case, two models (Model B and Model C) were used to calculate state of stress and deformation regime Table 1. Rock mechanical properties used for different do- mains in the finite element models. Rock Domain ρ (kg/m3) E (GPa) c (MPa) (deg.) Domain 1 2900 60.0 24.0 50.0 Domain 2 2000 01.0 10.0 31.0 Domain 3 2000 01.0 10.0 31.0  G. R. Joshi et al. / Natural Science 2 (2010) 654-666 Copyright © 2010 SciRes. OPEN ACCESS 660 Model A: BC 1 a) σ H max b) σ H min c) displacement vectors d) strain e) fault type f) τ max 100 Mpa - 100 Mpa - 100 Mpa - 100 Mpa -100 Mpa - 100 Mpa - t t 1e3 1e2 1e2 0.05 0.05 0.05 12 10 8 6 4 2 12 10 8 6 4 2 12 10 8 6 4 2 10 20 30 40 10 20 30 4010 20 30 40 Figure 5. Results of Model A for all three pure strike-slip, transtensional and transpressional boundary conditions. (a) Maximum compressional stress (1) trajectories (b) Maximum extensional stress (3) trajectories (c) strain distribution (d) displacement vectors (e) faulting regime and (f) distribution of maximum shear stress (max) contours under 100 m boundary displacement condition at 10 km depth. of the Beng Co pull-apart basin for understanding the effect of different overlap on the stress distribution. Figures 6 and 7 illustrate the calculated maximum (σH max) and minimum (σH min) horizontal principle stress trajectories, strain distribution, displacement vectors, contour lines of maximum shear stress (τmax) and devel- opment of faulting regime of the Model B and Model C. In both models, orientations of the σH min trajectories show more or less E-W directed orientation for all boundary conditions, which is consistent with E-W ex- tension environment of the Tibetan Plateau. A compari- son of the Model B and Model C shows that although the general stress (σH min) patterns remain similar, there are significance differences in the distribution and con- centration of τmax (Figures 6(f) and 7(f)). Similarly, ac- cording to applied boundary conditions, the orientation and magnitude of displacement vectors show significant variations between Model B and Model C (Figures 6(c) and 7(c)). There are no considerable differences ob- served in the predicted strain partitioning among both models, where strain is mainly concentrated along the fault zone which is due to weak rheology. The predicted faulting pattern of the model exhibits almost similar predominantly strike-slip types of faults that have de- veloped for all boundary conditions. If we compare pre-existing pull- apart model (Model A) there is sig- nificant difference in distribution and concentration of τmax contours. 5.2.1. Model B: Without Overlap on the Pull-Apart basin Model B illustrates the results of numerical simulation in the case of no pre-existing pull-apart basin and zero overlap of the two master strike slip faults in the model. Figure 6 illustrates the orientation of σH max and σH min trajectories, displacement vectors, strain concentration, distribution of τmax contours and faulting regimes for Model B. In this model orientation of σH max trajectories, strain concentration and faulting regimes which show similar results for all boundary conditions at the same displacement, compared to Models A and C. However, the magnitude of the σH min trajectories shows little dif- ferences between BC1 and BC3, and the predicted re- sults of displacement vectors and distribution of τmax show considerable differences between three applied boundary  G. R. Joshi et al. / Natural Science 2 (2010) 654-666 Copyright © 2010 SciRes. OPEN ACCESS 661 661 conditions. Figure 6(c) illustrates the principal variations of predicted displacement vectors among three boundary conditions (i.e., BC1, BC2 and BC3) for Model B. Simi- larly, Figure 6(f) shows how differently τmax is distrib- uted for the different boundary conditions in Model B. 5.2.2. Model C: With Fault Overlap on the Pull-Apart Basin Model C predicted the results of numerical simulation taking into account pre-existing overlap of the two mas- ter strike slip faults in the Beng Co pull-apart basin. Figure 7 illustrates the orientation of σH max and σH min trajectories, displacement vectors, strain concentration, distribution and accumulation of τmax and overall faulting regimes for Model C. Results show that there are no considerable variations of the distribution and orienta- tion of the predicted σH max and σH min trajectories, strain partitioning and faulting regime. Nevertheless, high disc- repancies do exist in case of displacement vectors (Fig- ure 7(c)) and distribution and concentration of τmax con- tours (Figure 7(f)). If we compare distribution and con- centration of τmax to other models the Model C does not predict τmax in the centre of the pull-apart basin which is possibly due to the fault overlap geometry. Moreover, major difference appear in predicted the maximum ext- ensional stress (σ3) trajectories within the Model C (Figure 7(b)), which might be the cause of the applied boundary condition. 6. DISCUSSIONS 6.1. Effect of Pre-Existing Weak Shear Zone of Pull-Apart Basin We first explore the effect of a pre-existing weak shear zone of pull-apart basin on the stress field and deforma- tion pattern during formation of the pull-apart basin. Figure 5 illustrates the modelling results of a pre-exist- ing weak shear zone of Beng Co strike-slip pull-apart basin. In order to quantify the relative importance of a pre-existing strike-slip weak shear zone on the pull- apart basin the modelling results are compared between Model A and Model B. A close examination of results of Model B: BC 1 a) σ H max b) σ H min c) displacement vectors d) strain e) fault type f) τ max 100 Mpa - 100 Mpa - 100 Mpa -100 Mpa - 100 Mpa - C2 1e3 1e3 0.05 0.05 0.05 12 10 8 6 4 2 10 20 30 40 10 2030 4010 20 30 40 100 Mpa - ent C3 ent 1e3 12 10 8 6 4 2 12 10 8 6 4 2 Figure 6. Results of Model B for all three pure strike-slip, transtensional and transpressional boundary conditions.(a) Maximum compressional stress (1) trajectories (b) Maximum extensional stress (3) trajectories (c) strain distribution (d) displacement vectors (e) faulting regime and (f) distribution of maximum shear stress (max) contours under 100 m boundary displacement condition at 10 km depth.  G. R. Joshi et al. / Natural Science 2 (2010) 654-666 Copyright © 2010 SciRes. OPEN ACCESS 662 Model C: BC 1 a) σ H max b) σ H min c) displacement vectors d) strain e) fault type f) τ max 100 M p a - 100 M p a -100 M p a - 2 1e3 1e3 0.05 0.05 0.05 12 10 8 6 4 2 10 20 30 40 10 2030 4010 20 30 40 ent ent 1e3 100 M p a - 100 M p a -100 M p a - 12 10 8 6 4 2 12 10 8 6 4 2 a) σ H max b) σ H min f)τ max Figure 7. Results of Model C for all three pure strike-slip, transtensional and transpressional boundary conditions. (a) Maximum compressional stress (1) trajectories (b) Maximum extensional stress (3) trajectories (c) strain distribution (d) displacement vectors (e) faulting regime and (f) distribution of maximum shear stress (max) contours under 100 m boundary displacement condition at 10 km depth. these two models demonstrate that major disparities ex- ist in the horizontal displacement vectors and distribu- tion and concentration of τmax contour lines, whereas minor differences also exist with regards to the orienta- tion and magnitude of the horizontal principal stresses and deformation pattern, which indicate that the effect of the pre-existing weak shear zone of the pull-apart basin are important control on distribution and concentration of τmax, and principal stresses direction. 6.2. Effect of Change in Boundary Conditions in Pull-Apart Formation Boundary conditions are important factors for control- ing the stress state and deformation patterns of the model. Therefore, we explore the effect of a change in boundary conditions on the stress field and deformation style in the formation of the pull-apart basin. In order to investi- gate the effect of boundary conditions in stress field and deformation patterns, we have tested three types 1) pure strike-slip 2) transtensional and 3) transpressional of boundary conditions. Figures 5, 6 and 7 show predicted modelling results of the σH max, σH min, τmax, displacement vector, strain partitioned and faulting regime for all three models. Modelling results clearly demonstrated that the distribution and concentration of τmax, displacement vectors and dimension of the pull-apart basin in each boundary condition varies significantly, while orienta- tions of the σH max and σH min are moderately influenced and faulting regime is not effected by changing applied boundary conditions. 6.3. Effect of Change in Fault Overlap in Pull-Apart Development To investigate the effect of change in the two en-échelon faults overlap geometry we have considered two sepa- rate models having 1) zero fault overlap (Model B), and 2) with fault overlap (Model C). Figure 7 shows the predicted result of fault overlap Model C. If we compare the predicted results of this model with other two models (Model A and Model C) (Figures 6 and 7) we observed that the major differences among models are in the ori- entation of displacement vectors, and distribution and concentration of the τmax contours. The large rotation of  G. R. Joshi et al. / Natural Science 2 (2010) 654-666 Copyright © 2010 SciRes. OPEN ACCESS 663 663 the horizontal displacement vector appears in the central part of the pull-apart basin with zero overlap model (Model B), while no significant rotation of displacement vector observed in the overlap model (Model C). The Model C produced a tentative rectangular and wide pull- apart basin, while Model B produced a narrow and small pull-apart basin (Figures 6 and 7). Moreover, simulated results from our models clearly show that if the faults overlap increases, the size of the pull-apart basin also increases and if the fault overlap decreases the size of the pull apart basin decreases, considerably. These resu- lts of numerical modelling imply that fault overlap ge- ometry has an extensive control on the change in shape, size and morphology of the pull-apart formation, which is consistent with previous studies such as Gölke, et al., [19]. Moreover, fault overlap geometry has significant effect on distribution and orientation of σH min and con- centration of the τmax contours but there is no effect on the development of fault type (Figures 6 and 7). 6.4. Effect of Change in Displacement in Pull-Apart Formation The applied displacement is another significant factor that strongly influences on the magnitude and orientation of the stress field and deformation pattern. We have in- vestigated the effect of applied displacement on the de- formation and stress regime during the pull-apart deve- lopment. We have used 100 to 500 m displacement con- ditions from the either sides of the model. Our modelling results clearly show that displacement has a major effect on the magnitude and orientation of the maximum (σH max) and minimum (σH min) horizontal stresses and displace- ment vectors, but minor effect on the style of faulting. This result indicates that the change in displacement significantly influences the magnitude of the stress traj- ectory but only has a limited effect on the orientation of the pull-apart formation. We have further explored the influence of change in displacement on maximum shear stress (τmax) concentration. The model results demon- strate that if we increase the applied displacement the magnitude and concentration of the τmax contour in- creases considerably and shear strain will become con- centrated in the two ends of the master fault zones. 7. CONCLUSIONS A two-dimension finite element numerical model was used to simulate the strike-slip pull-apart basin forma- tion. We examine the state of stress and deformation ass- ociated with the right-lateral, en-échelon Beng Co pull- apart basin in the southern part of Tibetan Plateau. In this paper, we have considered three models each incor- porating three different boundary conditions (pure strike- slip, transtensional and transpressional) with different amount of fault overlap of the master strike-slip fault sy- stems. Our modelling results demonstrate that the defor- mation pattern of the en-échelon strike-slip pull-apart fo- rmation is mainly dependent on the geometry of the pull- apart basin, applied boundary conditions and the amount of overlap between two master strike-slip fault systems. When the amount of overlap of the shear zone increases, the surface deformation gets wider and longer between two master faults, but if zero overlap exists between the two strike-slip fault systems, the narrow pull apart for- med and block rotation is observed within the pull-apart basin. Based on present modelling we conclude that ove- rlap between two en-échelon strike-slip faults is a signi- ficant factor in controlling the shape, size and morphol- ogy of the pull-apart formation. The pattern of the rotation of displacement vectors and maximum shear stress (τmax) distribution contours are also highly dependent on the applied boundary condi- tions and amount of overlap. In the case of a larger overlap, τmax is mainly concentrated at two corners of the master strike-slip faults and reduces toward the centre of the pull-apart basin, whereas for zero overlap conditions, τmax is largely concentrated at the two corners and tips of the master strike-slip faults. These results imply that the concentration and distribution of the maximum shear stress (τmax) is principally governed by amount of over- lap between the master strike-slip faults in the en-échelon pull-apart formation. Finally, on the basis of our modelling results we can conclude that the adopted geometry, applied boundary conditions and amount of overlap of the shear zone have a remarkable role in controlling the overall dimension, stress distribution and deformation pattern during the pull-apart formation. 8. ACKNOWLEDGEMENTS G. R. Joshi gratefully acknowledges the Ministry of Education, Sports and Culture (Monbukagakusho) Japan for the financial support to accomplish this research. The authors wish to thank simulation tecton- ics laboratory members for their help and support during the research. REFERENCES [1] Katzman, R., Brink, U.S. and Lin, J. (1995) Three di- mension of modelling of pull-apart basins: Implications for the tectonics of the Death Sea Basins. Journal Geo- physical Research, 100(B4), 6295-6312. [2] Petrunin, A. and Sobolev, S.V. (2006) What controls the thickness and lithospheric deformation at a pull-apart ba- sin? Geology, 34(5), 389-392. [3] Burchfiel, B.C. and Stewary, J.H. (1966) Pull-apart ori- gin of the central segment of the Death valley. Geologi- cal Society of America, 77(4), 439-442.  G. R. Joshi et al. / Natural Science 2 (2010) 654-666 Copyright © 2010 SciRes. OPEN ACCESS 664 [4] Sylvester, A.G. (1988) Strike-slip faults. Bulletin of Geo- logical Society of America, 100(11), 1666-1703. [5] Ayden, A.A. and Nur, A. (1982) Evolation of pull-apart basins and their scale independence. Tectonics, 1(1), 91- 105. [6] Gamond, J.F. (1983) Displacement feature associated with fault zone: A comparison between observed exam- ples and experimental models. Journal of Structural Ge- ology, 5(1), 33-45. [7] Bahat, D. (1983) New aspects of rhomb structures. Journal of Structural Geology, 5(6), 591-601. [8] Connolly, P. and Cosgrove, J. (1999) Prediction of frac- ture-induced permeability and fluid flow in the crust us- ing experimental stress data. AAPG Bulletin, 83(5), 757- 777. [9] Hu, S., O’Sullivian, B.P., Raza, A. and Cona, B.P. (2001) Thermal History and tectonic subsidence of the Bohai Basin, northern China: A Cenozoic rifting and pull-apart basins. Physics of the Earth and Planetary Interiors, 126(3-4), 121-135. [10] Armijo, R., Meyer, B., Navarro, A., King, G. and Barkar, A. (2002) Asymmetric slip partitioning in the Sea of Marmara pull-apart: A clue to propagation processes of the North Anatolian Fault. Terra Nova, 14(2), 80-86. [11] Armijo, R., Tapponnier, P. and Tonglin, H. (1989) Late Cenozoic right-lateral strike-slip faulting in southern Ti- bet. Journal of Geophysical Research, 94(B3), 2787- 2938. [12] Armijo, R., Tapponnier, P., Mercier, L. and Tonglin, H. (1986) Quaternary extension in southern Tibet: Field ob- servations and tectonic implications. Journal of Geo- physical Research, 91(B14), 13803-13872. [13] Harding, T.P. (1990) Identification of wrench faults using sub-surface structural data: Criteria and pitfalls. AAPG Bulletin, 74(10), 1590-1609. [14] Recherds, P.D., Boyce, A.J. and Pringle M.S. (2001) Geological evolution of the Escondida area, northern Chile: a model for spatial and temporal localization of porphyry Cu mineralization. Economic Geology, 96(2), 271-305. [15] Monastero, F.C., Katzenstein, A.M., Miller, J.S., Unruh, J. R., Adams, M.C. and Richerds-Dinger, K. (2005) The Coso geothermal field: A nascent metamorphic core complex. Bulletin of Geological Society of America, 117(11-12), 1534- 1553. [16] Segall, P. and Pollard, D.O. (1980) Mechanics of discon- tinuous faults. Journal of Geophysical Research, 85(B8), 4337-4350. [17] Basile, C. and Brun, J.P. (1999) Transtensional faulting pattern from pull-apart basin to continental margins: An experimental investigation. Journal of Structural Geol- ogy, 21(1), 23-37. [18] Du, Y. and Aydin, A. (1993) The maximum distortion energy density criterion for shear fracture propagation with applications to the growth paths of en-échelon faults. Geophysical research Letters, 20(11), 1091-1094. [19] Gölke, M., Cloetingh, S. and Fuch, K. (1994) Finite ele- ment modelling of pull-apart formation. Tectanophysics, 240(1-4), 45-57. [20] Petrunin, A. and Sobolev, S.V. (2008) Three-dimensional numerical models of the evolution of pull-apart basins. Physics of Earth and Planatery Interiors. 171(1-4), 387- 399. [21] Molnar, P. and Tapponier, P. (1975) Cenozoic tectonics of Asia: Effects of a continental collision. Science , 189(4201), 419-426. [22] Mercier, J.L., Armijo, R., Tapponinier, P., Carey-Gail- hardis, E. and Han, T.L. (1987) Change from late tertiary compression to late quaternary extension, in southern Tibet, during the India-Asia collision. Tectonics, 6(3), 275-304. [23] Torre, T.L. de la, Monsalve, G., Sheehan, A.F., Sapkota, S. and Wu, F. (2007) Earthquake processes of the Himala- yan collision zone in eastern Nepal and the southern Ti- betan Plateau. Geophysical Journal International, 171(2), 718-738. [24] Hayashi, D. (2008) Theoretical basis of FE simulation software package. Bulletin of the Faculty of Science, University of the Ryukyus, 85, 81-95. [25] Joshi, G.R. and Hayashi, D. (2008a) Neotectonic defor- mation and shortening along the Himalayan front in the Garhwal region by finite element modelling. Bullettino di Geofisica Teorica ed Applicacate, 49, 228-233. [26] Joshi, G.R. and Hayashi, D. (2008b) Numerical model- ling of neotectonic movements and state of stresses in the central seismic gap region, Garhwal Himalaya. Journal of Mountain Science, 5(4), 279-298. [27] Joshi, G.R. and Hayashi, D. (2010) Development exten- sional stresses in the compressional setting of the Hima- layan thrust wedge: Inference from numerical modelling. Natural Science (in press). [28] Barton, P.J. (1986) The relationship between the seismic velocity and density in the continental crust—a useful constraint? Geophysics Journal of the Royal Astronomi- cal Society, 87(1), 195-208. [29] Zhao, W., Nelson, K.D. and Project INDEPTH Team (1993) Deep seismic reflections evidence for continental underthrusting beneath south Tibet. Nature, 366(6455), 557- 559. [30] Cogan, M.J., Nelson, K.D., Kidd, W.S.F., Wu, C. and Project INDEPTH Team (1998). Shallow structure of the Yadong-Gulu rift, southern Tibet, from refraction analy- sis of Project INDEPTH common midpoint data. Tecton- ics, 17(1), 46-61. [31] Timosenko, S.P. and Goodier, J.N. (1970) Theory of elasticity. 3rd Edition, McGraw-Hill Book Company, London. [32] Clark, Jr., S.P. (Ed.) (1966) Handbook of Physical Con- stants. New York, Geological Society America, Memoir. [33] Molnar, P. and Chen, W.P. (1983) Focal depths and fault plane solutions of earthquakes under the Tibetan Plateau. Journal of Geophysical Research, 88(B2), 1180-1196.  G. R. Joshi et al. / Natural Science 2 (2010) 654-666 Copyright © 2010 SciRes. OPEN ACCESS 665 665 Appendix Appendix A is quoted from “Theoretical basis of FE simulation software package” page 84 to 89 written by Hayashi (2008). 1. 2D Elastic Problem The principle of virtual work is described that the exter- nal works done by virtual displacement equals the inter- nal work done by virtual strain. Let us consider a certain element within a domain concerned as shown in Figure A1. When small displacement i u, which is called vir- tual displacement, is applied to deform the element without disturb the balance of system, the external work is written as e T e Wfu where 3 2 1 u u u ue and 3 2 1 f f f fe While taking e as virtual strain derived from virtual displacement and s as stress, the strain energy of the element are shown as dSU S Tse According to the principle of virtual work, both must be equated. W = U dS S T e T esefe (1) ca a a a x x xaxaa xaau 0 ii 2 1 0 21 2211 0 )1( Figure A1. Force vector and virtual displacement vector work at each nodal point in a certain finite element (Hayashi, 2008). Then, to obtain the practical form of (1), we assume the displacement within element as a function of coor- dinates. Since the simplest relation is linear, we take linear relation as follows. dS T s ee T esefu Substituting the values of coordinate and displacement at nodes into this equation, we have a)1( N2N1N x x u Writing in vector form aau C x x x x x x u u u 3231 2221 1211 3 2 1 e 1 1 1 The coefficient vector a is derived from the equation, e Cua 1 332313 322212 312111 11 C and C det and C of cofactor ij . Therefore, the inner displacement is represented in terms of nodal displacements e e xx xx xx C u u) ( 1 uc 23213231 2231222121311211 1 Replacing as )( 1 23121 xx NNNN , we have NN uu . Since we will consider 2D situation, displacement has 2 components as u1 and u2. 11 NN uu 22 NN uu Writing them in vector form, 2 1 321 321 2 1 000 000 u u u u u Then, exchanging the order of nodal displacements, 323122211211322212312111 uuuuuuuuuuuu e u u u u u u u u u u 32 31 22 21 12 11 321 321 2 1 000 000  G. R. Joshi et al. / Natural Science 2 (2010) 654-666 Copyright © 2010 SciRes. OPEN ACCESS 666 Then, we can represent strain by nodal displacements as e e B uu u u e e e u ue 1,32,31,22,21,12,1 2,32,22,1 1,31,21,1 1,22,1 2,2 1,1 12 22 11 000 000 2 Where 323322231213 332313 322212 000 000 1 B As for stress vector, according to the constitutive law of elasticity, es D 12 22 11 For example, in case of plane strain )1(2 21 00 01 1 0 1 1 )21)(1( )1( v- v v- v v- v vv vE D Then, according to the principle of virtual work, eee e S T T e K dS DB B uf ue This is called the stiffness equation of element. Superposing every stiffness equations of element, we obtain the stiffness equation of whole domain. F = K u dS dST SS b e T eseffu If body force (fb) is considered, the principle of vir- tual work need be modified as 2. Fault Analysis As shown in Figure A2, the Mohr-Coulomb criterion is written as a linear relationship between shear and normal stresses, )( 21 * v (2) When we consider the analysis in plane strain condi- tion, it is possible to calculate the value of third principal stress (* ), where is the Poisson ratio (Timoshenko and Goodier, 1970). After comparing the values of1 , 2 and * , we can recognize the newly defined 1 , 2 and 3 as the maximum, intermediate and mini mum principal stresses respectively. We introduce how Figure A2. Failure envelope and Mohr’s circle in σ-τ space. c is cohesion and φ is angle of internal friction (Hayashi, 2008). mum principal stresses respectively. We introduce how the Mohr-Coulomb criterion is combined into the FE software package; though I already wrote the method of failure analysis in my serial papers (Table 1). If body force (b f) is considered, the principle of vir- tual work need be modified as tan c (3) where c and are the cohesive strength and the an- gle of internal friction, respectively. Failure will observe when the Mohr’s circle first touches the failure envelope (3). It will happen when the radius of the Mohr’s circle, 1 +2 /2, is equal to the perpendicular distance from the center of the circle at 1 -2 /2 to the failure enve- lope, sin 2 cos 2 3131 c failure (4) According to Melosh and Williams (1989), the prox- imity to failure (f P) is the ratio between the calculated stress and the failure stress, which is given by failure f P 2 2 31 31 (5) When the ratio reaches one (f P = 1), failure occurs, but when f P < 1 stress is within the failure envelope, rock does not fail. The proximity to failure f P reveals which parts of the model are close to failure or already failed by generating faults. The type of faulting has been determined by the And- erson’s theory (1951). According to his theory three classes of faults (normal, strike slip and thrust) result from the three principal classes of inequality that may exist between the principal stresses. I realized the judg- ment in the program failure.state.func in FE package. |