Journal of Minerals and Materials Characterization and Engineering, 2012, 11, 653-660
Published Online July 2012 (http://www.SciRP.org/journal/jmmce)
Effect of Cell Size on the Fundamental Natural Frequency
of FRP Honeycomb Sandwich Panels
Sourabha S. Havaldar1, Ramesh S. Sharma1*, Arul Prakash M. D. Antony2, Mohan Bangaru2
1Department of Mechanical Engineering, R. V. College of Engineering, Bangalore, India
2Department of Production Technology, Madras Institute of Technology, Chennai, India
Email: *rssharma25@yahoo.com
Received January 7, 2012; revised February 10, 2012; accepted March 5, 2012
ABSTRACT
In the present work, the effect of hexagonal cell size of the core on the fundamental natural frequency of FRP honey-
comb sandwich panels has been analyzed both experimentally and by finite element technique. Experimental Modal
tests were conducted on hexagonal cell honeycombs ranging in size from 8 mm to 20 mm maintaining the facing thick-
ness constant at around 1 mm with two different boundary conditions viz C-F-F-F and C-F-C-F. The traditional “strike
method” has been used to measure the vibration properties. The modal characteristics of the specimens have been ob-
tained by studying its impulse response. Each specimen has been subjected to impulses through a hard tipped hammer
which is provided with a force transducer and the response has been measured through the accelerometer. The impulse
and the response are processed through a computer aided FFT Analyzing test system in order to extract the modal pa-
rameters with the aid of software. Theoretical investigations have been attempted with appropriate assumptions to un-
derstand the behavior of the honeycomb sandwich panels during dynamic loading and to validate experimental results.
Finite Element modeling has been done treating the facing as an orthotropic laminate and Core as orthotropic with dif-
ferent elastic constants as recommended in the literature. The results are presented which show that the theoretical
model can accurately predict the fundamental frequency and how honeycombs with different cell size will perform un-
der dynamic loads.
Keywords: Honeycomb; Modal Testing; FRP; Impulse; Frequency
1. Introduction
Sandwich structures that employ a honeycomb core be-
tween two relatively thin skins are desirable in several
engineering applications that require high strength to
weight ratios. Because of their ability to absorb large
amounts of energy, they are also often used as a “cush-
ion” against external loads. Honeycomb sandwich struc-
tures are currently being used in many engineering ap-
plications, both within and outside of aerospace engi-
neering. Lightweight honeycomb materials can be used
in the construction of composite panels, shells, and tubes
with high structural efficiency.
In recent years, the researches pertaining to honey-
comb sandwich structures have been focused on effective
numerical modeling methods, vibration properties, crash-
worthiness, damage, failure and impact response [1,2].
Burton and Noor [3,4] investigated the continuum mod-
eling of honeycomb sandwich for computation. Nieh [5]
also studied the processing and modeling of cellular sol-
ids for lightweight structures. Maheri and Adams [6]
investigated the damping of composite honeycomb sand-
wich beams in steady-state flexural vibration using the
method extended from that for monolithic beams. Gold-
smith et al. [7,8] studied the crashworthiness of honey-
comb under impact loads. Neilsen [9] discussed the con-
tinuum representations of cellular solids, including hon-
eycomb materials, to relate localized deformations to
appropriate constitutive descriptions. But the role of ani-
sotropic properties of honeycomb core in elasticity on the
structure was not addressed.
Damping contributions due to its components, par-
ticular skin fiber orientations, were considered. They also
investigated the dynamic shearing property of both No-
mex and aluminum honeycomb core [10]. The dynamic
shearing properties of honeycomb were shown to be dif-
ferent in various directions from static properties. It has
long been realized that honeycomb materials are anisot-
ropic in nature. The ability to predict the properties of
these cellular materials depends on the knowledge of
microstructural mechanism that contributes to macro-
scopic behavior. The traditional Nomex and aluminum
cores have great capability of withstanding compression
*Corresponding author.
Copyright © 2012 SciRes. JMMCE
S. S. HAVALDAR ET AL.
654
load in thickness (T) direction and shear load in longitu-
dinal (L) and width (W) directions. The material proper-
ties such as elastic moduli and strengths are various in
different directions, and even the compressive and tensile
properties are different in the thickness-direction, pri-
marily due to the initial deflection of cell walls. Vibra-
tion frequencies and mode shapes of honeycomb sand-
wich panels with various structural parameters were
studied by Qunli Liu and Yi Zhao [11] using computa-
tional and experimental methods. Two computational
models were used to predict the mode shapes and fre-
quencies of honeycomb sandwich panels. Plate elements
were used for honeycomb cell walls to reflect the geo-
metric nature of the hexagonal cells. The quantitative
effect of the anisotropic core on the vibration properties
of the sandwich panels were studied and presented.
Most studies in the literature are related to one of the
attributes (high strength/weight or increased energy ab-
sorption) mentioned above. With regard to the develop-
ment of a honeycomb panels, one issue that has been
overlooked is the scaling of honeycomb properties with
respect to cell size. The variation in cell size may have a
large influence on the dynamic properties of honeycomb
panels. The current paper expands upon this study. The
results from the experimental program will be presented
and discussed. The theoretical literature available [12] on
sandwich panels in evaluating fundamental frequency
with a non-dimensional parameter will also be discussed
in this work. Of interest in this study is to understand the
effect of cell size on the fundamental frequency of hon-
eycomb panels.
2. Experimental Techniques
2.1. Fabrication of Honeycomb Panels
FRP honeycomb sandwich panels have been fabricated
through vacuum bag molding technique, which uses the
vacuum to eliminate the entrapped air and excess resin.
The adhesive used is epoxy resin LY 556 mixed with
hardener HY 951. The resin and hardener is mixed in the
weight ratio of 10:1. To maintain optimum strength of
the matrix, the ideal resin to glass ratio is found to be
35:65. The mold used is a “hexagonally machined split
molding tool” made of chromium plated mild steel. After
ensuring the surface is clean and free from foreign parti-
cles, a coat of release agent is applied. A coat of resin
mixture is then applied on the molding surface and the
plain weave glass “E” fabric is impregnated against the
first half of molding tool surface, by ensuring thorough
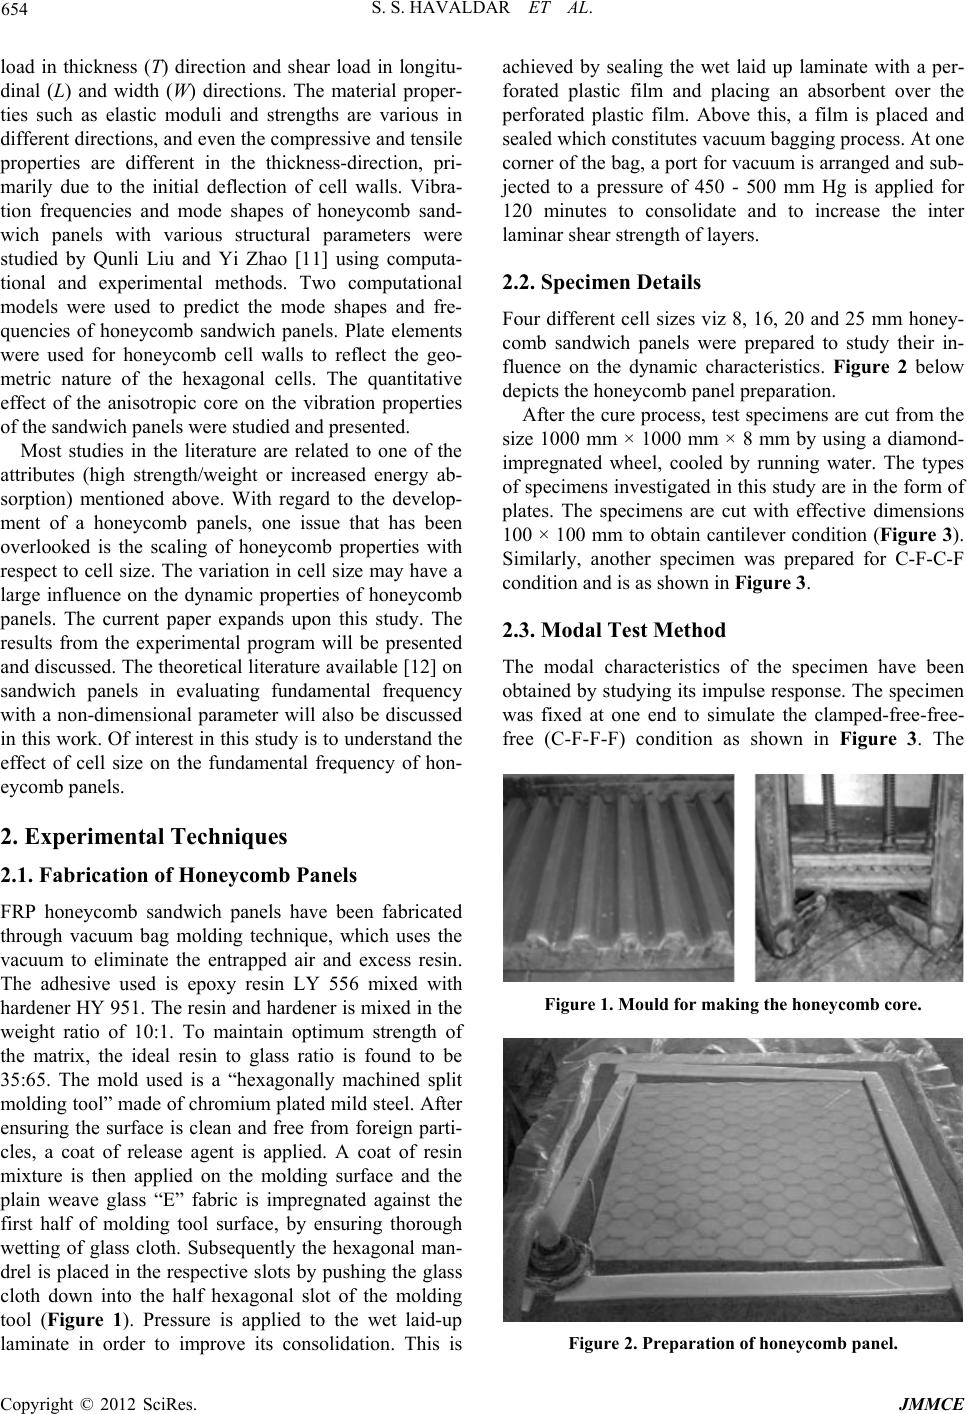
wetting of glass cloth. Subsequently the hexagonal man-
drel is placed in the respective slots by pushing the glass
cloth down into the half hexagonal slot of the molding
tool (Figure 1). Pressure is applied to the wet laid-up
laminate in order to improve its consolidation. This is
achieved by sealing the wet laid up laminate with a per-
forated plastic film and placing an absorbent over the
perforated plastic film. Above this, a film is placed and
sealed which constitutes vacuum bagging process. At one
corner of the bag, a port for vacuum is arranged and sub-
jected to a pressure of 450 - 500 mm Hg is applied for
120 minutes to consolidate and to increase the inter
laminar shear strength of layers.
2.2. Specimen Details
Four different cell sizes viz 8, 16, 20 and 25 mm honey-
comb sandwich panels were prepared to study their in-
fluence on the dynamic characteristics. Figure 2 below
depicts the honeycomb panel preparation.
After the cure process, test specimens are cut from the
size 1000 mm × 1000 mm × 8 mm by using a diamond-
impregnated wheel, cooled by running water. The types
of specimens investigated in this study are in the form of
plates. The specimens are cut with effective dimensions
100 × 100 mm to obtain cantilever condition (Figure 3).
Similarly, another specimen was prepared for C-F-C-F
condition and is as shown in Figure 3.
2.3. Modal Test Method
The modal characteristics of the specimen have been
obtained by studying its impulse response. The specimen
was fixed at one end to simulate the clamped-free-free-
free (C-F-F-F) condition as shown in Figure 3. The
Figure 1. Mould for making the honeycomb core.
Figure 2. Preparation of honeycomb panel.
Copyright © 2012 SciRes. JMMCE
S. S. HAVALDAR ET AL.
Copyright © 2012 SciRes. JMMCE
655
specimen has been subjected to impulses through a hard
tipped hammer which is provided with a force transducer
(PCB make) with a sensitivity of 2.25 mV/N and the re-
sponse has been measured through the accelerometer
(PCB make) with an accelerometer of sensitivity 10
mV/g. The impulse and the response are processed on a
computer aided FFT analyzer test system (LMS Inc.) in
order to extract the modal parameters with the help of
built in software.
The sandwich specimen has been subjected to im-
pulses at 25 station locations. The response has been
measured by placing the accelerometer at station 1. Due
to inherent damping in the specimen, the test was re-
stricted to fundamental vibration mode with the impact
hammer. The test was conducted for all the types of
specimen with two different boundary conditions and the
results recorded.
C-F-F-F condition
3. Results & Discussions
The physical and chemical tests such as density test,
Glass transition test and chemical tests conducted on
FRP face sheet is indicated in Table 1. The geometric
details of the specimens used for C-F-F-F and C-F-C-F
boundary conditions in the modal tests are indicated in
Tables 2 and 3.
C-F-C-F condition The elastic properties of the fiber and resin are indi-
cated in Table 4. The elastic constants of the FRP bi-
woven laminate are obtained from the equations listed in
Figure 3. Specimens attached to fixture for simulating C-F-
F-F & C-F-C-F condition.
Table 1. Physical and chemical test of FRP face sheet.
Specimen designation Specimen dimensions in mmVolume in m3 Mass in Kg Density in Kg/m3
Density as per ASTM C 271
FRP 25.2 × 25.3 × 2.1 1.3389 × 10⁶ 2.156 × 10³ 1610
Glass content in FRP: 70%; Resin content: 30%
Glass Transition (Tg) Temperature of FRP as per ASTM D 3418 - 99: 111.29˚C
Table 2. Geometric details of the sandwich panel (C-F-F -F ).
Designation Length × width mm Facing thickness mmCore cell size mm Wall thickness mm Core thickness mm
C-8 100 × 100 0.92 8 0.1 7.96
C-16 100 × 100 1.00 16 0.1 8.35
C-20 100 × 100 0.96 20 0.1 6.48
Table 3. Geometric details of the sandwich panel (C-F-C-F ).
Designation Length × width mm Facing thickness mmCore cell size mm Wall thickness mm Core thickness mm
C-8 100 × 100 0.95 8 0.1 7.38
C-16 100 × 100 0.94 16 0.1 8.32
C-20 100 × 100 0.98 20 0.1 6.74
S. S. HAVALDAR ET AL.
656
the appendix and are tabulated in Table 5.
The elastic constants of the FRP honeycomb core have
been determined as per the equations listed in the appen
dix and are tabulated in Table 6.
For the FE modeling, 20 noded SOLID 95 element
was used. The elastic constants and mass density for
Facing layer and core layer were appropriately given.
Finite Element analysis results are indicated in Figures
4-9 and the consolidated results of the predicted and ex-
perimental results are indicated in Table 7. It can be
Table 4. Elastic properties of fiber and resin of Unidirec-
tional FRP facings.
Material Properties Value
Ef (GPa) 74
Gf (Gpa) 30
f (Kg/m3) 2600
Glass fiber
f 0.25
Em (Gpa) 4.0
Gm (Gpa) 1.4
m (Kg/m3) 1200
Epoxy resin
m 0.40
Figure 4. FE model cell size 8—C-F-F-F.
Figure 5. FE model cell size 16—C-F-F-F.
Figure 6. FE model cell size 20—C-F-F-F.
Figure 7. FE model cell size 8—C-F-C-F.
Figure 8. FE model cell size 16—C-F-C-F.
Figure 9. FE model Cell size 20—C-F-C-F.
Copyright © 2012 SciRes. JMMCE
S. S. HAVALDAR ET AL. 657
Table 5. Elastic properties of the bi-woven FRP facings.
E1 (N/m2)
× 109
E2 (N/m2)
× 109
E3 (N/m2)
× 109
G12 (N/m2)
× 109
G23 (N/m2)
× 109
G13 (N/m2)
× 109
12
23
13
16.84 16.84 7.78 2.46 2.38 2.38 0.15 0.49 0.49
Table 6. Elastic properties of FRP honeycomb core.
Cell size and
density (Kg/m3)
Ex (N/m2)
× 105
Ey (N/m2)
× 105
Ez (N/m2)
× 108
Gxy (N/m2)
× 104
Gyz (N/m2)
× 106
Gxz (N/m2)
× 106
xy
yz
xz
C-8 (53.7) 3.940 3.940 3.64 5.92 18.4 12.7 0.994 0.0001 0.0001
C-16 (26.8) 0.490 0.490 1.82 68.3 9.22 6.15 0.994 0.0001 0.0001
C-20 (21.47) 0.252 0.252 1.46 0.379 7.38 4.92 0.994 0.0001 0.0001
Table 7. Comparison of experimental and predicted first natural frequency.
CFFF CFCF
Cell size fAnsys fActual Error fAnsys f
Actual Error
C-8 424 404 4.95% 1486 1492 0.04%
C-16 338 326 3.7% 1149 1291 11.9%
C-20 284 278 2.2% 1071 1194 11.7%
Actual Ansys
Actual
Error 100
ff
f
.
seen that the predicted results are in close agreement with
the experimental results, the error being less than 12%. It
can be inferred that the elastic constants of the core and
facings have to be rigorously worked out to predict the
fundamental frequency.
4. Conclusion
The fundamental frequencies of FRP honeycomb core
with different cell sizes under two different boundary
conditions viz. C-F-F-F and C-F-C-F have been deter-
mined by experimental modal analysis using impulse—
strike technique. Finite Element analysis with appropriate
elastic constants rigorously worked out for the facings
and the core predicts the fundamental frequencies which
are quite close to the experimentally determined values.
5. Acknowledgements
The authors thankfully acknowledge the Management,
Principal of their respective institutions for their constant
encouragement and support to carry out this work.
REFERENCES
[1] P. H. W. Tsang and P. A. Lagace, “Failure Mechanisms
of Impact-Damaged Sandwich Panels under Uniaxial Com-
pression,” 35th AIAA/ASME/ASCE/AHS/ASC Structures,
Structural Dynamics and Materials Conference, Hilton
Head, 18-20 April 1994, pp. 745-754.
[2] P. A. Lagace and J. E. Williamson, “Contribution of the
Core and Facesheet to the Impact Damage Resistance of
Composite Sandwich Panels,” 10th DOD/NASA/FAA Con-
ference on Fibrous Composites in Structural Design,
Hilton Head, April 1994, pp. II53-II74.
[3] W. S. Burton and A. K. Noor, “Assessment of Computa-
tional Models for Sandwich Panels and Shells,” Com-
puter Methods in Applied Mechanics and Engineering,
Vol. 124, No. 1-2, 1995, pp. 125-151.
doi:10.1016/0045-7825(94)00750-H
[4] W. S. Burton and A. K. Noor, “Assessment of Continuum
Models for Sandwich Panel and Honeycomb Cores,”
Computer Methods in Applied Mechanics and Engineer-
ing, Vol. 145, No. 3-4, 1997, pp. 341-360.
doi:10.1016/S0045-7825(96)01196-6
[5] T. G. Nieh, “Processing and Modeling of Cellular Solids
for Light-Weight Structures,” Lawrence Livermore Na-
tional Laboratory Report UCRL-ID-129666, Livermore,
1997.
[6] M. R. Maheri and R. D. Adams, “Steady-State Flexural
Vibration Damping of Honeycomb Sandwich Beams,”
Composites Science & Technology (UK), Vol. 53, No. 3,
1994, pp. 333-347.
[7] W. Goldsmith and J. L. Sackman, “An Experimental Stu-
dy of Energy Absorption in Impact on Sandwich Plates,”
International Journal of Impact Engineering, Vol. 12, No.
2, 1992, pp. 241-262. doi:10.1016 /0734-743X(92) 90447-2
[8] W. Goldsmith and J. L. Sackman, “Dynamic Energy Ab-
Copyright © 2012 SciRes. JMMCE
S. S. HAVALDAR ET AL.
658
sorption of Sandwich Structures by Inelastic Deforma-
tion,” Technical Report: AFOSRTR-91-033, Washington
DC, 1991.
[9] M. K. Neilsen, “Continuum Representations of Cellular
Solids,” DOET Technical Report No. Sand-93-1287, Wash-
ington DC, 1993.
[10] R. D. Adams and M. R. Maheri, “Dynamic Shear Proper-
ties of Structural Honeycomb Materials,” Composites
Science and Technology, Vol. 47, No. 1, 1993, pp. 15-23.
doi:10.1016/0266-3538(93)90091-T
[11] Q. L. Liu and Y. Zhao, “Role of Anisotropic Core in Vi-
bration Properties of Honeycomb Sandwich Panels,”
Journal of Thermoplastic Composite Materials, Vol. 15,
No. 1, 2002, pp. 944-952.
[12] R. D Blevins, “Formulas for Natural Frequencies and
Mode Shape,” Krieger Publishing Company, Melbourne,
1979.
[13] L.-J. Xia, X.-F. Jin and Y.-B. Wang, “The Equivalent
Analysis of Honeycomb Sandwich Plates for Satellite
Structure,” 2001. http://www.mscsoftware.com
Copyright © 2012 SciRes. JMMCE
S. S. HAVALDAR ET AL. 659
Appendix
Density of unidirectional lamina

1
cffmmffmfm
vvvv
  
 v (1)
8
corefrp t
c

(1a)
Elastic constants of Uni-directional lamina
1
f
fm
EEvEv
m
(2)

2
f
mfmf
m
f
mfmf
EEEE v
EE EEEEv

 

   


(3)
12
f
fm
vm
v

 (4)
12 11
23 2
12 11
1
1
mm
ff mmmm m
EE
vv EE

 






(5)

12
f
mfmf
m
f
mfmf
GGGG v
GG GGGG v



   


(6)

22
23
23
21
E
G
(7)
Elastic constants of Bi-woven fibers




222
1112 2122
22
11
11212 2
1
21
212
UD WF
EEE E
EE
EE EE


 



 

(8)



2
12 2112 212
22
11
11212 2
4
212
UD WF
EE E
EE
EE EE






 

(9)


2
11223 122312213
11 1221
1
12
UD WF
EE
EE EE
 

 






(10)




22 22
23 1121223 12122
12 1122
3
1122
12
1
UD
WF
EEE
EE EE
E

E
 




(11)
12 12
11
UD WF
GG



(12)
23
212 13
111
2
WF
UD
EG G







(13)
Elastic constants of FRP honeycomb core [Ref. 13]
3
1
4
3
xt
E
l





 E
(14)
3
1
4
3
yt
E
l





 E
(15)
1zt
E
l



E
(16)
3
1
3
2
xy t
G
l






E
(17)
12
3
xz t
G
l





G (18)
12
3
2
yz t
G
l







G
(19)
1
xy
v
(20)
0.001
xz
v
(21)
0.001
yz
v
(22)
Copyright © 2012 SciRes. JMMCE
S. S. HAVALDAR ET AL.
660
Nomenclature
Symbol Description
f Density of fiber
m Density of matrix
c Density of composite
f
v Volume fraction of matrix
m
v Volume fraction of matrix
f
E Elastic modulus of fiber
m
E Elastic modulus of matrix
f
G Shear modulus of fiber
m
G Shear modulus of matrix
f
Poisson’s ratio of fiber
m
Poisson’s ratio of matrix
1
E Elastic modulus of FRP lamina in x direction
2
E Elastic modulus of FRP lamina in y direction
12
Poisson’s ratio of FRP lamina in plane 1-2
13
Poisson’s ratio of FRP lamina in plane 1-3
23
Poisson’s ratio of FRP lamina in plane 2-3
12
G Shear modulus of FRP lamina in plane 1-2
13
G Shear modulus of FRP lamina in plane 1-3
23
G Shear modulus of FRP lamina in plane 2-3
UD Uni-directional composite
WF Woven fiber composite
t, c Thickness of cell wall, size of cell
l Side of hexagon
Half angle between inclined sides
Technology coefficient (0.4 to 0.6)
x
E Young’s modulus of FRP honeycomb core in x direction
y
E Young’s modulus of FRP honeycomb core in y direction
z
E Young’s modulus of FRP honeycomb core in z direction
x
y
G Shear modulus of FRP honeycomb core in x-y plane
x
z
G Shear modulus of FRP honeycomb core in x-z plane
y
z
G Shear modulus of FRP honeycomb core in y-z plane
x
y
Poison’s ratio of FRP honeycomb core in x-y plane
x
z
Poison’s ratio of FRP honeycomb core in x-z plane
yz
Poison’s ratio of FRP honeycomb core in y-z plane
Copyright © 2012 SciRes. JMMCE